
 Open Access Article
 This Open Access Article is licensed under a Creative Commons Attribution-Non Commercial 3.0 Unported Licence
Universal and high-fidelity DNA single nucleotide polymorphism detection based on a CRISPR/Cas12a biochip†
Yong
Chen
a,
Yixin
Mei
a and
Xingyu
Jiang
 *ab
*ab
aDepartment of Biomedical Engineering, Southern University of Science and Technology, No. 1088, Xueyuan Rd., Xili, Nanshan District, Shenzhen, Guangdong, China. E-mail: jiang@sustech.edu.cn
bShenzhen Bay Laboratory, Shenzhen, Guangdong 518055, China
First published on 9th February 2021
Abstract
Single nucleotide polymorphisms (SNPs) are associated with many human diseases, so accurate and efficient SNP detection is of great significance for early diagnosis and clinical prognosis. This report proposes a universal and high-fidelity genotyping method in microfluidic point-of-care equipment based on the clustered regularly interspaced short palindromic repeat (CRISPR) system. Briefly, by systematically inserting the protospacer-adjacent-motif (PAM) sequence, we improved the universality of the CRISPR/Cas12a based SNP detection; by removing the complementary ssDNA and introducing an additional nucleotide mismatch, we improved the sensitivity and specificity. We preloaded the CRISPR/Cas12a reagents into the point-of-care biochip for automating the process, increasing the stability and long-term storage. This biochip enables us to rapidly and conveniently detect the genotypes within 20 min. In a practical application, the CRISPR/Cas12a biochip successfully distinguished three genotypes (homozygous wild type; the homozygous mutant type; and the heterozygous mutant type) of the CYP1A1*2 (A4889G, rs1048943), CYP2C19*2 (G681A, rs4244285), CYP2C9*3 (A1075C, rs1057910), and CYP2C19*3 (G636A, rs4986893) genes related to multiple cancers from 17 clinical blood samples. This CRISPR/Cas12a-based SNP genotyping method, being universal, accurate, and sensitive, will have broad applications in molecular diagnostics and clinical research.
Introduction
Single nucleotide polymorphisms (SNPs) refer to DNA sequence polymorphisms caused by a single nucleotide variation at the genomic level. SNPs are widespread in the human genome, occurring on average once in every 300 base pairs, and the total number is estimated to be 3 million or more. SNP detection is widely used in population genetics research (such as biological origin, evolution, and migration) and disease-related genetic research due to its heritability.1,2 SNP detection plays a vital role in pharmacogenomics, diagnostics, and biomedical research.3,4 SNP mutations have a significant impact on human health, and recent studies have shown that they are associated with various forms of cancers.5,6 Detecting SNP genotypes with high sensitivity and specificity is of great significance for the early diagnosis, prevention, and clinical prognosis. At present, there are several methods for SNP detection, such as pyrosequencing,7 restriction fragment length polymorphism (PCR-RFLP), fluorescent quantitative PCR (TaqMan PCR),8 mass array method (Mass assay),9 and high-resolution melting (HRM).10 They are difficult to be widely used due to expensive professional equipment, difficulty in automation, low sensitivity, difficulty in optimization, and so forth.The CRISPR/Cas-based detection platforms have become broadly useful due to their high sensitivity and specificity.11,12 Recently, CRISPR/Cas-based detection platforms have also demonstrated single nucleotide sensitivity.13–16 The Cas13a-based Specific High-Sensitivity Enzymatic Reporter UnLOCKing (SHERLOCK) platform has identified subtypes of the Zika virus and dengue fragments.13,14 The Cas14a-based DNA Endonuclease-Targeted CRISPR Trans Reporter (DETECTR) platform has discriminated single nucleotide mutation of the HERC2 gene associated with eye color.15 However, Cas13a and Cas14a only bind RNA and ssDNA, respectively, requiring an extra step to generate RNA or ssDNA from dsDNA to achieve dsDNA detection. As a straightforward solution, the Cas12b-mediated DNA detection (CDetection) platform provides a new technology based on the trans-cleavage properties of Cas12b nuclease triggered by targeted dsDNA.17 However, the CDetection platform faces significant challenges when applied to clinical specimens: (1) dsDNA activators with PAM sequences are not universal18 (only 20![[thin space (1/6-em)]](https://www.rsc.org/images/entities/char_2009.gif) 000 point mutations contain PAM sequences out of the 600000 point mutations in the NCBI ClinVar database17); (2) the detection of heterozygous mutation remains challenging. Thus, the CRISPR/Cas-based SNP detection requires further improvement, and new platforms with advanced features (such as universal applicability, high-fidelity, convenience, and sensitivity) are still desired.
000 point mutations contain PAM sequences out of the 600000 point mutations in the NCBI ClinVar database17); (2) the detection of heterozygous mutation remains challenging. Thus, the CRISPR/Cas-based SNP detection requires further improvement, and new platforms with advanced features (such as universal applicability, high-fidelity, convenience, and sensitivity) are still desired.
We establish a universal and high-fidelity method for detecting SNP genotypes of clinical samples based on CRISPR/Cas12a nuclease. Considering the PAM sequence constraint, we inserted the PAM sequences at a predetermined position by PCR amplification to extend the application scope. This strategy is suitable for the detection of any SNP site. High resolution and stability of the detection system are the prerequisites for detecting a heterozygous mutation. We improved the signal-to-noise ratio (SNR) of the CRISPR/Cas12a system by removing complementary ssDNA and introducing an additional nucleotide mismatch. To improve automation and decrease interference, we preloaded the CRISPR/Cas12a reagents into the point-of-care microfluidic biochip. Side-by-side comparison within the microchip also provides the most stringent comparison between the experimental groups and control groups. This strategy realizes the automation of detection and long-term storage of the detection biochip, which significantly improves the analytical performance. In a practical application, we verified the correctness of CRISPR/Cas12a biochip detection by comparing with pyrosequencing for four kinds of SNP sites, CYP1A1*2 (A4889G, rs1048943), CYP2C19*2 (G681A, rs4244285), CYP2C9*3 (A1075C, rs1057910), and CYP2C19*3 (G636A, rs4986893) genes, from 17 clinical blood samples. The final consistent results confirmed the stability and accuracy of the CRISPR/Cas12a-based SNP detection biochip. We believe that this universal and high-fidelity SNP detection platform will have broad applications in molecular diagnostics and clinical research.
Results and discussion
Principle of CRISPR/Cas12a for SNP detection
The CRISPR/Cas12a strategy can accurately and efficiently distinguish genotypes for any SNP sites. As shown in Scheme 1, our method consists mainly of two parts: (1) insertion of the PAM sequences upstream of the mutation site by PCR amplification; (2) detection of the SNP genotypes by the CRISPR/Cas12a technique. In our experiment, the CYP1A1*2 (A4889G, rs1048943) gene related to multiple cancers was selected as a target model.20,21 The base A at position 4889 replaced by G in the 7th exon forms the mutant type, and there are three genotypes in the human population, including the homozygous wild type (A/A), the homozygous mutant type (G/G), and the heterozygous mutant type (A/G). Compared with the allele-specific PCR (AS-PCR) introduced tuned nucleotide at the 3′ terminal, the inserted PAM sequences are far away from the 3′ terminal in our method, significantly improving the amplification efficiency and the success rate of primer design. So the primers containing PAM sequences can directly and efficiently amplify the gDNA extracted from whole blood (Scheme 1a). Moreover, both wild-type and mutant-type were successfully amplified by the same forward/reverse primers in our method, rather than the designed two pairs of primers for the wild-type and mutant-type, respectively, as in AS-PCR.22–24 So our strategy is more straightforward, versatile, and efficient in primer design than AS-PCR.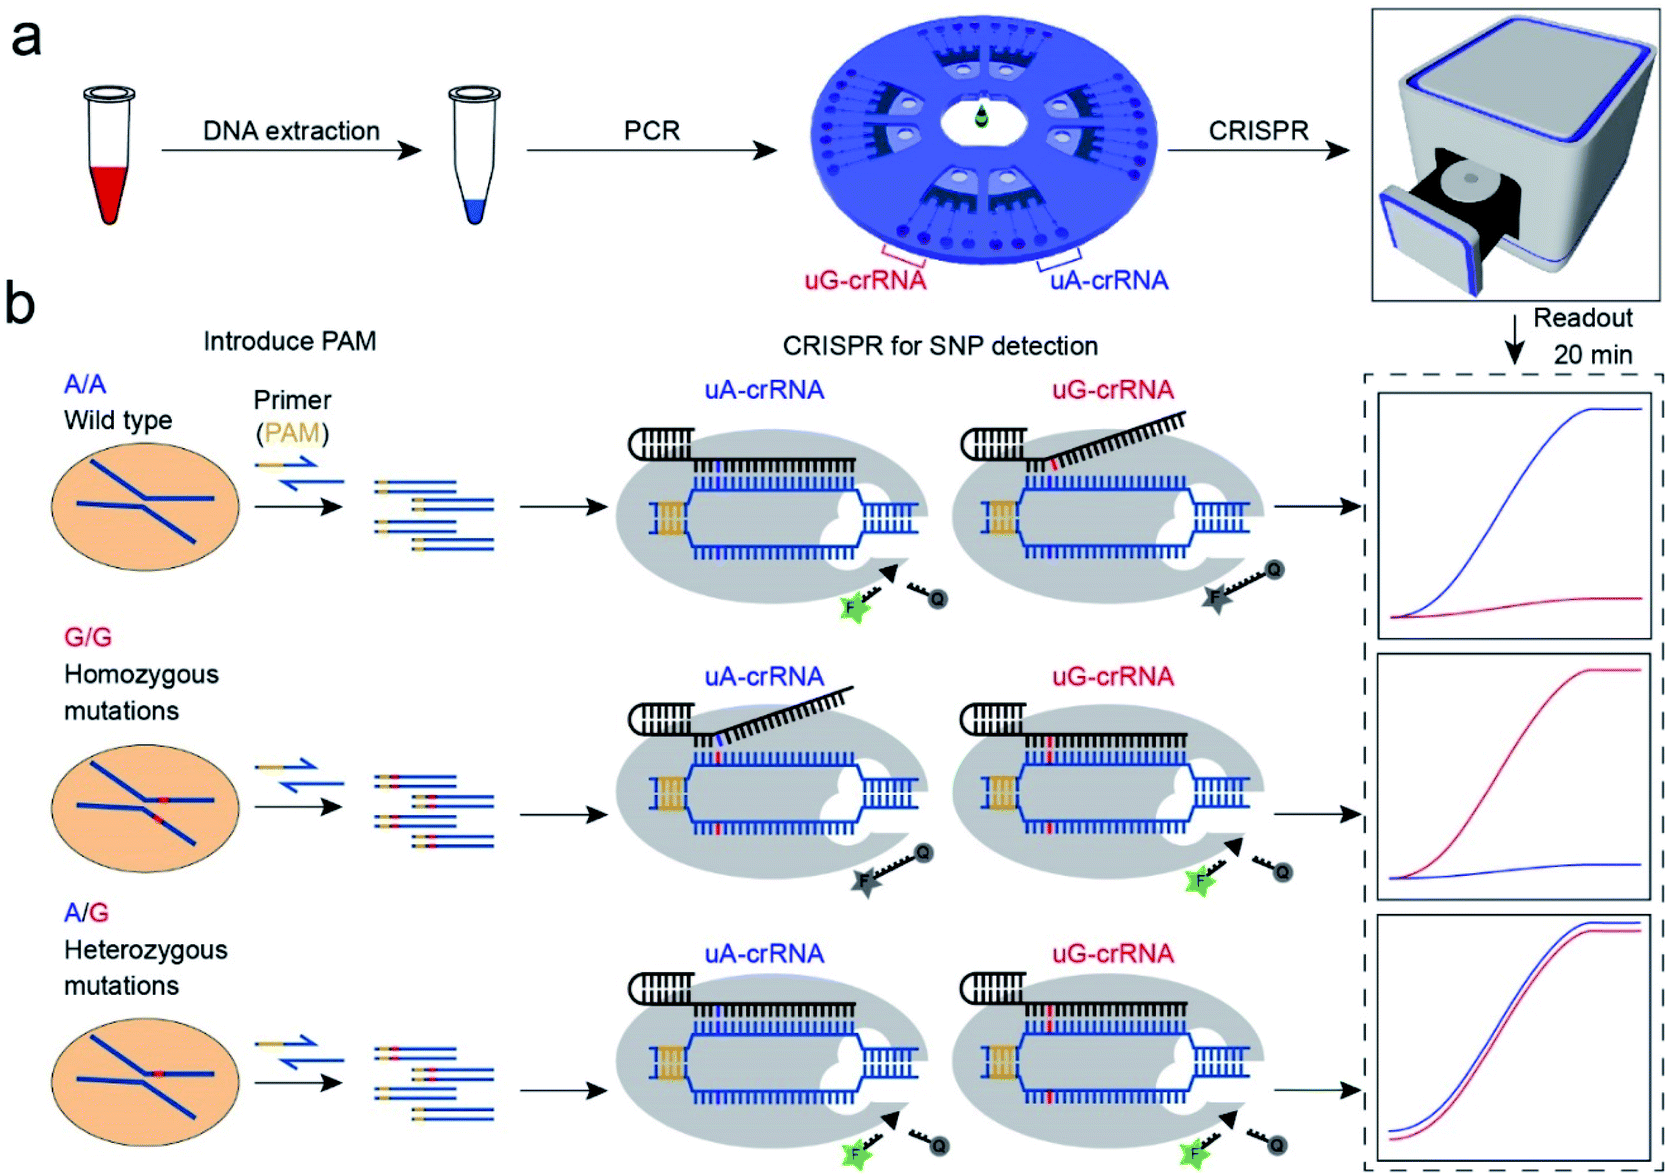 | ||
| Scheme 1 Schematic diagram of the CRISPR/Cas12a biochip for SNP detection. (a) The workflow of SNP site detection. The gDNA of whole blood as the template DNA for PCR amplification to insert the PAM sequences. The PCR amplification product was divided into two for parallel comparison detection in the uA-crRNA and uG-crRNA cells, respectively. (b) The SNP detection relies on the single nucleotide sensitivity of the CRISPR/Cas12a system. Briefly, uA-crRNA generated a strong signal only for the A/A sample, while uG-crRNA generated a strong signal only for the G/G sample. For the A/G sample, both reaction cells produced strong fluorescent signals. | ||
The genotyping of SNPs mainly relies on the single nucleotide sensitivity of the CRISPR/Cas12a system. The degree of complementarity between crRNA and target DNA significantly influences the trans-cleavage activity of Cas12a nuclease. As shown in Scheme 1b, the PCR amplification products with PAM sequences were added into the CRISPR/Cas12a biochip and divided into two for parallel comparison detection reactions, which contained both the Cas12a nuclease and tag ssDNA, but the crRNA sequence was slightly different. The uA-crRNA with the U base corresponds to the wild-type site A and uG-crRNA with the C base corresponds to the mutant-type site G, respectively. When the crRNA was complementary to the corresponding target DNA, Cas12a nuclease could rapidly trans-cleave tag ssDNA and produced a strong fluorescent signal. However, the activity of Cas12a nuclease would significantly decrease and it hardly generated the fluorescent signal when the crRNA mismatched with the target DNA. In this way, only the uA-crRNA reaction cell produced strong fluorescent signals for the A/A sample; only the uG-crRNA reaction cell produced strong fluorescent signals for the G/G sample; all the reaction cells produced strong fluorescent signals for the A/G sample. Thus, the CRISPR/Cas12a biochip can quickly, accurately, and efficiently detect the SNP genotypes by comparing the real-time fluorescence intensity in the reaction cell on the chip.
PAM sequence insertion
The PAM sequences are critical for SNP detection based on the CRISPR/Cas12a system. However, most of the target DNA does not contain the PAM sequences, or the PAM sequences are not in an appropriate position. In our experiment, the PAM sequences would systematically get inserted upstream of the mutant site of target DNA by PCR amplification. For the PCR primers, considering that the insertion of PAM sequences close to the 3′ terminal would dramatically reduce the amplification efficiency, we designed six forward primers with the PAM sequences at different positions to compare the amplification efficiency. These six designed primers are theoretically suitable for all three genotypes because they do not contain the mutant site. More primers were not attempted because the previous report indicated that the single nucleotide sensitivity would be significantly reduced when the PAM sequences were more than six bases away from the mutation site.16 As shown in Fig. 1a, the mutant sites of A/A and G/G genotypes are marked in blue and red, and the PAM sequences are marked with an orange background. Then we synthesized two standard DNA samples (A/A and G/G) to ensure the accuracy of the template DNA sequence (Table S1†). The A/G standard sample was obtained by mixing the A/A and G/G samples in equal amounts in the subsequent experiment. All six forward primers yielded the pure target band for the synthesized standard samples (Fig. S1†). However, as shown in Fig. 1b, when gDNA from whole blood was used as the template DNA, the amplification efficiency of primers No. 1 and 2 was significantly reduced, while the non-specific amplification products of primers No. 3–5 increased; only primer No. 6 amplified the pure target product with high efficiency. Considering the importance of pure target products and highly efficient amplification for ultrasensitive SNP detection, we thought that the inserted PAM sequences at the 6th base upstream of the mutation site are appropriate. Fig. S2† shows the gel electrophoresis results of the amplification products at different annealing temperatures, which indicate that the annealing temperature of 59 °C can further improve the amplification efficiency of primer No. 6. As we expected, we obtained single bands for A/A, G/G, and A/G samples when using primer No. 6 (Fig. 1b). Moreover, the reverse pyrosequencing results confirmed that the PAM sequences had successfully been inserted into the expected position after PCR amplification (Fig. 1c).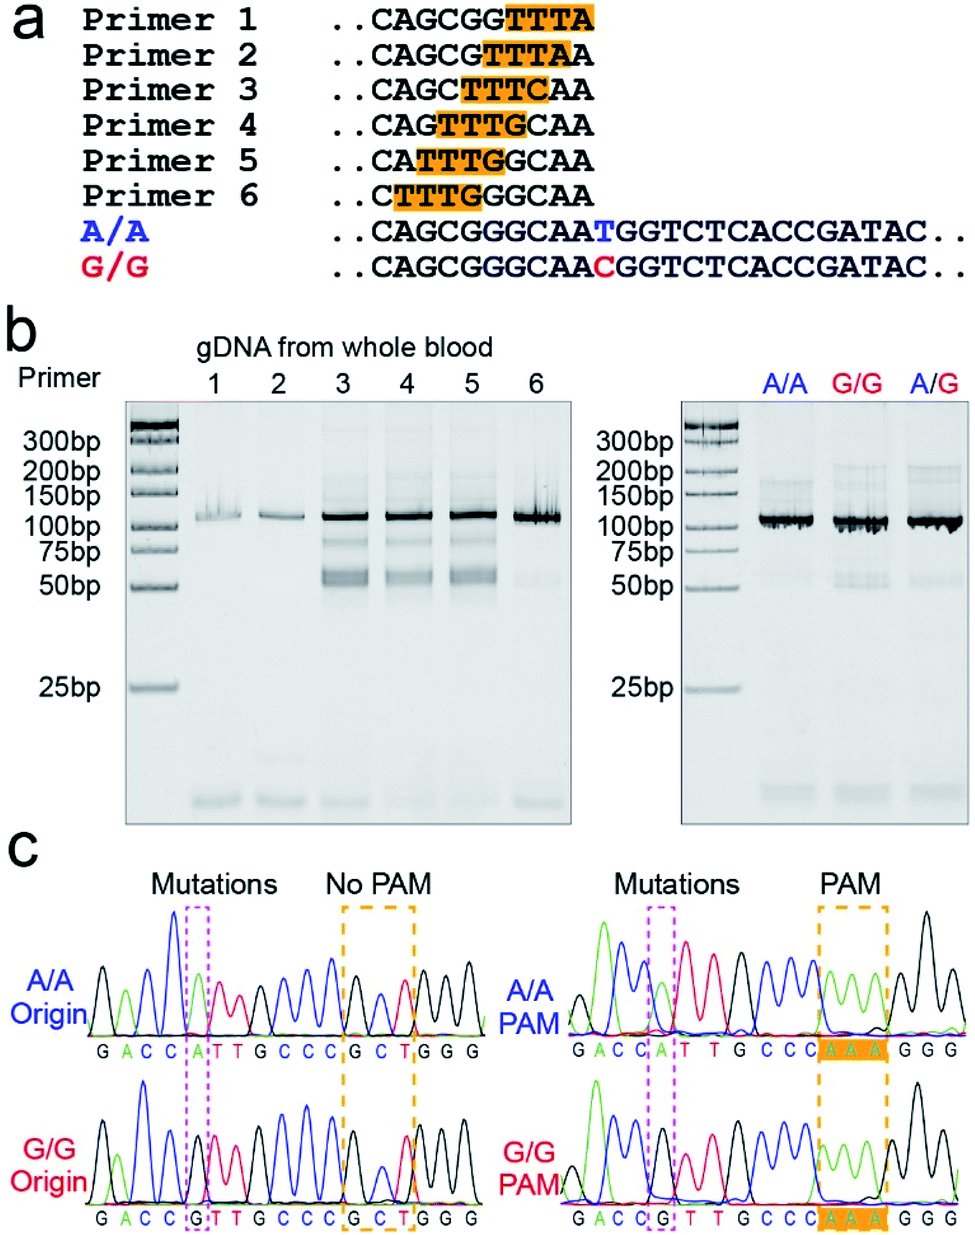 | ||
| Fig. 1 The PAM sequences were inserted upstream of the mutant site by PCR amplification. (a) Sequence information of six forward primers, A/A, and G/G target DNA. Six forward primers with slight differences in the PAM sequences sites were suitable for all three genotypes because they did not contain the mutant site. (b) Screening of the forward primers. The PCR amplification efficiency and non-specific amplification improved with the PAM sequences away from the 3′ terminal. The A/A, G/G, and A/G gDNA all amplified the single target product through primer No. 6. (c) The reverse pyrosequencing results of A/A and G/G samples with primer No. 6 indicated that the PAM sequences had successfully been inserted into the A/A and G/G amplification products. | ||
Effect of the forward and reverse primer dosage ratio on SNP detection
Fig. 2a shows the A-crRNA and G-crRNA sequences designed according to the PAM sequence position in the amplification products and the genotypes. The complementary sequences of crRNA and target DNA are marked in green. Unfortunately, the results were too bad to distinguish the SNP genotype when the three standard DNA amplification products were added into the CRISPR/Cas12a system (Fig. S3†). According to previous reports, the trans-cleavage activity of Cas12a nuclease can be activated by targeting dsDNA with the PAM sequences or ssDNA complementation with crRNA.16,25 However, the CRISPR/Cas12a system activated by ssDNA has no single nucleotide sensitivity, significantly impacting SNP detection. So, in our opinion, when the number of forward primers was less than or approximately equal to that of reverse primers, a small part of complementary reverse ssDNA would activate the trans-cleavage activity of Cas12a nuclease without single nucleotide sensitivity, which would interfere with the SNP detection system. And this problem can be solved when excess forward primers are added because the forward ssDNA cannot complement the crRNA. As shown in Fig. 2b, to prove our hypothesis, we amplified the CYP1A1 gene sequence with excess forward (no PAM sequences) or reverse primers, respectively, and then detected the fluorescent signal by the CRISPR/Cas12a system. In this verification experiment, the dsDNA without the PAM sequences cannot activate Cas12a nuclease. When excess forward primers were added, the amplification products were composed of dsDNA without PAM sequences and forward ssDNA non-complementary with the crRNA, and no signal was generated. However, when excess reverse primers were added, the amplification products were composed of dsDNA without PAM sequences and reverse ssDNA complementary with the crRNA, and the interference signal cannot distinguish the SNP genotype generated from reverse ssDNA. The results shown in Fig. 2c are consistent with our expectations. The CRISPR/Cas12a system generated a strong fluorescent signal for both A-crRNA and G-crRNA reactions when the reverse primers were excess. However, there is no signal generated when the forward primers were excess. So in the subsequent amplification process, we would add more forward primers to minimize complementary reverse ssDNA interference.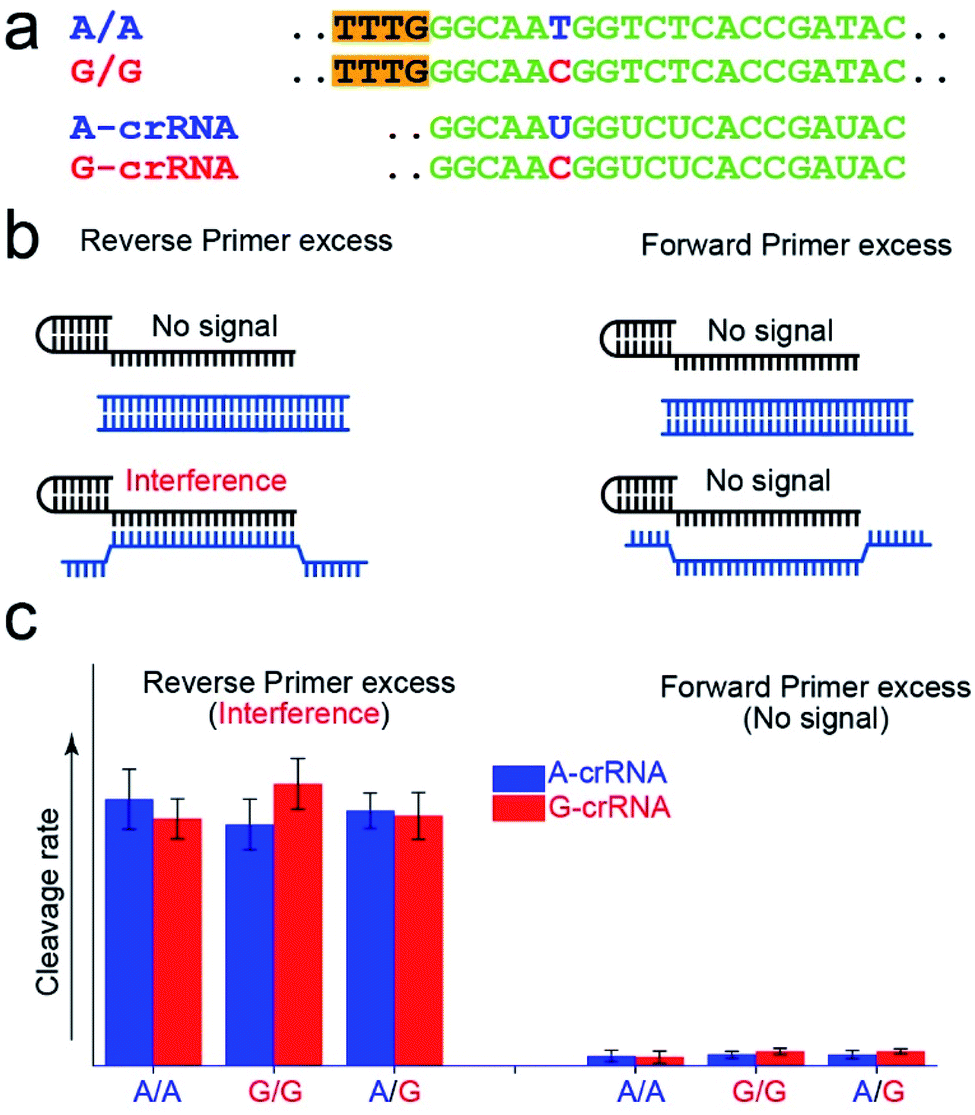 | ||
| Fig. 2 Minimization of the interference of complementary reverse ssDNA by controlling the dosage of the forward and reverse primers. (a) The sequence information of crRNA and target DNA. The complementary sequences of crRNA and target DNA are marked in green, the mutant sites are marked in blue and red, and the PAM sequences are marked with an orange background. (b) The excess reverse primers interfere with the CRISPR/Cas12a-based SNP detection, because the trans-cleavage activity of Cas12a nuclease is activated by reverse ssDNA without single nucleotide sensitivity. (c) Excess forward primers minimize the interference of the complementary reverse ssDNA. The dsDNA without the PAM sequences does not activate Cas12a nuclease. | ||
Effect of the crRNA sequence on the SNP detection
The CRISPR/Cas12a detection system obtained the expected results with standard DNA (A/A, G/G, and A/G) as the template after the optimal steps of PAM sequence insertion and complementary reverse ssDNA removal (Fig. 3a). A strong signal was observed when the crRNA and target DNA were completely complementary, such as A-crRNA for the A/A genotype and G-crRNA for the G/G genotype. Meanwhile, only half of the signal strength was detected when the crRNA and target DNA were mismatched, such as A-crRNA for the G/G genotype and G-crRNA for the A/A genotype. For the A/G genotype, the signal strengths of the two parallel detection systems (A-crRNA and G-crRNA) were the same due to the amplification products containing equal amounts of A/A and G/G genotypes. However, a doubling of the signal difference is not enough to distinguish the SNP genotype in the actual detection, which tends to produce ambiguous results due to fluctuations in operation, especially for the heterozygous mutant type, A/G genotype. The main reason is that a single base mismatch is not enough to impact the stability of crRNA and the target DNA significantly. The trans-cleavage activity of Cas12a nuclease decreased with the growth in the number of mismatched nucleotides between crRNA and target DNA. We designed an additional single nucleotide mismatch (A → U, marked as “u”) adjacent to the mutant site (Fig. 3b). As shown in Fig. S4,† when crRNA completely complements the target DNA, the CRISPR/Cas12a system produced a fluorescent signal only twice as strong as that produced by a single nucleotide mismatch, and the signal strength again decreased by nearly ten times when we added the additional nucleotide “u” mismatch adjacent to the mutant site. Considering that further signal reduction would affect the detection sensitivity and the 10-fold signal difference was sufficient to distinguish SNP genotypes, we decided to introduce only one additional mismatch base to improve the SNP detection.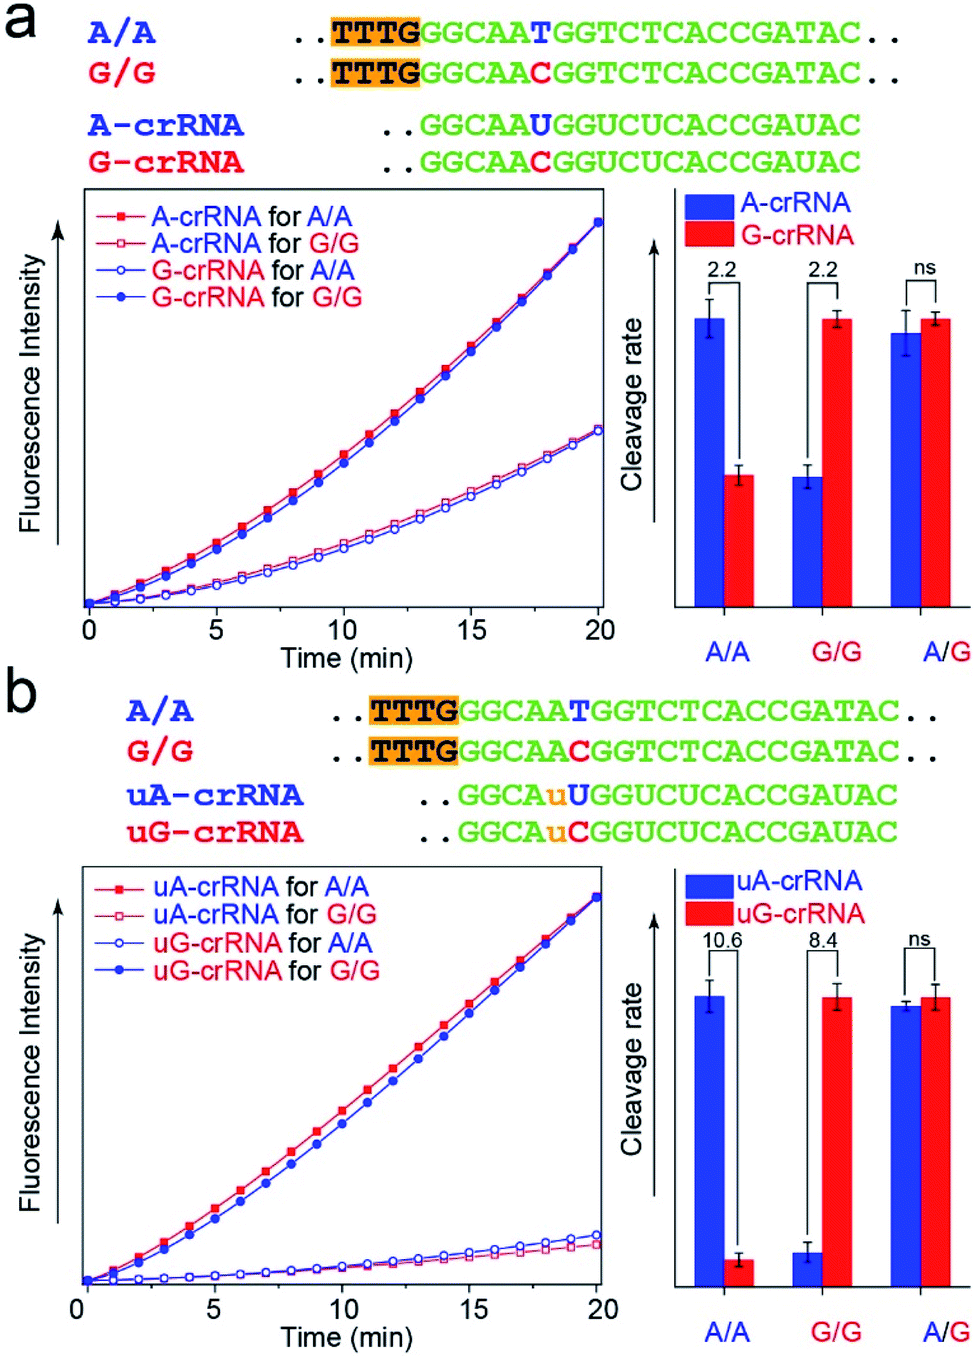 | ||
| Fig. 3 Improvement of the SNR through an additional mismatch nucleotide. (a) Real-time fluorescence kinetics measurement and trans-cleavage rate histogram from the CRISPR/Cas12a system with A-crRNA and G-crRNA. The two times signal difference is usually indistinguishable in complex actual detection. (b) Real-time fluorescence kinetics measurement and cleavage rate histogram from the CRISPR/Cas12a system with uA-crRNA and uG-crRNA. An additional nucleotide mismatch improves the SNR from 2-fold to nearly 10-fold. | ||
In the PCR reaction, the amplification product amounts are affected by many factors, such as the template concentration, enzyme activity, and primer efficiency. To directly use the amplification products for the CRISPR/Cas12a detection without purification and quantification, we studied the influence of the dosage of Cas12a nuclease on the stability of the detection system. The results in Fig. S5† show that the SNR of the CRISPR/Cas12a system significantly improved with the increase in the dosage of Cas12a nuclease and tag ssDNA. The detection system is almost unaffected by the concentration of amplification products when the Cas12a nuclease amount is excess (Fig. S6,† 300 nM > 200 nm, the theoretical maximum concentration of the amplification products in our experiment).
CRISPR/Cas12a detection chip
The stability of parallel experiments is crucial for SNP detection using the CRISPR/Cas12a system. So we designed a centrifugal microfluidic chip and the corresponding point-of-care analytical equipment to reduce the exogenous interference in the detection process.26–30 Considering the complexity of mixing reagents and the difficulty of storing-crRNA solution, as in our previous reports, we preloaded the mixed reagents of the CRISPR/Cas12a system into the biochip by freeze-drying technology.31 As shown in Fig. 4a, the CRISPR/Cas12a biochip can simultaneously test eight samples. Approximately 50 μL sample solution is required for each test, which enters the sample cell through the sample hole, and the vent hole facilitates the addition of samples. The sample solution enters each reaction cell upon increasing the rotation speed and time when we put the CRISPR/Cas12a biochip into the analytical equipment (Fig. 4b). Each sample is divided into two well-controlled experiments for side-by-side comparison (uA-crRNA and uG-crRNA), and each contrast test contains two replications. Three amplification products of the templates (A/A, G/G, and A/G) were diluted and added into the CRISPR/Cas12a biochip for genotype detection. The results shown in Fig. S7† indicate that the CRISPR/Cas12a biochip has good stability and reproducibility. Moreover, we obtained the endpoint fluorescent image, which is conducive to rapid detection in a low-resource field (Fig. 4c).32 The results in Fig. 4d prove that the performance of the CRISPR/Cas12a biochip has not significantly decreased after a month of storage at −20 °C in the dark.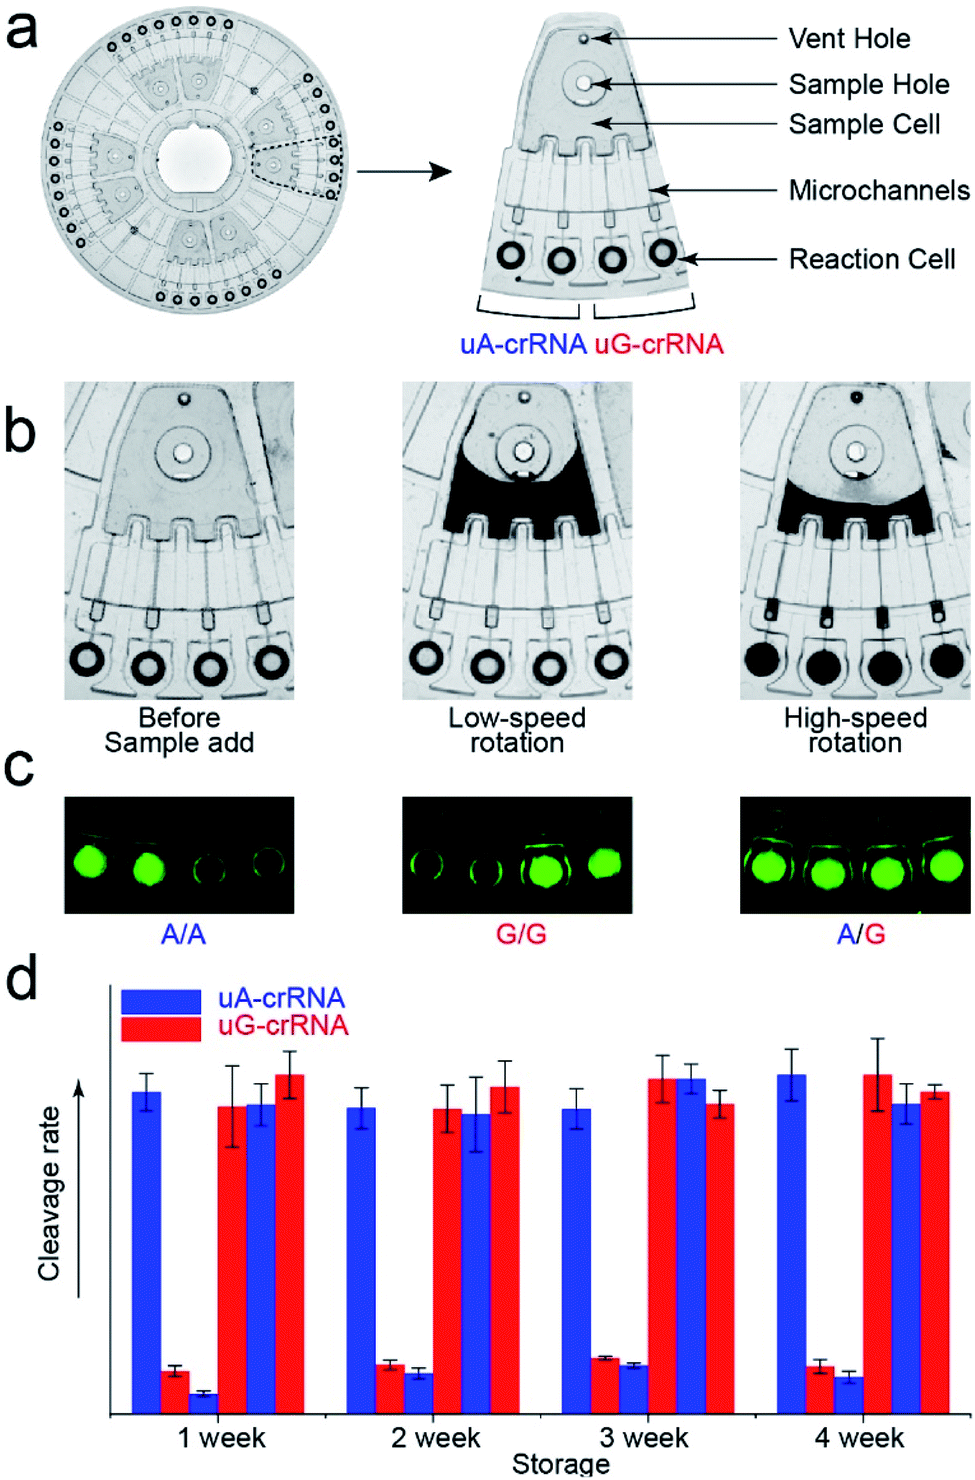 | ||
| Fig. 4 The structure of the CRISPR/Cas12a biochip. (a) Image of the centrifugal microfluidic chip (Φ = 83 mm) and functional partitions. The CRISPR/Cas12a biochip can simultaneously test eight samples, and each sample is divided into two contrast tests (uA-crRNA and uG-crRNA). (b) The flow stage of the sample liquid in the chip with the increase of rotation speed and time. (c) The fluorescent images from the reaction cell of the biochip after 20 min reaction, which indicate that the endpoint detection is also in a fast and straightforward readout mode. (d) The detection result of the three genotypes (A/A, G/G, and A/G) after the chip was stored for one month. | ||
Human blood sample detection
Finally, we detected the genotypes for the CYP1A1*2 (A4889G, rs1048943) gene from 17 human whole blood samples using the CRISPR/Cas12a biochip. The significant signal differences from the uA-crRNA and uG-crRNA reaction cells determined the SNP genotypes, which showed 12 A/A samples, 4 A/G samples, and 1 G/G among the 17 human blood samples. As shown in Table S2,† these results were consistent with pyrosequencing results (the standard method for SNP detection). Further, we added the comparative pyrosequencing results from forward/reverse primers without mismatch nucleotides (forward/reverse primer-L), which indicated that amplification products from the forward/reverse primers containing PAM sequences did not affect the mutation site (Table S2†). Fig. 5a shows the detection results of representative samples No. 1, No. 3, and No. 5 obtained using the CRISPR/Cas12a biochip and pyrosequencing.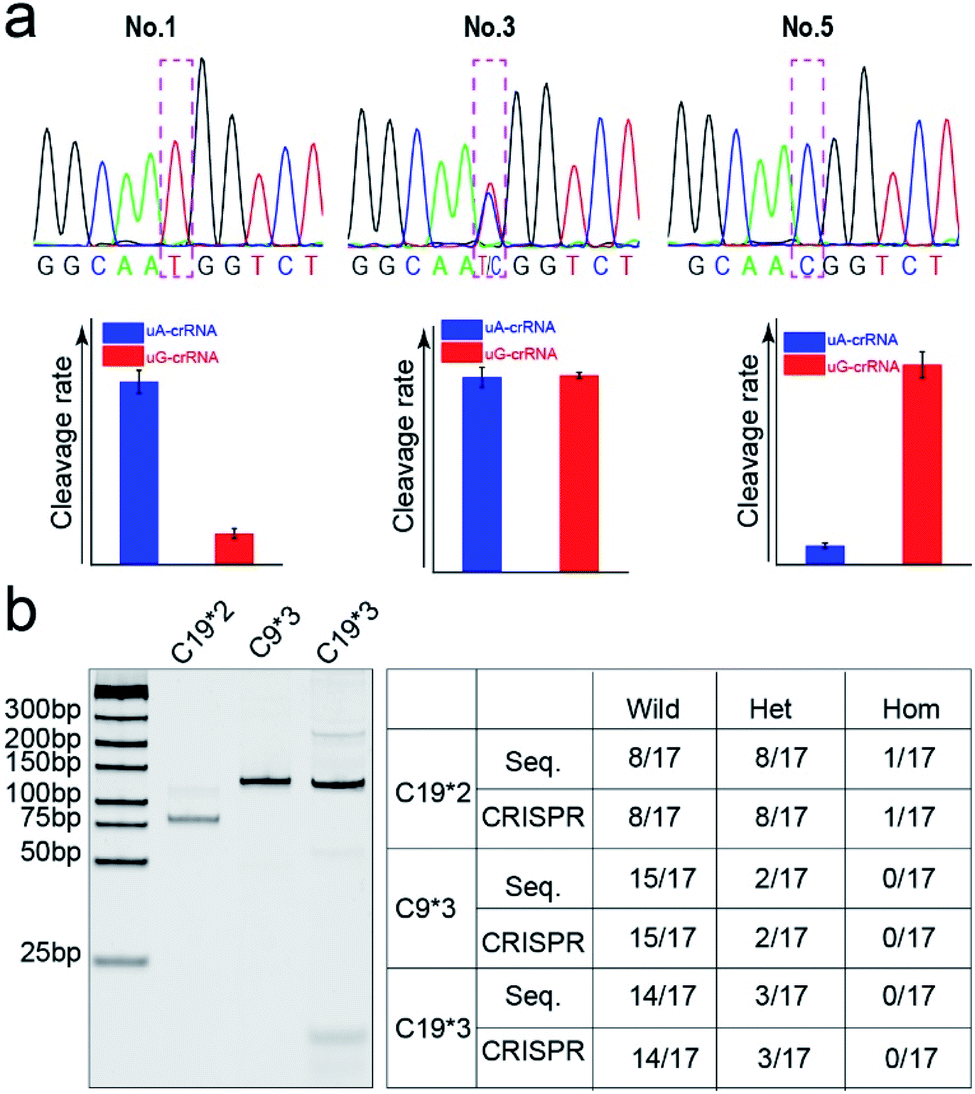 | ||
| Fig. 5 The comparison of SNP genotyping detected through pyrosequencing and the CRISPR/Cas12a biochip. (a) The genotyping results of three typical samples (No. 1, 3, and 5) from the CRISPR/Cas12a biochip and pyrosequencing for the CYP1A1*2 (A4889G, rs1048943) gene. (b) The gel electrophoresis image and SNP detection results for CYP2C19*2 (G681A, rs4244285), CYP2C9*3 (A1075C, rs1057910), and CYP2C19*3 (G636A, rs4986893) genes. | ||
To further confirm the universality of the CRISPR/Cas12a biochip, we additionally detected three SNP sites from CYP2C19*2 (G681A, rs4244285), CYP2C9*3 (A1075C, rs1057910), and CYP2C19*3 (G636A, rs4986893) genes.33 As a special target sequence, the CYP2C19*2 (G681A, rs4244285) gene itself contained PAM sequences upstream of the mutation site, so we could achieve CRISPR/Cas12a-based genotyping by traditional PCR amplification, indicating that the insertion of PAM sequences can be adjusted flexibly according to the actual target sequences. The corresponding target sequence, primer sequence, and crRNA sequence are shown in Tables S3–S8.† The optimization results of the annealing temperatures for three genes are shown in Fig. S8,† which indicated that three forward/reverse primers could successfully amplify the corresponding samples. The above 17 clinical blood samples were again used for genotyping these three SNP sites. The results showed that there were 8 G/G samples, 8 G/A samples, and 1 A/A sample for the CYP2C19*2 (G681A, rs4244285) gene; 15 A/A samples and 2 A/C samples for the CYP2C9*3 (A1075C, rs1057910) gene; 14 G/G samples and 3 G/A samples for CYP2C19*3 (G636A, rs4986893), which were consistent with pyrosequencing results (Tables S3–S8†). Fig. 5b shows the gel electrophoresis image of the three target genes, and the comparison of SNP genotyping results from pyrosequencing and the CRISPR/Cas12a biochip.
These results indicated that the CRISPR/Cas12a biochip could effectively distinguish SNP sites. Thus, the technology of combining the CRISPR/Cas12a biochip and PCR amplification has good practicability and market application prospects for SNP site detection.
Conclusions
This paper proposes a universal and high-fidelity CRISPR/Cas12a-based SNP detection method in point-of-care microfluidics. This approach has the following advantages: (1) insertion of PAM sequences upstream of the mutant site of target DNA to broaden applicability; (2) addition of excess forward primers to minimize the interference from complementary reverse ssDNA; (3) introduction of an additional mismatch in crRNA to improve the signal-to-noise ratio. To demonstrate its application, we successfully detected three genotypes of four SNP sites, CYP1A1*2 (A4889G, rs1048943), CYP2C19*2 (G681A, rs4244285), CYP2C9*3 (A1075C, rs1057910), and CYP2C19*3 (G636A, rs4986893) genes, from 17 human blood samples. The genotyping results of the CRISPR/Cas12a biochip were consistent with those of pyrosequencing. The CRISPR/Cas12a biochip has the advantages of being rapid, universal, and high-fidelity, and is expected to be applied in medical diagnosis. This approach may also be useful for various applications, such as family lineage analysis, agriculture, basic research in biology/biochemistry, population genetics research, biological origin, evolution, and migration.Experimental
Regents and materials
Lachnospiraceae bacterium Cas12a (LbCas12a) protein was from New England Biolabs (100 μM, Shenzhen Yiliang Biotechnology). The DNA/RNA nucleic acids (Tables S1–S4†) were from Nanjing GenScript Biotechnology. The Taq polymerases (5 U μL−1) and dNTP (2.5 mM) were from Takara Biomedical Technology (Beijing Bioroyee Biotechnology). The blood extraction kit was from BioTeke Corporation (Shenzhen Baishun Biotechnology). The centrifugal microfluidic chip and detection equipment were from Shanghai Suxin Biotechnology.19 The eighteen human whole blood samples were from Shenzhen People's Hospital (approved by the Medical Ethics Review Committee of the Shenzhen People's Hospital, No. LL-KT-201801125).CRISPR/Cas12a reagent-loaded and microfluidic analytical equipment
The point-of-care microfluidic chip is made of polymethyl methacrylate (PMMA) by the microinjection molding method. The chip is mainly composed of a sample cell, microchannel, and reaction cell. An optimized 50 μL CRISPR/Cas12a reaction contained 500 nM Cas12a, 500 nM crRNA (uA-crRNA and uG-crRNA reactions were performed in different reaction cells), 500 nM tag ssDNA, 5% (w/w) trehalose, and 0.5% (w/w) Ficoll 400. The mixture was carefully added to the outer reaction cells (about 5 μL) of the centrifugal microfluidic chip. We placed the chip at a distance of 1 cm above liquid nitrogen to flash-freeze the reagents for 2 min, followed by freeze-drying for 2 h. We took out and sealed the chip with the bottom and top membrane after the chip returned to room temperature. Finally, we put the chip in a −20 °C dark environment for long-term storage.The automated analytical equipment can accurately control the temperature of the reaction area, the rotation speed of the chip to distribute the sample, and perform the collection of fluorescent signals every 30 s for the 32 reaction cells to obtain the fluorescence kinetics data. The program on the PC communicates with the primary control circuit through the serial port RS232 to realize information exchange and displays the instrument status on the PC in real-time.
Preparation of PCR samples
The human blood gDNA was extracted using a blood extraction kit and used as the template DNA for the PCR reaction. In the PCR reaction, a 50 μL PCR reaction mixture contained 0.5 μL Taq polymerase (5 U μL−1), 4 μL dNTP (2.5 mM), 5 μL PCR buffer (10×), 2 μL forward primer (10 μM), 1 μL reverse primer (10 μM), 2 μL blood gDNA (1–10 ng of gDNA), and 35.5 μL DNase/RNase-free water. The thermal cycling protocol included an initial activation of Taq polymerase at 95 °C for 3 min, followed by 30 cycles of 95 °C for 30 s, 59 °C for 30 s, and 72 °C for 20 s, and a final extension step at 72 °C for 2 min.SNP detection with the CRISPR/Cas12a point-of-care biochip
5 μL of the product, 0.42.5 μL of DNase/RNase-free water, and 2.5 μL of MgAc (280 mM) were mixed and added into the chip. After putting the chip into the analytical equipment, we set the low-speed rotation once at 500 rpm for 10 s, followed by the high-speed rotation three times at 4500 rpm for 20 s each time. The reaction temperature is set at 37 °C for 20 min. Finally, the real-time fluorescence kinetics measurement of CRISPR/Cas12a detection was obtained to identify SNP mutations.Conflicts of interest
There are no conflicts to declare.Acknowledgements
We thank the National Key R&D Program of China (2018YFA0902600), the National Natural Science Foundation of China (21535001, 81730051, 21761142006), Guangdong Province (2019 ZT08Y191), Department of Education of Guangdong Province (2019KQNCX130), Shenzhen City (KQTD20190929172743294, JCYJ20200109141231365), Shenzhen Bay Laboratory (SZBL2019062801004), and Tencent Foundation through the XPLORER PRIZE for financial support.Notes and references
- S. Karmakar and P. J. Hrdlicka, Chem. Sci., 2013, 4, 3447–3454 RSC.
- K. T. Kim and N. Winssinger, Chem. Sci., 2020, 11, 4150–4157 RSC.
- O. Seehausen, R. K. Butlin, I. Keller, C. E. Wagner, J. W. Boughman, P. A. Hohenlohe, C. L. Peichel, G. P. Saetre, C. Bank, A. Brannstrom, A. Brelsford, C. S. Clarkson, F. Eroukhmanoff, J. L. Feder, M. C. Fischer, A. D. Foote, P. Franchini, C. D. Jiggins, F. C. Jones, A. K. Lindholm, K. Lucek, M. E. Maan, D. A. Marques, S. H. Martin, B. Matthews, J. I. Meier, M. Most, M. W. Nachman, E. Nonaka, D. J. Rennison, J. Schwarzer, E. T. Watson, A. M. Westram and A. Widmer, Nat. Rev. Genet., 2014, 15, 176–192 CrossRef CAS.
- L. Zhang, Y. Zhang, C. Y. Wang, Q. A. Feng, F. Fan, G. J. Zhang, X. X. Kang, X. Z. Qin, J. S. Sun, Y. G. Li and X. Jiang, Anal. Chem., 2014, 86, 10461–10466 CrossRef CAS.
- S. Tuupanen, M. Turunen, R. Lehtonen, O. Hallikas, S. Vanharanta, T. Kivioja, M. Bjorklund, G. H. Wei, J. Yan, I. Niittymaki, J. P. Mecklin, H. Jarvinen, A. Ristimaki, M. Di-Bernardo, P. East, L. Carvajal-Carmona, R. S. Houlston, I. Tomlinson, K. Palin, E. Ukkonen, A. Karhu, J. Taipale and L. A. Aaltonen, Nat. Genet., 2009, 41, 885 CrossRef CAS.
- L. J. Chin, E. Ratner, S. G. Leng, R. H. Zhai, S. Nallur, I. Babar, R. U. Muller, E. Straka, L. Su, E. A. Burki, R. E. Crowell, R. Patel, T. Kulkarni, R. Homer, D. Zelterman, K. K. Kidd, Y. Zhu, D. C. Christiani, S. A. Belinsky, F. J. Slack and J. B. Weidhaas, Cancer Res., 2008, 68, 8535–8540 CrossRef CAS.
- D. J. Schaid, W. N. Chen and N. B. Larson, Nat. Rev. Genet., 2018, 19, 491–504 CrossRef CAS.
- M. Hayashida, T. Ota, M. Ishii, K. Iwao-Koizumi, S. Murata and K. Kinoshita, Anal. Sci., 2014, 30, 427–429 CrossRef CAS.
- M. P. Millis, Methods Mol. Biol., 2011, 700, 61–76 CrossRef CAS.
- Y. R. Lee, J. Kim, S. Y. Lee and J. Lee, Hortic., Environ. Biotechnol., 2020, 61, 371–383 CrossRef CAS.
- S. Peng, Z. Tan, S. Y. Chen, C. Y. Lei and Z. Nie, Chem. Sci., 2020, 11, 7362–7368 RSC.
- Y. Chen, S. X. Yang, S. Peng, W. Li, F. Wu, Q. Yao, F. Wang, X. C. Weng and X. Zhou, Chem. Sci., 2019, 10, 2975–2979 RSC.
- J. S. Gootenberg, O. O. Abudayyeh, J. W. Lee, P. Essletzbichler, A. J. Dy, J. Joung, V. Verdine, N. Donghia, N. M. Daringer, C. A. Freije, C. Myhrvold, R. P. Bhattacharyya, J. Livny, A. Regev, E. V. Koonin, D. T. Hung, P. C. Sabeti, J. J. Collins and F. Zhang, Science, 2017, 356, 438–442 CrossRef CAS.
- C. Myhrvold, C. A. Freije, J. S. Gootenberg, O. O. Abudayyeh, H. C. Metsky, A. F. Durbin, M. J. Kellner, A. L. Tan, L. M. Paul, L. A. Parham, K. F. Garcia, K. G. Barnes, B. Chak, A. Mondini, M. L. Nogueira, S. Iserm, S. F. Michael, I. Lorenzana, N. L. Yozwiak, B. L. Maclnnis, I. Bosch, L. Gehrke, F. Zhang and P. C. Sabeti, Science, 2018, 360, 444–448 CrossRef CAS.
- L. B. Harrington, D. Burstein, J. S. Chen, D. Paez-Espino, E. Ma, I. P. Witte, J. C. Cofsky, N. C. Kyrpides, J. F. Banfield and J. A. Doudna, Science, 2018, 362, 839–842 CrossRef CAS.
- J. S. Chen, E. B. Ma, L. B. Harrington, M. Da Costa, X. R. Tian, J. M. Oalefsky and J. A. Doudna, Science, 2018, 360, 436–439 CrossRef CAS.
- F. Teng, L. Guo, T. Cui, X. G. Wang, K. Xu, Q. Gao, Q. Zhou and W. Li, Genome Biol., 2019, 20, 132 CrossRef.
- R. Rabinowitz, S. Almog, R. Darnell and D. Offen, Front. Genet., 2020, 11, 851 CrossRef CAS.
- X. Ye, Y. Li, X. Fang and J. Kong, ACS Sens., 2020, 5, 1132–1139 CrossRef CAS.
- U. M. Zanger and M. Schwab, Pharmacol. Ther., 2013, 138, 103–141 CrossRef CAS.
- C. Esser and A. Rannug, Pharmacol. Rev., 2015, 67, 259–279 CrossRef CAS.
- H. B. Wang, L. H. Ma, T. Zhang, K. C. Huang, Y. D. Zhao and T. C. Liu, Anal. Chim. Acta, 2020, 1093, 106–114 CrossRef CAS.
- T. L. Li, M. W. Wu, W. C. Lin, C. H. Lai, Y. H. Chang, L. J. Su and W. Y. Chen, Anal. Bioanal. Chem., 2019, 411, 3871–3880 CrossRef CAS.
- F. L. Xu, M. Ding, X. Xia, X. Wu, J. J. Zhang, J. X. Xing, J. F. Xuan, J. Yao and B. J. Wang, Electrophoresis, 2019, 40, 1591–1599 CrossRef CAS.
- L. Li, S. Li, N. Wu, J. Wu, G. Wang, G. Zhao and J. Wang, ACS Synth. Biol., 2019, 8, 2228–2237 CrossRef CAS.
- R. Dong, Y. Liu, L. Mou, J. Deng and X. Jiang, Adv. Mater., 2019, 31, 1805033 CrossRef CAS.
- Y. Yang, Y. Chen, H. Tang, N. Zong and X. Y. Jiang, Small Methods, 2020, 4, 1900451 CrossRef CAS.
- M. W. Dou, D. C. Dominguez, X. J. Li, J. Sanchez and G. Scott, Anal. Chem., 2014, 86, 7978–7986 CrossRef CAS.
- M. W. Dou, S. T. Sanjay, D. C. Dominguez, P. Liu, F. Xu and X. J. Li, Biosens. Bioelectron., 2017, 87, 865–873 CrossRef CAS.
- Y. Q. Yang, K. Goh, R. Wang and T. H. Bae, Chem. Commun., 2017, 53, 4254–4257 RSC.
- Y. Chen, Y. Mei, X. Zhao and X. Jiang, Anal. Chem., 2020, 92, 14846–14852 CrossRef.
- J. J. Zhang, L. Mou and X. Y. Jiang, Chem. Sci., 2020, 11, 923–936 RSC.
- A. Ishiguro, T. Kubota, Y. Soya, H. Sasaki, O. Yagyu, Y. Takarada and T. Iga, Anal. Biochem., 2005, 337, 256–261 CrossRef CAS.
Footnote |
| † Electronic supplementary information (ESI) available. See DOI: 10.1039/d0sc05717g |
| This journal is © The Royal Society of Chemistry 2021 |