Quantitative analysis of excipient dominated drug formulations by Raman spectroscopy combined with deep learning†
Xiang
Fu
a,
Li-min
Zhong
a,
Yong-bing
Cao
*bc,
Hui
Chen
 d and
Feng
Lu
*d
aKongjiang Hospital of Shanghai, Yangpu District, Shanghai, China
bDepartment of Vascular Disease, Shanghai TCM-Integrated Hospital, Shanghai University of Traditional Chinese Medicine, Shanghai, China. E-mail: ybcao@vip.sina.com
cDepartment of Foundation and New Drug Research, Shanghai TCM-Integrated Institute of Vascular Disease, Shanghai, China
dSchool of Pharmacy, Second Military Medical University, Shanghai, China. E-mail: fenglu@smmu.edu.cn
First published on 11th December 2020
Abstract
Owing to the growing interest in the application of Raman spectroscopy for quantitative purposes in solid pharmaceutical preparations, an article on the identification of compositions in excipient dominated drugs based on Raman spectra is presented. We proposed label-free Raman spectroscopy in conjunction with deep learning (DL) and non-negative least squares (NNLS) as a solution to overcome the drug fast screening bottleneck, which is not only a great challenge to drug administration, but also a major scientific challenge linked to falsified and/or substandard medicines. The result showed that Raman spectroscopy remains a cost effective, rapid, and user-friendly method, which if combined with DL and NNLS leads to fast implantation in the identification of lactose dominated drug (LDD) formulations. Meanwhile, Raman spectroscopy with the peak matching method allows a visual interpretation of the spectral signature (presence or absence of active pharmaceutical ingredients (APIs) and low content APIs).
1. Introduction
The remarkable growth of the pharmaceutical market has led to the emergence of numerous excipient dominated drug formulations. These drugs contain both low content active ingredient(s) and high-level excipients added to aid the formulation and to manufacture the subsequent dosage form.1–3 In general, excipients can be distinguished from different applications, such as binders (starch), diluents (lactose), lubricants (magnesium stearate), disintegrants (CMC-Ca) and so on. Sometimes, one excipient can be used for numerous purposes. Binding agents are added to increase the cohesiveness of powders to ensure that the powder forms granules, which in turn can aid tablet formation. Diluents should be added to increase the tablet size or the amount of powder present in a capsule. Lubricants are added to reduce the friction between the granules and wall during the compression and ejection of the tablets. Disintegrants can be used to facilitate the break-up of tablets after administration, while others, such as colorants and sweeteners, are added to improve the appearance and taste. However, some highly dosed excipients' Raman signals may mask the signals of low-dosed active compounds, such as the SERS detection of the low active pharmaceutical ingredient signal drugs.2 Owing to the complexity of the situation (low active ingredients, an extremely high amount of impurities, etc.), no single field fast device can effectively detect all excipient dominated medicines.4Therefore, in this case, the detection of these drugs is not only a great challenge to drug administration, but also a major scientific challenge linked to falsified and/or substandard medicines.4−7 Raman spectroscopy is experiencing a surge in interest for different domains in solid-state pharmaceutical applications and can be used for qualitative and quantitative analysis because of its fast, simple and non-destructive features. Recently, a growing number of applications of Raman spectroscopy for excipient characterization within the pharmaceutical industry have been observed.3,8–10 Its use has become widespread in drug quality detection with good reproducibility and ability to detect small concentrations of substances in mixtures of several components or to distinguish compounds similar in structure and having minimal differences in the spectrum. Quantitative information with limits of detection reported as low as 1–3% can be provided by vibrational spectra. The Raman spectra of mixtures are often very complex as they contain the spectrum of all ingredients present in the sample, including tablets, capsules, oral granules and analeptics. Thus, it is necessary to use chemometric techniques to extract qualitative or quantitative analysis information from the mixture spectra. The most important method to solve the problems of excipient dominated drug identification requires mixture analysis algorithms, such as, machine learning,11 non-negative least squares (NNLS),12 pattern recognition and so on.
With a part of the research on artificial neural networks, DL is the most focused research field at present. In DL, the features are learnt and predictive models are directly built from large-scale raw datasets.13,14 DL algorithms can deal with complex and nonlinear problems, which can transfer high dimensional abstract features to express original low-dimensional characteristics. These algorithms demonstrate excellent performance in several fields such as computer vision,15 bioinformatics,16 proteomics, chemistry, TCM diagnosis17 and so on.14 Earlier researchers have put forward DL based component identification for the Raman spectra of mixtures, which showed excellent sensitivity, particularly at low concentrations, and solves the component identification problem in the Raman spectra of low drug load. Moreover, non-negative least squares (NNLS), a practical method, can further refine search results and estimate the ratios of the compounds in the mixture, for example, a ternary mixture of methanol.12 The proposed method may be a promising solution to these candidates of excipients' which was better than the methods for identifying compounds from drug spectra, such as the correlation coefficient or the hit quality index (HQI).18 The query excipients (or APIs) and the reference LDDs can be calculated to identify the excipient or API compound. There will sometimes be mutual interference when calculating the correlation coefficient or HQI,19 because the analyzed spectrum originates from the Raman scattering of multiple compounds.
In the present study, we investigated the Raman spectra of nine LDDs and their APIs, with lactose as the most used excipient in pharmaceutical preparations. DL was chosen because of its high efficiency in excipient extraction and ability to reveal model relationships between drugs and excipients, while the NNLS can exploit useful information from drugs and provide the composition of LDDs. Subsequently, the spectra of the calculated corresponding proportion excipients were deducted from each drug to match its API spectrum. In this way, the LDDs can be determined as true, falsified, or substandard medicines for an on-site inspection. The results emphasized the potential of normal Raman spectroscopy as a fast screening analytical tool for identifying the LDD components.
2. Experimental
2.1 Sample collection
The drug samples were purchased from drugstores and hospitals in Shanghai, through repeated experimental study to screen the LDDs from different manufacturers, as described in Table S1 (ESI).† The excipient samples were purchased from Shanghai Zhongxi Pharmaceutical Co., Ltd., while the API standards were provided by the National Institute for the Control of Pharmaceutical and Biological Products, also summarized in Table S1.†2.2 Raman spectrometer
The spectrometer (HxSpec-Raman, with an excitation wavelength of 785 nm, INESA Co., Ltd) was used with fiber optic Raman accessories for measuring the spectra of liquids and powders. The spectral resolution was 6 cm−1 @890 nm, and the Raman shift was 160–2800 cm−1.2.3 Data collection
The integration times of the drugs' APIs and excipients differed from 2 s to 10 s, respectively, while the average time was 3–5 to improve the spectral quality and advance the signal-to-noise ratio (SNR). Six Raman spectra were collected for each drug during the experiment, unless stated otherwise. It is worth noting that the final spectrum of each drug was calculated as the average of spectra collected from a variety of positions (regardless of scraping off the tablet coating or not). Moreover, only the spectral region containing the most abundant information (i.e., 300–1800 cm−1) was utilized in the subsequent data analysis. The Raman spectra were standardized by pretreatment with background subtraction correction and interpolation. Prior to data analysis, the preprocessing of the datasets involves adaptive iteratively reweighted penalized least squares (airPLS),20 baseline correction and Savitzky–Golay smoothing (a 11-point wide window and a second-order polynomial). All processing tasks were implemented on a personal computer (win 10, Intel Core i5-8500, CPU: 1.53G, RAM: 4GB) with MATLAB R2014a.2.4 Data augmentation for each excipient and API
Data augmentation was applied to address the problem of a limited number of Raman spectra during model training, validation, and testing. Twenty thousand simulated excipients' and LDDs' spectra were generated for the training and validation of its convolutional neural network (CNN) model for each excipient and LDD. The numbers of positive spectra (containing certain excipients and APIs) and negative spectra (not containing the APIs) were up to 10![[thin space (1/6-em)]](https://www.rsc.org/images/entities/char_2009.gif) 000. For the positive spectra, the ratios of the LDDs were randomly generated in [0.1, 1.0], and the ratios of the other interference compounds were randomly generated in [0.0, 1.0]. The negative spectra were generated by the superposition of the other excipients at random ratios in the [0.0, 1.0] range.13
000. For the positive spectra, the ratios of the LDDs were randomly generated in [0.1, 1.0], and the ratios of the other interference compounds were randomly generated in [0.0, 1.0]. The negative spectra were generated by the superposition of the other excipients at random ratios in the [0.0, 1.0] range.13
2.5 Peak matching method
The feature of APIs in the LDD Raman spectrum is different from that in high API content drugs. Additionally, the feature of APIs has its special characteristics. The peak sets of the test LDD and its corresponding API are matched by the peak find methods (firstly, we selected 10 peaks from the API spectrum by the wavelet method, and then searched for the corresponding LDD's Raman peaks depending on the selected 10 API peaks. Finally, the match degree can be calculated by dividing the number of matched peaks by 10). The presence or absence of APIs in LDDs is determined based on the criterion of maximum matching degree.21–23 Meanwhile, the matching degree was used to evaluate the similarities between the drug peak and its API's peak sets.3. Results and discussion
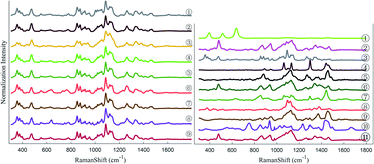
Raman spectroscopy is extremely productive in high-throughput implementation, and when it is linked to multiple chemometric methods, a series of calibration procedures can yield accurate quantitation (half-quantitation) of various properties of interest.24,25 The aim of the present study was to use Raman spectroscopy as a high-speed screening technique to acquire semi-quantitative information regarding the composition of each LDD with different excipients. The fingerprint region of the standard spectra of the used drugs is shown in Fig. 1 (left). The spectra were offset in the y-axis drugs for better visualization, which appeared very similar at the beginning.3.1 Clustering model obtained by using principal component analysis (PCA)
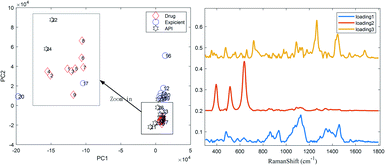
PCA26,27 was performed to classify the Raman spectra for several excipients without necessarily identifying all the LDDs.22 Prior to performing PCA,28 the spectra were subjected to several typical pre-processing steps, such as sloping baselines and mean centering. The spectra of the drug, excipients and APIs were run together in the PCA model and the variance described by each principal component was examined. The examination of the scores in the PC1 vs. PC2 plane showed that drugs and one excipient (lactose) with similar spectra are grouped together (Fig. 2) as they are the most similar samples in the two sets (i.e. lactose is their main ingredient), while dissimilar ones are spaced apart from one another.The examination of the loadings revealed that the API, and possibly lactose, HPMC and corn starch were among the major components present in the spectra. Lactose was readily observed in the spectra; however, HPMC was not observed, inferring that PCA was advantageous in uncovering possible spectral constituents, which were otherwise difficult to unambiguously assign from the original spectra. Moreover, another method was used as a further proof of the major components present in the drug spectra, called the hit-quality index (HQI), which is the spectral correlation method conventionally used for drug rapid screening to characterize their correlation with each other, and its values are summarized in Table S2.† A high correlation between the drugs and lactose is observed, as denoted by the light red tags. According to the judgement of fast screening regulars, a HQI of only more than 0.9 is permitted.18,29 For this case, the LDDs may be misjudged as falsified and/or substandard medicines. Therefore, to avoid this problem, a practical analysis method for drug composition was put forward.
3.2 Deep learning for excipient identification
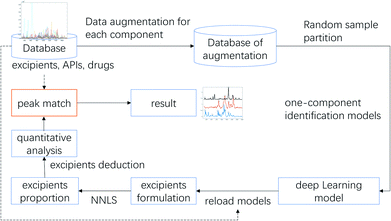
As reported, DL-based component identification (DeepCID) is a promising method for solving the component identification problem in the Raman spectra of mixtures, which showed excellent sensitivity, especially at low concentrations (as low as 4%) in the ternary mixture dataset. In this case, we can draw a lesson from DeepCID to try and explore the excipients' composition in LDDs, which can be seen in the flowchart for DeepCID and the flow chart of the LDD quantitative model (Fig. 3).The drug samples can be used as mixture compounds to investigate the sensitivity of DeepCID. The results (Table S3†) showed that nine drug samples can be identified by DeepCID, and the composition of each drug was acquired. Of all nine drugs investigated, lactose was discovered with a high content (this is also the reason why they are called LDDs), while other excipients were randomly found in these drugs. In addition, in deep learning, parameters are often initialized randomly, and random dropouts are presented too, which result in some randomness. Thus, to verify the stability of DeepCID for component identification, we selected the models of Glimepiride tablets and huperzine A tablets to perform multiple trainings. Two hundred trainings were performed for both the compounds. The prediction accuracy of the 5000 samples of the test dataset was used to evaluate the model stability. The histograms of accuracy (92.4% for Glimepiride tablets and 93% for huperzine A tablets) are illustrated in Fig. 4, which show that DeepCID has great stability (like Gaussian distributions with small variance). Therefore, using DeepCID, one can acquire the LDD compositions. However, the DeepCID method alone is not omnipotent for quantitative analysis to investigate drugs' components; however, when combined with the NNLS method, it can become a powerful solution to counteract the research problem mentioned before.12,13,30,31
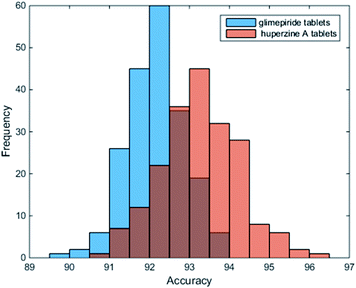 | ||
| Fig. 4 Stability and reproducibility of DeepCID. Two hundred trainings were performed for the models of Glimepiride tablets and huperzine A tablets. | ||
3.3 NNLS for excipient quantitation in drugs' formulations
The portable Raman spectrometer proposed in this study can provide adequate spectral resolution for drug identification in situ. Raman spectra are information rich but not easy to interpret, especially for the spectra suffering from the auto-fluorescence phenomenon and the signal of highly dosed pharmaceutical excipients may mask the signal of low-dosed APIs, especially the API with a weaker Raman response. The ability to identify components in a mixture is, therefore, of considerable interest and challenge before further quantitative analysis of LDDs. In this case, NNLS was presented and modified according to the features of the pharmaceutical Raman spectrum based on automatic peak detection in the wavelet spaces. The match quality can be calculated by determining the negative ratio in the subtractive spectrum between the drugs and excipients (scaled by the minimal ratio of the reversely matched peaks). The identification result can be further refined by non-negative least squares, and it can also calculate the ratio of each component accurately. From Table S3† (value in brackets), one can see that the employment of non-negative least squares can further refine search results and estimate the ratios of each excipient used in drugs. Again, lactose was discovered with a high content (>76%) of all nine drugs investigated. It is thus clear that, when DL is used in combination with NNLS, the composition of drugs can be efficiently investigated; therefore, quantitative analysis will be successfully achieved. According to the excipient's quantitation of LDDs, one can determine the presence or absence of APIs in a drug using the peak matching solution.3.4 Matching the position of API's characteristic peaks
Because of their strong Raman spectra, APIs can take advantage of Raman spectroscopy whereas numerous excipients exhibit Raman spectra with broad features and a high fluorescence background. However, in this study, the spectra of LDDs' and lactose's were overlapped, as the signal of highly dosed excipients masked the signal of low-dosed active compounds. The influence to the LDDs was deducted by DL with the NNLS method, and the corresponding proportion was modified by removing the excipients' signals. Then the pure drug signals and their API's were matched to each other. In this case, the presence or absence of APIs in LDDs is determined according to the evaluated similarities between the drug peak sets and its API's. For example, in the case of the Glimepiride tablet and huperzine A tablet, which can be seen in Fig. 5, the API main characteristic peaks' positions appear more clearly for the LDDs after deducting relevant excipients and the matching degree was more than 0.5 (marked with triangles), while not deducting excipients will lead to a worse matching degree for the LDDs. From the above discussion, we can draw a conclusion that the API signals are probably hidden in LDDs' spectra, when conducting rapid drug screening by Raman spectroscopy, and DL with NNLS may be an appropriate and efficient way to eliminate the influence of excipients in LDDs.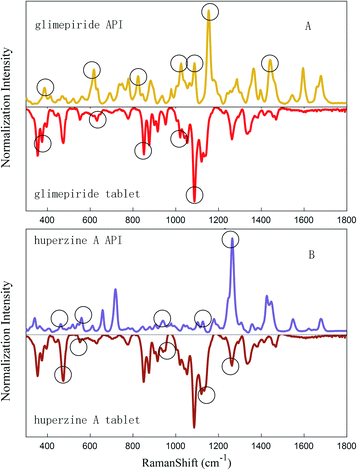 | ||
| Fig. 5 API's characteristic peaks match the Glimepiride tablet (A) and huperzine A tablet's spectrum (B). | ||
4. Conclusions
In this study, DL models were developed for Raman spectra based on DL techniques, which can effectively identify the components from LDDs. Selecting the most effective screening tools for these drugs requires the consideration of several practical, technical, and scientific factors, such as the type of drug screened, the requirements of the screening technology, and the type of information needed, or even the excipients' database and so on. Raman spectroscopy was found to be a cost effective, rapid, and user-friendly method, which if combined with DL and NNLS leads to fast implantation in the identification of lactose dominated drug formulations. Using PCA and the correlation coefficient or HQI, we were unable to distinguish LDDs from excipients. But, DL combined with NNLS was found to be exceptionally efficient for the quantitative analysis of LDDs. Therefore, DL can be easily implemented with Python (available as an open source package at https://github.com/xiaqiong/DeepCID), which may be well-suited to solving the components of LDDs based on Raman spectra.Conflicts of interest
There are no conflicts to declare.Acknowledgements
This work was financially supported by the Ministry of Science and Technology of the People's Republic of China (2017YFF0210103). The studies meet with the approval of the university's and hospital's review board. We would like to thank Dr Fan Xia-qiong (CSU) for her expertise and feedback on various sections of the manuscript. We are grateful to all employees of this institute for their encouragement and support for this research.References
- M. De Veij, P. Vandenabeele, T. De Beer, J. P. Remon and L. Moens, J. Raman Spectrosc., 2009, 40, 297–307 CrossRef CAS.
- X. Li, H. Chen, Q. Zhu, Y. Liu and F. Lu, J. Pharm. Biomed. Anal., 2016, 131, 410–419 CrossRef CAS.
- J. A. Griffen, A. W. Owen, J. Burley, V. Taresco and P. Matousek, J. Pharm. Biomed. Anal., 2016, 128, 35–45 CrossRef CAS.
- R. Martino, M. Malet-Martino, V. Gilard and S. Balayssac, Anal. Bioanal. Chem., 2010, 398, 77–92 CrossRef CAS.
- H. Rebiere, P. Guinot, D. Chauvey and C. Brenier, J. Pharm. Biomed. Anal., 2017, 142, 286–306 CrossRef CAS.
- Lukas Roth, Kevin B. Biggs and Daniel K. Bempong, Journal of the American Association of Pharmaceutical Scientists, 2019, 5, 2–12 Search PubMed.
- B. Sarri, R. Canonge, X. Audier, V. Lavastre, G. Pénarier, J. Alie and H. Rigneault, J. Raman Spectrosc., 2019, 50, 1896–1904 CrossRef CAS.
- C. Assmann, J. Kirchhoff, C. Beleites, J. Hey, S. Kostudis, W. Pfister, P. Schlattmann, J. Popp and U. Neugebauer, Anal. Bioanal. Chem., 2015, 407, 8343–8352 CrossRef CAS.
- M. de Veij, A. Deneckere, P. Vandenabeele, D. de Kaste and L. Moens, J. Pharm. Biomed. Anal., 2008, 46, 303–309 CrossRef CAS.
- K. A. Esmonde-White, M. Cuellar, C. Uerpmann, B. Lenain and I. R. Lewis, Anal. Bioanal. Chem., 2017, 409, 637–649 CrossRef CAS.
- J. Liu, M. Osadchy, L. Ashton, M. Foster, C. J. Solomon and S. J. Gibson, Analyst, 2017, 142, 4067–4074 RSC.
- Z.-M. Zhang, X.-Q. Chen, H.-M. Lu, Y.-Z. Liang, W. Fan, D. Xu, J. Zhou, F. Ye and Z.-Y. Yang, Chemom. Intell. Lab. Syst., 2014, 137, 10–20 CrossRef CAS.
- X. Fan, W. Ming, H. Zeng, Z. Zhang and H. Lu, Analyst, 2019, 144, 1789–1798 RSC.
- G.-P. Liu, J.-J. Yan, Y.-Q. Wang, W. Zheng, T. Zhong, X. Lu and P. Qian, Comput. Math. Methods Med., 2014, 2014, 1–8 Search PubMed.
- G. B. Goh, N. O. Hodas and A. Vishnu, J. Comput. Chem., 2017, 38, 1291–1307 CrossRef CAS.
- S. Min, B. Lee and S. Yoon, Briefings Bioinf., 2017, 18, 851–869 Search PubMed.
- J.-C. Weng, M.-C. Hu and K.-C. Lan, ACM, 2017, pp. 233–234 Search PubMed.
- Y. L. Loethen, J. F. Kauffman, L. F. Buhse and J. D. Rodriguez, Analyst, 2015, 140, 7225–7233 RSC.
- H. Chen, Z. M. Zhang, L. Miao, D. J. Zhan, Y. B. Zheng, Y. Liu, F. Lu and Y. Z. Liang, J. Raman Spectrosc., 2015, 46, 147–154 CrossRef CAS.
- Z.-M. Zhang, S. Chen and Y.-Z. Liang, Analyst, 2010, 135, 1138–1146 RSC.
- S. A. Dyer and D. S. Hardin, Appl. Spectrosc., 1985, 39, 655–662 CrossRef CAS.
- C. Carey, T. Boucher, S. Mahadevan, P. Bartholomew and M. Dyar, J. Raman Spectrosc., 2015, 46, 894–903 CrossRef CAS.
- L. S. Lawson and J. D. Rodriguez, Anal. Chem., 2016, 88, 4706–4713 CrossRef CAS.
- M. Haag, M. Brüning and K. Molt, Anal. Bioanal. Chem., 2009, 395, 1777 CrossRef CAS.
- S. Duraipandian, J. C. Petersen and M. Lassen, Appl. Sci., 2019, 9, 2433 CrossRef CAS.
- A. G. Ryder, J. Forensic Sci., 2002, 47, 275–284 CAS.
- Y. H. Ong, M. Lim and Q. Liu, Opt. Express, 2012, 20, 22158–22171 CrossRef CAS.
- Q. Bao, H. Zhao and S. Han, et al. , Anal. Methods, 2020, 12, 3025–3031 RSC.
- F. Lu, X. Weng, Y. Chai, Y. Yang, Y. Yu and G. Duan, Chemom. Intell. Lab. Syst., 2013, 127, 63–69 CrossRef CAS.
- L. Zhang, Y. Wu, B. Zheng, L. Su, Y. Chen, S. Ma, Q. Hu, X. Zou, L. Yao and Y. Yang, Theranostics, 2019, 9, 2541 CrossRef CAS.
- C. Zou, H. Zhu, J. Shen, H. Yue, J. Su, X. Fan, H. Lu, Z. Zhang and Y. Chen, Anal. Methods, 2019, 11, 4481–4493 RSC.
Footnote |
| † Electronic supplementary information (ESI) available. See DOI: 10.1039/d0ay01874k |
| This journal is © The Royal Society of Chemistry 2021 |

