Molecular layer deposition of Li-ion conducting “Lithicone” solid electrolytes†
Eric
Kazyak‡
 a,
Minjeong
Shin‡
a,
William S.
LePage
a,
Tae H.
Cho
a and
Neil P.
Dasgupta
a,
Minjeong
Shin‡
a,
William S.
LePage
a,
Tae H.
Cho
a and
Neil P.
Dasgupta
 *ab
*ab
aDepartment of Mechanical Engineering, University of Michigan, Ann Arbor, MI 48109, USA. E-mail: ndasgupt@umich.edu
bDepartment of Materials Science & Engineering, University of Michigan, Ann Arbor, MI 48109, USA
First published on 8th December 2020
Abstract
We demonstrate the fabrication of Li-containing (“lithicone”) thin films prepared via molecular layer deposition (MLD) using lithium tert-butoxide and ethylene glycol. X-ray photoelectron spectroscopy reveals that the stoichiometry of the lithicone is Li1.5C2O1.8 (H omitted), with C–O–Li moieties present in the film. The bonding environment of lithicone is distinct from that of lithium carbonate or MLD alucone films. Electrochemical impedance spectroscopy measurements show that annealed lithicone films exhibit room temperature ionic conductivity of 3.6–5 × 10⁻⁸ S cm−1 with an activation energy of ∼0.6 eV. The lithicone MLD process provides a pathway to further develop hybrid inorganic–organic Li-ion conducting materials for future battery applications.
Atomic layer deposition (ALD), and its organic analog molecular layer deposition (MLD), are gas-phase thin film deposition techniques that have been broadly applied in lithium battery applications.1,2 This includes interfacial coatings for anodes and cathodes, deposition of electrodes and solid electrolytes, and fabrication of thin-film/three-dimensional batteries.3–6 ALD/MLD are based on self-limiting surface reactions where gaseous precursors are sequentially exposed to the substrate to grow a film in a layer-by-layer manner.1,2 The unique capability of ALD/MLD to conformally coat non-planar geometries with precise control of thickness and composition enables the formation of passivation layers that can prevent electrode materials from degradation at low/high electrochemical potentials, while facilitating the flux of ions across interfaces.3–8
Among the various ALD/MLD films developed for battery applications, Li-ion conducting films are receiving great interest due to their potential to be directly adopted as solid electrolytes or interlayer materials that allow ion transport through the film without significantly increasing cell impedance.9 In the past decade, significant advancements have been made in developing Li-ion conducting ALD materials.10–20 Several Li-ion conducting ALD films such as LixAlyO, LixAlyS, LiTaxOy, LiPON, Li7La3Zr2O12, and Li3BO3–Li2CO3 have been reported with ionic conductivities ranging 10−10–10−6 S cm−1.10–20 Despite great achievements in fabricating ALD thin films for Li-based batteries, research efforts to develop Li-conducting films prepared via MLD have been limited.
MLD is an organic equivalent to ALD where organic precursors are employed as oxidizers. Similar to ALD, MLD is characterized by sequential and self-limiting surface reactions that result in a conformal and uniform coating of polymeric or inorganic–organic hybrid thin films (“metalcones”).2 MLD films have been explored for battery applications where increased mechanical ductility of the coating is desirable, such as surface coatings for high volume expansion electrode materials (e.g. Si anodes) or as an interlayer in solid-state batteries.4,5,21–23
In liquid electrolyte systems, Piper et al. investigated the MLD coating of alucone (deposited using trimethylaluminum and glycerol precursors) as a buffer layer for Si anodes.22 Si nanoparticles coated with alucone exhibit superior cycling stability relative to bare Si nanoparticles, which is attributed to the formation of a stable passivation layer that is able to accommodate large volume changes of the active material.22 In another work, Sun and co-workers demonstrated the use of dual protective layer of ALD Al2O3 as the inner layer and MLD alucone as the outer layer to stabilize the Li metal anode, showing enhanced cycling stability and suppressed growth of mossy Li.21 In solid-state batteries, alucone was shown to be more effective than ALD Al2O3 as an interlayer between Li metal and Li10SnP2S12 solid electrolyte, which was attributed to the improved mechanical properties of the MLD film.23
Despite these demonstrations of MLD interlayers in battery applications, alucone films do not contain lithium as-deposited, and instead, rely on chemical and/or electrochemical lithiation of the films during cycling. This leads to a general lack of control over the ionic conductivity of the films, which is also difficult to measure, and may evolve during extended cycling. Therefore, there is a need to develop Li-containing MLD films that act as solid electrolytes with high ionic conductivity, which could be used in a wide range of battery applications. However, there are only a few Li-containing MLD films reported to date, and no reported measurements of the ionic conductivity values of MLD films.24–27
In this work, MLD was used to deposit Li-containing organic thin films that we refer to as “lithicone”, in analogy with other metalcone films.2 Lithium tert-butoxide (LiOtBu) was used as the lithium precursor and ethylene glycol (EG) was used as the organic linker. This specific combination of precursors has not been previously reported. Spectroscopic ellipsometry, in situ quartz crystal microbalance (QCM), and atomic force microscopy (AFM) measurements were performed to study the MLD growth characteristics. The lithicone film composition and chemical environment was characterized using X-ray photoelectron spectroscopy (XPS). The room temperature Li-ion conductivity of the annealed lithicone film is 3.6–5 × 10⁻⁸ S cm−1, measured by electrochemical impedance spectroscopy (EIS), which illustrates the potential of these films as solid electrolyte layers.
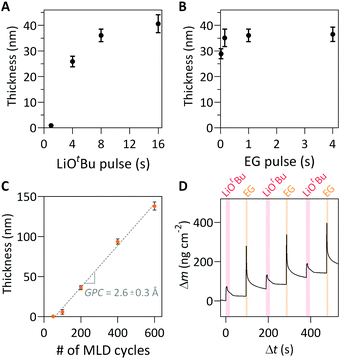
For the choice of lithium precursor, LiOtBu was selected because it has been successfully demonstrated in other Li-containing ALD films, owing to a sufficiently high vapor pressure and demonstration of self-limiting surface reactions.10,12–18 EG was used as the organic precursor, owing to its high vapor pressure and thermal stability within the deposition temperature window.2,28 A saturation study of the lithicone MLD process was performed by varying precursor pulse length of both the LiOtBu and EG precursors (Fig. 1a, b and Fig. S1, ESI†). The thicknesses of the lithicone films after 200 MLD cycles were measured by spectroscopic ellipsometry. As shown in Fig. 1a and b, the film thickness increases with increasing precursor exposure time before reaching a plateau, which indicates the self-limiting nature of this MLD process. Pulse saturation time was determined to be 8 s for LiOtBu and 0.15 s for EG.
The measured thicknesses of the films as a function of MLD cycle number is shown in Fig. 1c. The film thickness increases linearly with increasing cycle number, corresponding to the growth-per-cycle (GPC) of 2.6 Å cycle−1. We note that the linear regression line does not pass through origin, suggesting the presence of initial nucleation delay in the initial cycles on a Si substrate. A similar growth profile with a nucleation delay was reported in a previous MLD study using LiOtBu and 1,3-propanediol.26 We performed AFM measurements to further study the initial film nucleation, which will be discussed below.
In situ QCM studies were performed to monitor the mass uptake during film growth. Fig. S2 (ESI†) shows that the mass uptake increases linearly, which is in good agreement with the trend shown in Fig. 1c. Fig. 1d shows a magnified view of 3 representative cycles from a longer deposition. As shown, the LiOtBu pulse results in an initial mass gain followed by a gradual decrease. A similar trend is observed after the EG exposure. The slight decrease in mass during purging is attributed to the initial adsorption/absorption of precursor onto the surface and into the bulk, followed by desorption.28,29
The saturation-limited growth characteristics were further investigated by depositing the film on a Si trenches (Fig. S3, ESI†). The SEM images show conformal deposition of the lithicone film on Si microstructures, demonstrating the non-line-of-sight deposition characteristics of the MLD process.
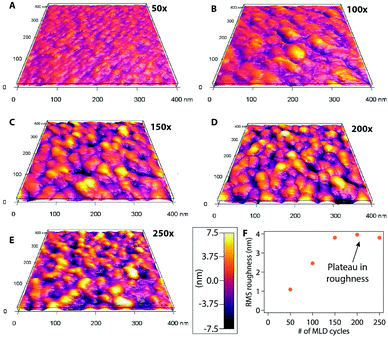
We performed AFM analysis to study the morphology and growth characteristics of lithicone as a function of cycle number. As shown in Fig. 2, the surface morphology of the film evolves with cycle number, along with the RMS roughness. During the initial deposition cycles, the film morphology consists of small grains, which grow vertically and laterally with increasing cycle number. This evolution corresponds well with the increase of RMS roughness between cycles 50–150. This is consistent with the nucleation delay observed in ellipsometry measurement shown in Fig. 1c. After 150 cycles, the film morphology remains relatively unchanged, and the RMS roughness value reaches a plateau. This result implies that once the initial nucleation stage is complete, the film grows in a layer-by-layer manner.
 | ||
| Fig. 2 AFM images of lithicone films at (a) 50, (b) 100, (c) 150, (d) 200, (e) 250 deposition cycles. (f) RMS roughness as a function of MLD cycle number is shown. | ||
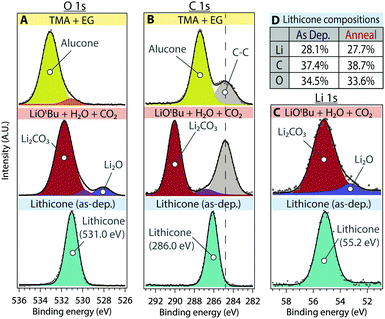
XPS was performed to determine the composition and chemical environment of the lithicone film (Fig. 3). Fig. 3 shows XPS O 1s, C 1s, and Li 1s core scans of the lithicone film deposited at 135 °C. For reference, XPS spectra of alucone (MLD of TMA + EG) and lithium carbonate (ALD of LiOtBu + H2O + CO2) are also shown in the first and second rows of Fig. 3, respectively. Curve fitting of the XPS spectra was performed to deconvolute each species. Peak assignments are based on previous values reported in the literature along with known standard samples.26,28,30–32
As shown in Fig. 3d, the prepared lithicone film contains ∼28 atomic % of lithium, demonstrating successful incorporation of lithium into the MLD film. The stoichiometry of the as-deposited lithicone film was calculated to be Li1.5C2O1.8 (hydrogen content not included).
As shown in Fig. 3, the XPS spectra of alucone can be fit with a primary peak corresponding to C–O bonding – 533.1 eV for the O 1s peak and 287.4 eV for C 1s peak (yellow). The lithicone film exhibits a distinct chemical environment from that of alucone, showing predominant peaks at 531.0 eV for O 1s, 286.0 eV for C 1s, and 55.2 eV for Li 1s (light blue), associated with C–O–Li moieties (Fig. 3). The binding energy of the primary peak in lithicone is significantly lower than that of alucone, for both the O 1s and C 1s peaks. This is the consequence of Li association with C–O bonds, forming C–O–Li bonding environments in lithicone.
Next, we examine the ionic conductivity of lithicone to evaluate the possibility of using lithicone in Li battery applications. The ionic conductivity was measured by depositing the film onto interdigitated Pt electrodes (Fig. S4, ESI†), as reported previously.13,17,18 This electrode geometry enables characterization of the ionic and electronic conduction properties of thin films without the need to further deposit blocking electrodes on top of the film after the ALD/MLD process. Electrochemical impedance spectroscopy (EIS) was conducted on a lithicone film deposited on Pt electrode. The ionic conductivity of the as-deposited lithicone was unmeasurable. After post-deposition annealing at 350 °C, the film exhibits an irreversible increase in ionic conductivity upon heating and subsequent cooling back to 30 °C. This is similar to the behavior observed for ALD of Li3BO3–Li2CO3, where the increase in ionic conductivity is attributed to structural changes in the film.18 The impact of annealing temperature on ionic conductivity and transference number is shown in Fig. S5 (ESI†).
We performed XPS analysis on the lithicone film after annealing, and observed subtle changes to the core spectra (Fig. S6, ESI†), and negligible changes to the overall composition. X-ray diffraction (XRD) analysis show that the lithicone film remains amorphous after annealing, suggesting no phase transition upon annealing (Fig. S7, ESI†). Fourier-transform infrared spectroscopy (FTIR) spectra of the as-deposited and annealed film show that the chemical bonding of the film remains unchanged with annealing, consistent with the XPS analysis (Fig. S8, ESI†). A full mechanistic understanding of conductivity increase with annealing will be the subject of future studies.
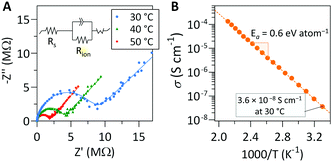
Representative Nyquist plots of films after post-deposition annealing were collected at several temperatures are shown in Fig. 4a. The Nyquist plots were fit with the equivalent circuit shown in the inset of Fig. 4a to quantify the resistance of each cell component. The linear relationship of the ln(σT) vs. T−1 data allows for determination of the activation energy, as shown in Fig. 4b.
Our measurement shows that the annealed lithicone film deposited at 175 °C exhibits an ionic conductivity of 3.6 × 10⁻⁸ S cm−1 at 30 °C with activation energy of 0.6 eV. The lithicone film deposited at 135 °C shows similar ionic conductivity trend, with a value of 5 × 10⁻⁸ S cm−1 at 30 °C (Fig. S9, ESI†). To the best of our knowledge, this is the first reported Li-ion conductivity of an MLD film. The ionic conductivity and activation energy value are comparable to several Li-ion conducting thin films prepared by ALD such as LiAlO2, LiPON, LixAlyS, LiAlF4, and LiNbxOy.11,13–16 Although the film exhibits relatively low ionic conductivity compared to bulk solid electrolytes, the additional ohmic resistance introduced by a nanoscale thin film lithicone would be minimal. For example, a 10 nm thick lithicone film corresponds to an area specific resistance of ∼28 Ω cm2, which is lower than the interfacial impedance of many solid-state battery systems.
To confirm that the origin of conductivity is predominantly ionic, the electronic conductivity of the lithicone film was measured by chronoamperometry, and the corresponding Arrhenius plot is shown in Fig. S10 (ESI†). The measured electronic conductivity of the film is 5 to 6 orders-of-magnitude lower than the ionic conductivity, exhibiting an ionic transference number greater than 99.999%. Therefore, these films have the potential for use as either an interlayer or a bulk solid electrolyte in thin film batteries.
In summary, we have successfully deposited Li-containing organic thin films through a MLD process using LiOtBu and EG as precursors. The self-limiting surface reactions and film growth profiles were confirmed using spectroscopic ellipsometry and by monitoring mass gain by in situ QCM. We demonstrate that the lithicone film grows in a layer-by-layer manner showing surface saturation and linear increase in film thickness. The growth rate of film was 2.6 Å cycle−1 at a deposition temperature of 135 °C. XPS revealed the composition and chemical structure of the deposited lithicone film, with a bonding environment that is distinct from lithium carbonate or alucone. The films exhibit an ionic conductivity of 3.6 × 10⁻⁸ S cm−1 at 30 °C with an activation energy of 0.6 eV. This is the first quantified measurement of Li-ion conductivity in an MLD thin film to-date. This study will serve as a springboard to develop advanced organic/inorganic hybrid thin films for use in future battery applications. Further studies will focus on developing other Li-containing MLD processes using other precursors of varying functionalities and compositions.
This work was supported by Nissan Motor Co., Ltd., Japan. The authors thank Mr Koichiro Aotani and Mr Toshikazu Kotaka for valuable discussions.
Conflicts of interest
There are no conflicts to declare.Notes and references
- S. M. George, Chem. Rev., 2010, 110, 111–131 CrossRef CAS.
- S. M. George, A. A. Dameron and B. Yoon, Acc. Chem. Res., 2009, 42, 498–508 CrossRef CAS.
- X. Meng, X. Q. Yang and X. Sun, Adv. Mater., 2012, 24, 3589–3615 CrossRef CAS.
- C. Ban and S. M. George, Adv. Mater. Interfaces, 2016, 3, 1600762 CrossRef.
- Y. Zhao and X. Sun, ACS Energy Lett., 2018, 3, 899–914 CrossRef CAS.
- X. Wang and G. Yushin, Energy Environ. Sci., 2015, 8, 1889–1904 RSC.
- L. Ma, R. B. Nuwayhid, T. Wu, Y. Lei, K. Amine and J. Lu, Adv. Mater. Interfaces, 2016, 3, 1600564 CrossRef.
- A. L. Davis, R. Garcia-Mendez, K. N. Wood, E. Kazyak, K.-H. Chen, G. Teeter, J. Sakamoto and N. P. Dasgupta, J. Mater. Chem. A, 2020, 12, 6291–6302 RSC.
- X. Meng, Energy Storage Mater., 2020, 30, 296–328 CrossRef.
- J. Liu, M. N. Banis, X. Li, A. Lushington, M. Cai, R. Li, T. K. Sham and X. Sun, J. Phys. Chem. C, 2013, 117, 20260–20267 CrossRef CAS.
- M. Nisula, Y. Shindo, H. Koga and M. Karppinen, Chem. Mater., 2015, 27, 6987–6993 CrossRef CAS.
- A. C. Kozen, A. J. Pearse, C. F. Lin, M. Noked and G. W. Rubloff, Chem. Mater., 2015, 27, 5324–5331 CrossRef CAS.
- Y. Cao, X. Meng and J. W. Elam, ChemElectroChem, 2016, 3, 858–863 CrossRef CAS.
- J. Xie, A. D. Sendek, E. D. Cubuk, X. Zhang, Z. Lu, Y. Gong, T. Wu, F. Shi, W. Liu, E. J. Reed and Y. Cui, ACS Nano, 2017, 11, 7019–7027 CrossRef CAS.
- B. Wang, Y. Zhao, M. N. Banis, Q. Sun, K. R. Adair, R. Li, T. K. Sham and X. Sun, ACS Appl. Mater. Interfaces, 2018, 10, 1654–1661 CrossRef CAS.
- J. S. Park, X. Meng, J. W. Elam, S. Hao, C. Wolverton, C. Kim and J. Cabana, Chem. Mater., 2014, 26, 3128–3134 CrossRef CAS.
- E. Kazyak, K. H. Chen, K. N. Wood, A. L. Davis, T. Thompson, A. R. Bielinski, A. J. Sanchez, X. Wang, C. Wang, J. Sakamoto and N. P. Dasgupta, Chem. Mater., 2017, 29, 3785–3792 CrossRef CAS.
- E. Kazyak, K. H. Chen, A. L. Davis, S. Yu, A. J. Sanchez, J. Lasso, A. R. Bielinski, T. Thompson, J. Sakamoto, D. J. Siegel and N. P. Dasgupta, J. Mater. Chem. A, 2018, 6, 19425–19437 RSC.
- Y. Hu, A. Ruud, V. Miikkulainen, T. Norby, O. Nilsen and H. Fjellvåg, RSC Adv., 2016, 6, 60479–60486 RSC.
- M. Putkonen, T. Aaltonen, M. Alnes, T. Sajavaara, O. Nilsen and H. Fjellvåg, J. Mater. Chem., 2009, 19, 8767–8771 RSC.
- Y. Zhao, M. Amirmaleki, Q. Sun, C. Zhao, A. Codirenzi, L. V. Goncharova, C. Wang, K. Adair, X. Li, X. Yang, F. Zhao, R. Li, T. Filleter, M. Cai and X. Sun, Matter, 2019, 1, 1215–1231 CrossRef.
- D. M. Piper, J. J. Travis, M. Young, S. B. Son, S. C. Kim, K. H. Oh, S. M. George, C. Ban and S. H. Lee, Adv. Mater., 2014, 26, 1596–1601 CrossRef CAS.
- C. Wang, Y. Zhao, Q. Sun, X. Li, Y. Liu, J. Liang, X. Li, X. Lin, R. Li, K. R. Adair, L. Zhang, R. Yang, S. Lu and X. Sun, Nano Energy, 2018, 53, 168–174 CrossRef CAS.
- M. Nisula and M. Karppinen, Nano Lett., 2016, 16, 1276–1281 CrossRef CAS.
- M. Nisula, J. Linnera, A. J. Karttunen and M. Karppinen, Chem. – Eur. J., 2017, 23, 2988–2992 CrossRef CAS.
- H. Wang, K. E. Gregorczyk, S. B. Lee, G. W. Rubloff and C. Lin, J. Phys. Chem. C, 2020, 124, 6830–6837 CrossRef CAS.
- J. Heiska, M. Madadi and M. Karppinen, Nanoscale Adv., 2020, 2, 2441–2447 RSC.
- A. A. Dameron, D. Seghete, B. B. Burton, S. D. Davidson, A. S. Cavanagh, J. A. Bertrand and S. M. George, Chem. Mater., 2008, 20, 3315–3326 CrossRef CAS.
- C. A. Wilson, R. K. Grubbs and S. M. George, Chem. Mater., 2005, 17, 5625–5634 CrossRef CAS.
- I. Ismail, A. Noda, A. Nishimoto and M. Watanabe, Electrochim. Acta, 2001, 46, 1595–1603 CrossRef CAS.
- K. N. Wood and G. Teeter, ACS Appl. Energy Mater., 2018, 1, 4493–4504 CrossRef CAS.
- S. Jiao, X. Ren, R. Cao, M. H. Engelhard, Y. Liu, D. Hu, D. Mei, J. Zheng, W. Zhao, Q. Li, N. Liu, B. D. Adams, C. Ma, J. Liu, J. G. Zhang and W. Xu, Nat. Energy, 2018, 3, 739–746 CrossRef CAS.
Footnotes |
| † Electronic supplementary information (ESI) available. See DOI: 10.1039/d0cc06077a |
| ‡ These authors contributed equally to this work. |
| This journal is © The Royal Society of Chemistry 2020 |


