The effect of electrode design parameters on battery performance and optimization of electrode thickness based on the electrochemical–thermal coupling model
Received
16th October 2018
, Accepted 10th November 2018
First published on 12th November 2018
Abstract
Electrodes are the most important components in the lithium-ion battery, and their design, which ultimately determines the quantity and speed of lithium storage, directly affects the capacity, power density, and energy density of the battery. Herein, an electrochemical–thermal coupling model was established for an 18.5 A h lithium-ion battery, and the model was validated by experiment at four discharge rates. Based on this model, the effects of the electrode design parameters (electrode thickness, volume fraction of active material and particle size) on the battery performance (electrochemical characteristics, thermal behavior, energy density and power density) were initially investigated. It was found that as the electrode thickness and volume fraction of the active material increased, the polarization, heat generation rate and energy density increased, while the power density degraded. In addition, as the particle size decreased, both the energy density and power density improved, which can provide guidance for the design of electrodes. Subsequently, a multi-parameter (thickness of the positive and negative electrodes) and multi-objective (energy density and power density) optimization procedure was performed via two optimization methods, and the positive electrode thickness of 55.335 μm and negative electrode thickness of 63.188 μm were determined to be the optimized parameters.
1. Introduction
Lithium-ion batteries are widely used in various portable electronic products due to their high working voltage, high energy density, and no memory effect.1–3 In recent years, their application has expanded in various fields such as electric bicycles, electric vehicles, and hybrid vehicles.4,5 Nowadays, the pursuit of high energy density and power density in lithium-ion batteries has become the focus of research.6 For example, for an electric vehicle, the energy density determines the single maximum mileage, and the power density determines the maximum travel speed. We expect that electric vehicles can both “run fast” and “run far”. However, as is known, there exists a trade-off between energy density and power density. In general, the higher the energy density, the lower would be the power density. Therefore, ensuring a high energy density and power density simultaneously has become increasingly challenging.4
As the most important component of a battery, the electrodes (including the positive electrode and negative electrode) of a lithium-ion battery ultimately determine the quantity and speed of lithium storage, directly affect the capacity, power density, and energy density of the battery.7,8 We summarized two categories for electrode design optimization: (i) selecting appropriate materials,9 such as changing the ratio of active materials to inactive materials10 or using mixed cathode materials11 and (ii) optimizing the battery design parameters, such as the particle size,12,13 electrode thickness,8,14–16 volume fraction of the active materials, porosity16 and other factors.8 Recent years have witnessed many studies focused on the effect of the electrode design parameters on the battery performance or the optimization of these parameters to obtain the maximum battery performance. Newman16 optimized the porosity and thickness of a battery electrode by using a reaction-zone model and analytical method, and found that the most significant factor influencing the design of a battery is its discharge time. It has also been shown that longer discharge times permit thicker electrodes and smaller pores allow for higher capacity. Lu et al.12 sieved LiMn2O4 powder with different particle sizes to examine the influence of particle size on the electrochemical behavior. They concluded that with a decrease in particle size, both the specific capacity and the coulombic efficiency significantly increased. Zhao et al.14 reported a 1D electrochemical model and 3D thermal model to investigate the effects of electrode thickness on the electrochemical and thermal characteristics of the lithium-ion battery. They found that though thicker electrodes can increase the energy density, they also cause more intensive and uneven temperature responses and uneven electrochemical reactions and higher internal resistance. Zheng et al.15 selected two types of batteries with LiNi1/3Co1/3Mn1/3O2 (NCM) and LiFePO4 (LFP) cathodes, where the former offered high energy and power density, while the latter possessed good safety attributes and long cycle life. The effects of electrode thickness on the rate capability for the two electrodes were examined, and the results indicated that the thicker electrode provides a higher energy density but at the expense of power density and deterioration of rate capability. Kisu et al.8 combined experimental and simulated methods to optimize the electrode density and thickness of lithium-ion batteries via an internal resistance map, a visualization tool for minimizing electrode resistance. Finally they predicted that the NCM electrode attains minimum resistance per unit area at a thickness of 70 μm and density 2.9 g cm−3.
However, there were many deficiencies in previous studies. First, most of the researches related to the influence of electrode design parameters on battery energy density and power density are based on experimental methods. Compared with experimental methods, simulated methods not only observe the external characteristics, but also predict the internal electrochemical and thermal properties intuitively. Moreover, they can save both time and money via simulation. Second,17 majority of the studies only investigated the effects of a single electrode design parameter, such as the electrode thickness14 and particle size,12 on the performance, energy density and power density of lithium-ion batteries, and only a few studies combined multiple electrode design parameters for analysis. Next, many optimization studies were merely for parametric sweep; thus, the final iterative optimization parameters cannot be obtained. Finally, many reports are focused on a single objective optimization, such as energy density, power density and specific capacity, and multi-objective function optimization has rarely been studied.
In this study, a commercial 18.5 A h NCM lithium-ion pouch cell was selected as the research target. An electrochemical–thermal coupling model was established based on the COMSOL Multiphysics simulation platform, and this model was validated via experimental methods. Subsequently, three electrode design parameters, namely, electrode thickness, volume fraction of the active materials and particle size, were increased and decreased to investigate their effects on the electrochemical performance and thermal behavior as well as the energy density and power density. Finally, the positive and negative electrode thickness were optimized in two ways: (i) by maximizing the energy density and (ii) by maximizing the product of energy density and power density. Two types of optimization methods were adopted to improve the accuracy of the optimization and obtain a more appropriate parameter.
2. Model description and validation
2.1 Model development
The working process of lithium-ion batteries generally involves the internal electrochemical reaction and heat generation processes. Therefore, the development of models for lithium-ion batteries should consider both the electrochemical reaction and heat transfer. Thus, an electrochemical–thermal coupling model was necessary for our study. The electrochemical model used in this study is the classic pseudo two-dimensional (P2D) model proposed by Newman et al.,18 which was applied in the lithium-ion sandwich structure, consisting of a porous electrode, separator, and current collectors. The preconditions for simplifying the electrochemical model into the P2D model are as follows:18,19 (1) no gas generation is observed; (2) transport process of the electrolyte conforms to the concentrated solution theory; (3) no side reactions occur; (4) charge transfer reaction conforms to the Butler–Volmer equation; (5) transport of ionic species in the electrolyte occurs only by diffusion and electromigration; (6) electrode active material is composed of spherical particles of uniform size; and (7) battery volume change is negligible during discharge. A schematic of the lithium-ion battery and description of the P2D electrochemical model are shown in Fig. 1. Many efforts have been made16,18,20,21 to validate this model, which is now widely used for the model establishment of lithium-ion batteries. The electrochemical model is composed of three sections: mass conservation, charge conservation, and electrochemical kinetics. The governing equations and boundary conditions are summarized in Appendix A eqn (A.1)–(A.20), which have been described in detail in our previous report,1 and thus not repeated here.
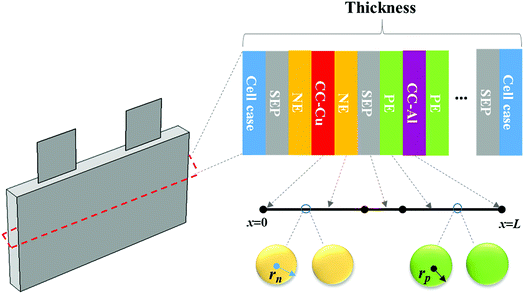 |
| | Fig. 1 Schematic of the lithium-ion battery and description of the P2D electrochemical model. | |
The heat generated in the battery can be divided into two categories: reversible heat, which is originates from the entropy change of the electrode active materials, and irreversible heat, which is caused by the irreversible process and can be further divided into polarization heat and ohmic heat. The former is ascribed to the working potential deviating from the equilibrium potential (defined as the “overpotential”) while the latter is due to the resistance of transportation of Li+ during the electrochemical reaction process. The thermal model is based on the energy conservation equation as seen in Appendix A eqn (A.21), the governing equations and boundary conditions are summarized in Appendix A eqn (A.21)–(A.26), and the parameters h and ε are selected as 15 W m−2 K−1 and 0.95, respectively, according to our previous literature.1 Since the internal structure of the battery is laminated, the battery cell is integrated as a thermal conductivity anisotropic material,22–26 and the thermal conductivity in different directions x, y and z is considered separately and defined as eqn (B.12) and (B.13).
The coupling mechanism of the model is to couple the heat source calculated in the P2D electrochemical model to the 3D thermal model, causing a temperature change in the thermal model. The change in temperature fed back to the electrochemical model leads to a change in the temperature-dependent parameters in the electrochemical model, as listed in Appendix B.
2.2 Model parameters
Accurate parameters are essential to ensure the accuracy of the model. Thus, parameters including electrochemical parameters and thermal parameters were used in the electrochemical model and thermal model, respectively. Some of them were measured manually, such as the dimensions of the cell and electrode, some of them were derived from the literature, while the others were adjusted and corrected via the model to match the simulation well with the experiment. All the parameters are listed in Tables 1, 2, and 3, respectively.
Table 1 Parameters of the lithium-ion pouch cell
| Capacity (A h) |
Initial voltage (V) |
Width (mm) |
Height (mm) |
Thickness (mm) |
| 18.5 |
4.2 |
142 |
73 |
12 |
Table 2 Electrochemical basic parametersa1,27
| Symbol (unit) |
Anode |
Cathode |
Separator |
|
“—” indicates that the parameter does not exist or was ignored.
|
|
R
s,i (μm) |
5 |
3.5 |
— |
|
L
i (μm) |
65 |
55 |
10 |
|
ε
1,i
|
0.62 |
0.43 |
— |
|
ε
2,i
|
0.26 |
0.332 |
0.54 |
|
ε
c,i
|
0.12 |
0.238 |
|
|
c
max (mol m−3) |
25![[thin space (1/6-em)]](https://www.rsc.org/images/entities/char_2009.gif) 000 000 |
37![[thin space (1/6-em)]](https://www.rsc.org/images/entities/char_2009.gif) 420 420 |
— |
| SOCmax |
0.98 |
0.985 |
— |
| SOCmin |
0 |
0.03 |
— |
|
C
0 (mol m−3) |
18![[thin space (1/6-em)]](https://www.rsc.org/images/entities/char_2009.gif) 719 719 |
973.2 |
1200 |
|
E
a,i (kJ mol−1) |
20 |
30 |
— |
|
k
i (m s−1) |
1 × 10⁻¹² |
1 × 10⁻¹² |
— |
|
D
1 (m2 s−1) |
Eqn (B.1) |
3 × 10⁻¹³ |
— |
|
D
2 (m2 s−1) |
— |
— |
7.5 × 10⁻¹¹ |
|
σ (S m−1) |
100 |
10 |
Eqn (B.3) |
|
α
|
0.5 |
0.5 |
— |
|
γ
|
1.5 |
1.5 |
— |
|
f
|
0 |
|
|
|
t
+
|
— |
— |
0.363 |
|
U
ref (V) |
Eqn (B.6) |
Eqn (B.7) |
— |
| dU/dT (V K−1) |
Eqn (B.8) |
Eqn (B.9) |
— |
|
T
ref (K) |
298.15 |
|
|
|
σ
B (W m−1 K−4) |
5.67 × 10⁻⁸ |
|
|
|
F (C mol−1) |
96![[thin space (1/6-em)]](https://www.rsc.org/images/entities/char_2009.gif) 487 487 |
|
|
|
R (J mol−1 K−1) |
8.314 |
|
|
Table 3 Thermal parameters of the materials
| Parameters |
Density (kg m−3) |
Heat capacity (J kg−1 K−1) |
Thermal conductivity (W m−1 K−1) |
| Anode28 |
1555 |
1437 |
1.04 |
| Cathode28 |
2895 |
1270 |
1.58 |
| Separator28 |
1017 |
1978 |
0.34 |
| Electrolyte22 |
1210 |
1518 |
0.099 |
| Aluminum foil28 |
2702 |
903 |
238 |
| Copper foil28 |
8933 |
385 |
398 |
| Cell29 |
Eqn (B.11) |
Eqn (B.10) |
Eqn (B.12) and (B.13) |
2.3 Model validation
The validation of the model should consider both the electrochemical and thermal properties, where the index to verify the electrochemical properties is the discharge curve or specifically the working voltage during discharge, and the index to verify the thermal behavior is the temperature of the battery. Therefore, charge and discharge tests were performed on Neware CT-4008-10V50A-NTA Battery Testing System via the following steps: first, five thermocouples (their placement is shown in Fig. 3(a)) were placed on the battery surface before the charge–discharge process to measure the temperature of the battery during the discharge. Second, the battery was left for 10 minutes. Third, the battery was operated for galvanostatic charge procedure until the voltage reached 4.2 V, then followed by a constant voltage (4.2 V) charging process, and the cut-off current was set as 0.01C (0.185 A). Afterwards, the battery was left for 10 minutes and a galvanostatic discharge procedure was implemented, with the cut-off voltage set as 2.75 V. At the end of the discharge, a Fluke Ti200 9 Hz Thermal Imager was used to scan the surface temperature of the battery, which was compared with the simulation results. To improve the accuracy of the model, the experimental method was conducted at four discharge rates: 0.5C (9.25 A), 1C (18.5 A), 1.5C (27.75 A), and 2C (37 A). A comparison of the discharge curve at the four discharge rates is shown in Fig. 2, and the average temperature curves and temperature distribution between the simulation and experiment are shown in Fig. 3 and 4, respectively.
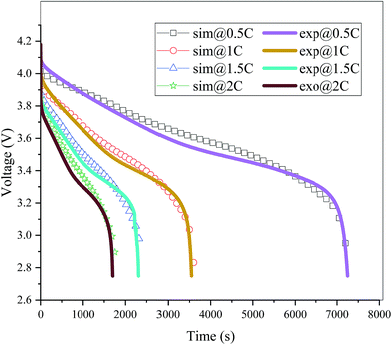 |
| | Fig. 2 Comparison of the discharge curves between the simulation and experiment at four different discharge rates (sim: simulation and exp: experiment). | |
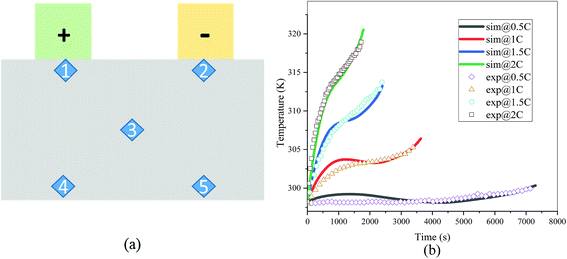 |
| | Fig. 3 (a) Placement of the thermocouples, where the five points 1, 2, 3, 4 and 5 represent the placement of the five thermocouples1 and (b) comparison of the average temperature of the five points between the experiment and simulation at four discharge rates (sim: simulation and exp: experiment). | |
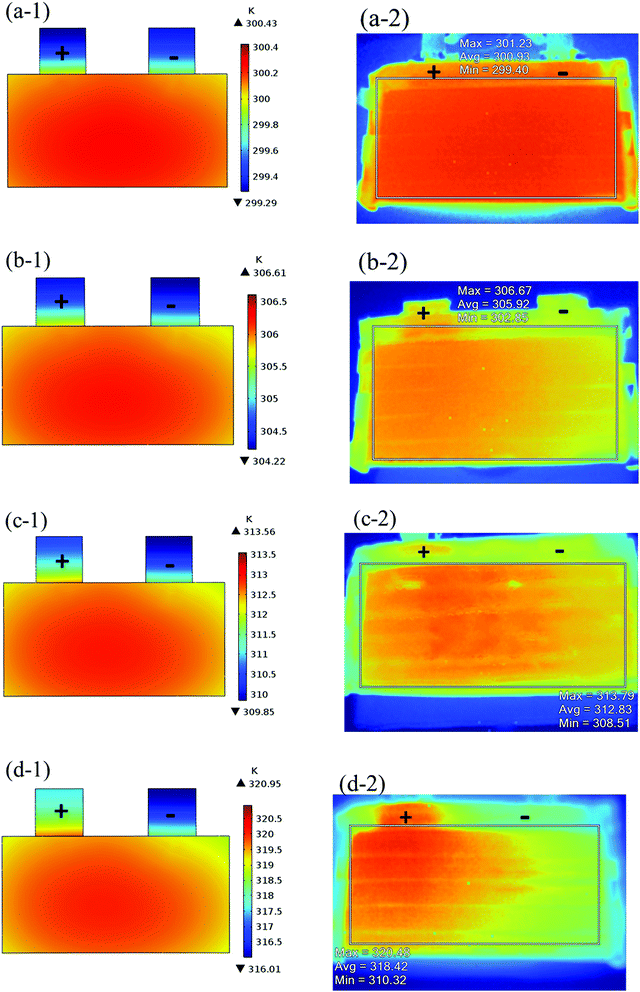 |
| | Fig. 4 Comparison of temperature distribution at the end of the discharge between the simulation and experiment, (−1): simulation results and (−2): experiment results for (a) 0.5C; (b) 1C; (c) 1.5C; and (d) 2C. | |
From Fig. 2, the simulated discharge curves match well with the experiment at the four discharge rates; thus, demonstrating the good agreement between the simulation and experiment. For the temperature validation, both the temperature curves during the whole discharge process and the temperature distribution at the end of the discharge were taken into consideration. The 5 thermocouples were placed on the surface of the battery to measure the temperature at different positions and subsequently calculate the average temperature to compare the results of the experiment and simulation. Then the average temperature curves of the five points of the experiment and simulation at four discharge rates were compared in Fig. 3(b), which exhibits a good agreement between experiment and simulation during the whole discharge process. A comparison of the temperature distribution at the end of the discharge is displayed in Fig. 4, where the simulated results are basically the same as the experimental result, although there are some slight differences. First, the temperature difference from the experiment is larger than that from the simulation, which may be attributed to two reasons. On the one hand, the active materials are considered to be stable and uniform during the discharge and no side reactions are taken into account according to the basic assumption of the classic electrochemical model. On the other hand, the temperature taken by the infrared Thermal Imager is affected by environmental conditions, and although the ambient temperature was set as a constant value, the cold wind from the air conditioning still caused small fluctuations in environmental conditions. Both factors led to a higher temperature difference for the experiment. Second, the highest temperature of the experiment occurred near the positive tab at a high discharge rate, while the hotspot of simulation was always located at the center of the cell and moved to the vicinity of the positive tab at a high discharge rate. This is due to the fact that the tab is connected with the wires of the battery testing system, and the Joule heat of the wires was high at a high discharge rate, thus causing the high temperature of the wires. At the same time, the wires were connected with the tab, leading to a relatively higher temperature for the tab. Furthermore, due to the higher thermal conductivity and lower resistance of the negative tab, the temperature of the negative tab was lower than the positive tab. In conclusion, the slight differences can be neglected. Fig. 2, 3 and 4 provide strong evidence for the accuracy of the model, which can be used as support for subsequent research.
3. Results and discussion
The electrochemical–thermal coupling model with the control equations and boundary conditions, as described in Section 2.1, was solved using the finite element method (FEM) based on the COMSOL Multiphysics 5.2® software. The mesh built in the 3D sub-model was the free tetrahedral, which was composed of 13![[thin space (1/6-em)]](https://www.rsc.org/images/entities/char_2009.gif) 484 tetrahedral elements, 6540 triangular elements, 530 edge elements and 24 vertex elements. The mesh passed the mesh independence test, where when the mesh was encrypted or coarsened twice that of the original mesh, the simulation results differed by less than 2%. The configuration of the 3D geometry and mesh is shown in Fig. 5.
484 tetrahedral elements, 6540 triangular elements, 530 edge elements and 24 vertex elements. The mesh passed the mesh independence test, where when the mesh was encrypted or coarsened twice that of the original mesh, the simulation results differed by less than 2%. The configuration of the 3D geometry and mesh is shown in Fig. 5.
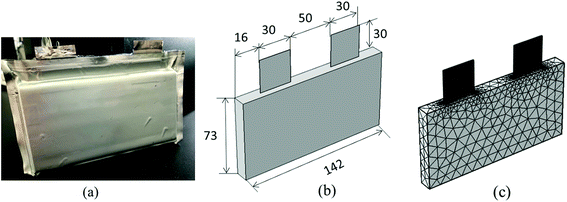 |
| | Fig. 5 Configuration of the lithium-ion battery. (a) Actual battery appearance, (b) geometry and dimensions of the 3D thermal model and (c) mesh of the 3D thermal model. | |
Using the validated coupling model, the influence of the electrode design parameters (electrode thickness, volume fraction of the active material, and particle size) on the electrochemical and thermal characteristics as well as the energy density and power density of the battery was investigated initially, and then the positive and negative electrode thickness was optimized in two ways: maximizing the energy density and maximizing the product of energy density and power density. Finally, the optimal electrode thickness of the positive and negative was obtained via two types of optimization methods. All the conditions were calculated at a discharge rate of 1C.
3.1 The effect of electrode thickness on the performance of battery
Macroscopically, the electrode thickness can directly affect the capacity and mass of the battery, which influence the energy density and power density. Microscopically, the electrode thickness affects the length of the lithium ion (Li+) diffusion path, which influences the mass transfer process and polarization. The original thickness of the positive and negative electrodes was 55 μm and 65 μm by measurement, respectively. In this section, we only varied the thickness of the positive electrode (35 μm, 45 μm, 55 μm, and 65 μm), while maintaining the thickness of the negative electrode.
Fig. 6 shows the electrolyte concentration vs. electrode thickness at four different positive electrode thicknesses with 1C discharge rate at the end of the discharge, where the electrolyte concentration can also be considered the Li+ concentration. From the results, as the electrode thickness increased, the electrolyte concentration of the negative electrode increased, while as that of the positive electrode decreased, the electrolyte concentration gradient increased. This phenomenon may be attributed to the lengthening of the liquid phase diffusion path, thus leading to an increase in liquid phase diffusion polarization. Zhao14 noted that the ohmic heat is caused by the resistance of transportation of Li+ during the electrochemical reactions, which is closely related to the electrode thickness. As shown in eqn (A.25), the ohmic heat is related to the electrolyte potential gradient18 since the negative electrode potential is set to zero at the model; thus, the electrode potential gradient is basically a constant value. The profiles of the electrolyte potential gradient and ohmic heat are exhibited in Fig. 7, where can been seen that the electrolyte potential gradient is always negative along the electrode thickness, indicating a decrease in electrolyte potential along the electrode thickness, which is in consistent with the literature.14,18 As the thickness of the electrode increases, the absolute value of the electrolyte potential gradient increases, and the ohmic heat increases, further demonstrating the increase in internal resistance. It is worth mentioning that the ohmic heat of the separator is lower than that of the electrodes, illustrating that decreasing the electrode thickness will cause a substantial decrease in the ohmic drop; whereas, decreasing the separator thickness will cause only a small improvement.
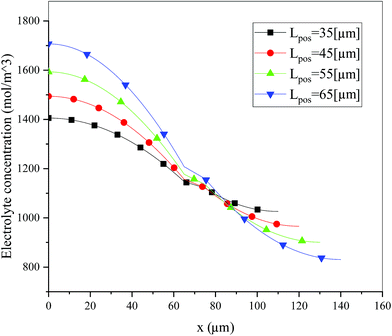 |
| | Fig. 6 Electrolyte concentration along the electrode thickness at four different positive electrode thicknesses with a discharge rate of 1C at the end of the discharge. | |
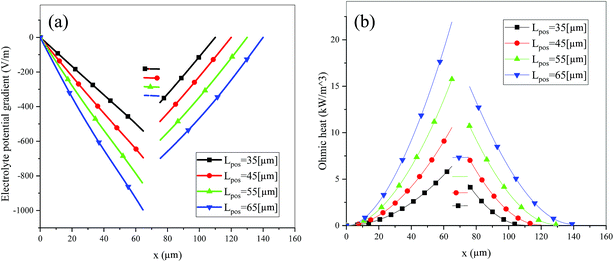 |
| | Fig. 7 Electrolyte potential gradient and ohmic heat profiles along the electrode thickness at the end of discharge with different electrode thicknesses. | |
Consideration was also given to the overpotential to further prove the effect of the polarization. The overpotential of the positive and negative electrodes is depicted in Fig. 8, from which we can see that the overpotential of the negative and positive electrodes is positive and negative, respectively, which is in accordance with the electrochemical rule. In addition, with an increase in the electrode thickness, the absolute value of the overpotential increased, indicating an increase in polarization. Afterwards, the polarization heat and total heat curves are described in Fig. 9, as given in eqn (A.26), where the polarization heat is related to the overpotential, which exhibited a similar tendency as the overpotential. First it decreased, and then tended to plateau and finally increased during the discharge and the polarization heat increased with an increase in the electrode thickness, and similarly, the total heat generation rate is also increased at the thick electrodes.
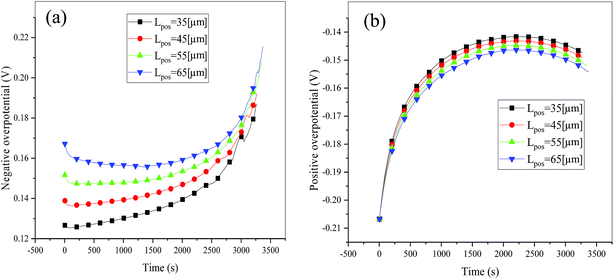 |
| | Fig. 8 Overpotential of the negative (a) and positive (b) electrodes during the discharge process at different positive electrode thicknesses. | |
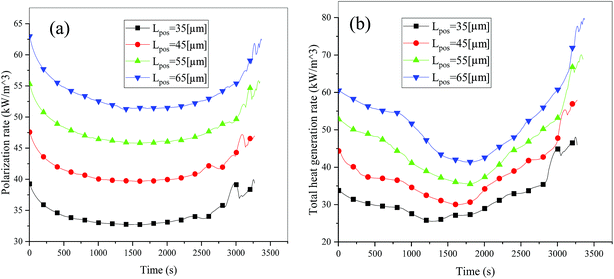 |
| | Fig. 9 Heat generation rate during the discharge process at different electrode thicknesses. (a) Polarization heat and (b) total heat source. | |
In addition to the electrochemical characteristics and heat generation rate, the temperature distribution is also an important indicator to evaluate the battery performance. From Fig. 10 and experience we predicted the maximum temperature and temperature deviation would occur at the end of the discharge. Hence, the temperature distribution at the end of the discharge is exhibited at Fig. 11 to judge the difference in temperature at different electrode thicknesses by color, where the temperature legend was unified. From both Fig. 10 and 11, it was found that the temperature of the battery increased with an increase in the electrode thickness, where the maximum temperature increased from 304.28 K to 309.06 K, with an increase of 4.78 K. Simultaneously, the temperature difference increased from 2.12 K to 3.79 K, which was caused by the increased polarization and discharge current density at the same discharge rate with an increase in the electrode thickness, as mentioned above.
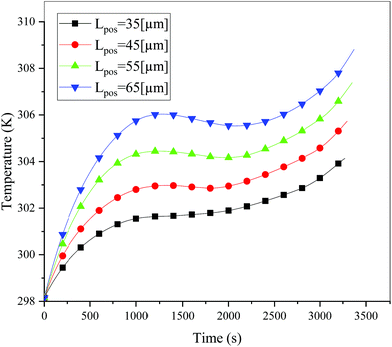 |
| | Fig. 10 Temperature curves during the entire discharge process at a discharge rate of 1C with different positive electrode thicknesses. | |
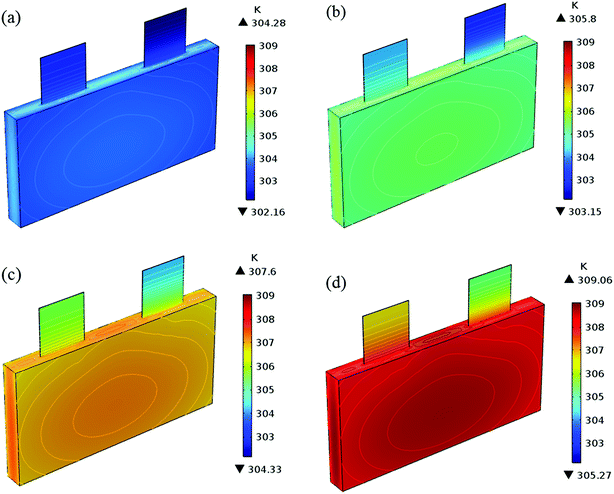 |
| | Fig. 11 Temperature distribution and contour of the battery at the end of discharge with a discharge rate of 1C with different positive electrode thicknesses. (a) 35 μm, (b) 45 μm, (c) 55 μm and (d) 65 μm. | |
As a significant indicator to evaluate the battery performance, the Ragone plot is depicted in Fig. 12. A Ragone plot is used to compare the performance of various energy-storing devices. In this plot, the values of specific energy (W h kg−1) are plotted versus specific power (W kg−1), and both axes are on the logarithmic scale. The Ragone plot was first used to compare the performance of batteries.30 The energy density (E) and power density (P) were calculated using eqn (1) and (2), respectively, where M is the mass of the electrode, which is composed of positive and negative active materials, current collector, separator and electrolyte, but not the cell casing and other external battery mass, resulting in a relatively higher value by simulation than reality.
| |  | (1) |
| |  | (2) |
| | | M = (Lpccρpcc + Lnccρncc + Lpεpsρp + Lpεplρl + Lnεnsρn + Lnεnlρl + Lsεsρl + Lsρs) × Aelec | (3) |
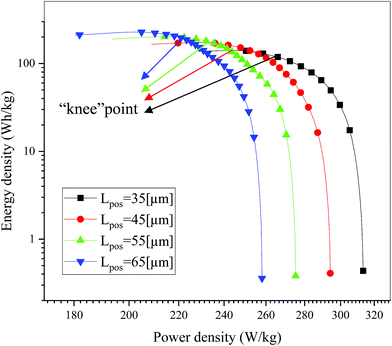 |
| | Fig. 12 Comparison of the Ragone plots for four different positive electrode thicknesses during the discharge, where both axes are on the logarithmic scale. | |
On examining Fig. 12, it is found that there is a trade-off between the energy density and power density, where, as the power density increased, the energy density decreased. The note in the figure is the “knee” point,18 which represents the region with a high value for power density, where the energy density begins to fall off. It is significant for a battery to maintain the maximum energy density at nearly the highest power density by optimizing the electrode design, which will be explained in detail in Section 3.4. As shown in Fig. 12, the energy density increased while the power density decreased with an increase in the electrode thickness, which is consistent with the previous literature.15,18 An increase in energy density from 140.99 W h kg−1 to 228.15 W h kg−1 was obtained when the positive electrode thickness increased from 35 μm to 65 μm. This improvement is mainly ascribed to the decrease in the proportion of separators and current collectors, and if the other inactive materials such as the cell casing and other external components are considered in eqn (3), the improvement in energy density must be significant. Furthermore, a decrease in power density from 313.31 W kg−1 to 258.11 W kg−1 was also observed when the positive electrode thickness increased from 35 μm to 65 μm. This degradation is attributed to the extension of the discharge time at the same discharge current density.
3.2 The effect of volume fraction of the active material on the performance of the battery
Another significant electrode design parameter is the volume fraction of the active material, which is indicated by ε1,i and is relevant to the compaction density (ρc) and surface density (ρs), as shown in eqn (4) and (5). Here, we changed the volume fraction of the positive active material (which is indicated by “εpos” hereinafter) for four values (0.4, 0.45, 0.5, and 0.55) and maintained the volume fraction of the negative active material, then analyzed the electrochemical characteristics, thermal behavior, energy density and power density, as discussed in Section 3.1.
Fig. 13–17 describe the electrolyte concentration, electrolyte potential gradient, ohmic heat, overpotential, polarization heat and total heat generation rate, as well as the temperature with different εpos, which resemble the patterns in Fig. 6 and 11, and thus not repeated here. This phenomenon can be attributed to the increase in the polarization and internal resistance with an increase in the volume fraction of active materials. Specifically, as the volume fraction of active materials increased, more Li+ could be intercalated and deintercalated into the active particles, resulting in an increase in the capacity, internal resistance and polarization, causing a larger gradient of the electrochemical properties and higher heat generation rate. The effect of the volume fraction of the active material on the performance of the battery is similar to that of the electrode thickness. The Ragone plot is depicted in Fig. 18, which is also similar to Fig. 12, where the volume fraction of the active material increased, the energy density increased, while the power density decreased.
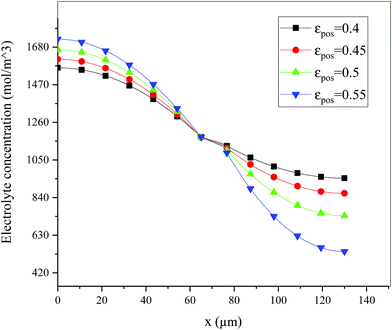 |
| | Fig. 13 Electrolyte concentration along the electrode thickness at different εpos with a discharge rate of 1C at the end of the discharge. | |
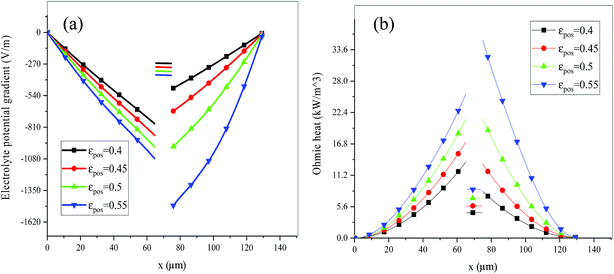 |
| | Fig. 14 Electrolyte potential gradient and ohmic heat profiles along the electrode thickness at the end of discharge with different εpos. | |
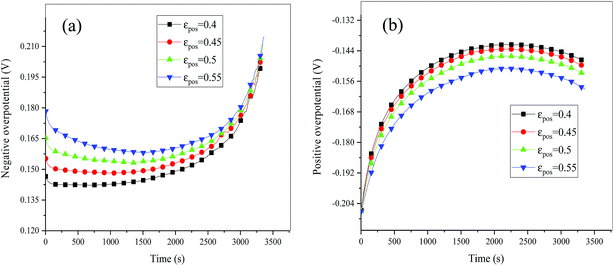 |
| | Fig. 15 Overpotential of the negative (a) and positive (b) electrodes during the discharge process at different εpos. | |
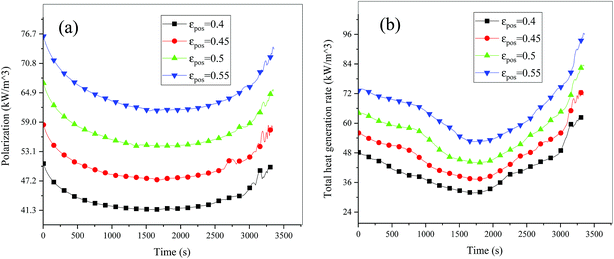 |
| | Fig. 16 Heat generation rate during the discharge process at different εpos. (a) Polarization heat and (b) total heat source. | |
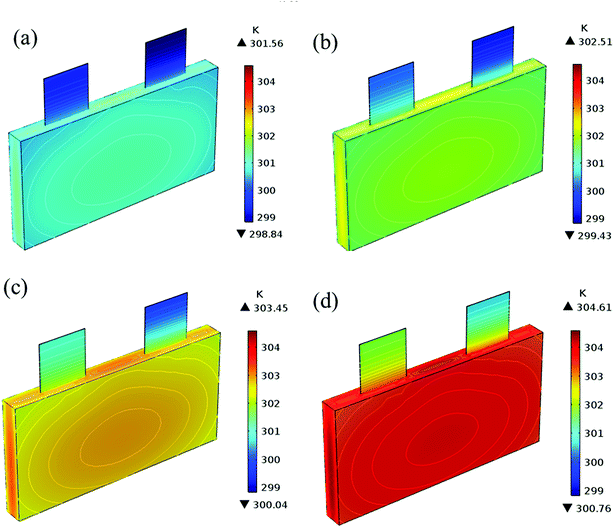 |
| | Fig. 17 Temperature distribution and contour of the battery at the end of discharge with different εpos. (a) 0.4, (b) 0.45, (c) 0.5 and (d) 0.55. | |
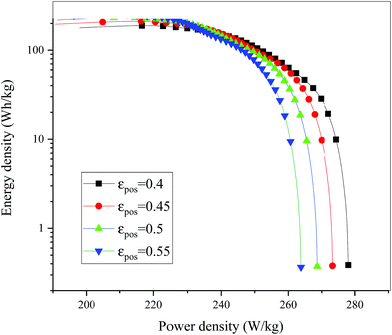 |
| | Fig. 18 Comparison of the Ragone plots for different εpos during the discharge, where both axes are on the logarithmic scale. | |
3.3 The effect of particle size on the performance of the battery
The effect of particle size on the performance of the battery is different from that of the electrode thickness and volume fraction of active material, which mainly influences the diffusion of lithium ions in the solid phase and further affects the solid-phase polarization. The initial value of the particle size of the positive and negative electrodes was 3.5 μm and 5 μm, respectively. In this section, we just change the particle size of the positive material (1.75 μm, 3.5 μm, 5.25 μm and 7 μm), which is indicated by “rp”, while maintaining the particle size of the negative material constant.
Fig. 19 shows the lithium concentration difference between the surface and center of the active material particles (indicated by “Δcs” below) along the positive electrode thickness at the end of the discharge, where it can be seen that the Δcs is basically the same in the thickness direction, while it increased with an increase in the rp. This is attributed to two factors: the smaller the particle size, the shorter the distance of Li+ intercalating and deintercalating to the active materials, and in the case where the solid-phase diffusion coefficient is constant, the time required for the lithium concentration on the surface and center of the particle to reach equilibrium is shorter. On the other hand, as shown in eqn (A.4), the specific surface area is increased by reducing the particle size, and when the current density is constant, the current density at the electrode surface is reduced. Both factors contribute to a reduction in the solid-phase diffusion polarization. The working voltage and overpotential curves were also considered to further demonstrate the effect of the polarization. We can see from the Fig. 20(a) that the voltage platform decreased with an increase in particle size, and from Fig. 20(b) that the absolute value of the positive overpotential increased, both illustrating the larger polarization at a large particle size. Then the heat generation rate profiles and temperature distribution are depicted in Fig. 21 and 22, respectively, which resemble the pattern in Fig. 9 and 11, and thus not repeated here. However, the Ragone plots (Fig. 23) is different from that of Fig. 12 and 18 which exhibit an improvement in both energy density and power density with a decrease in particle size. Although this change is not as evident as in Fig. 12 and 18, this is still an effective way to simultaneously improve energy density and power density, which can provide some guidance for the electrode design.
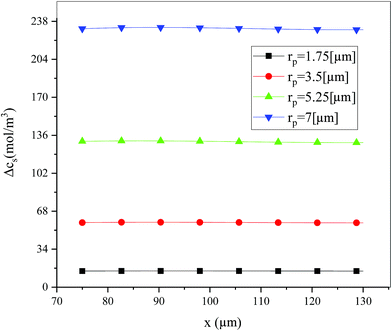 |
| | Fig. 19 Lithium concentration difference between the surface and center of the active material particles along the positive electrode thickness at the end of the discharge with different positive particle sizes. | |
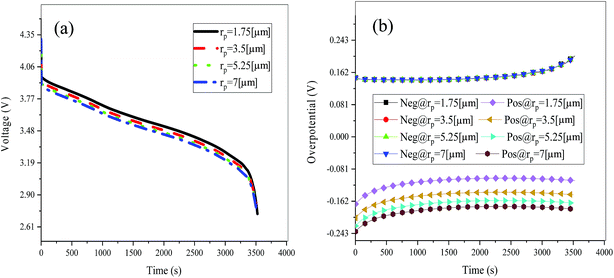 |
| | Fig. 20 Working voltage (a) and overpotential (b) curves during the discharge process with different particle sizes. | |
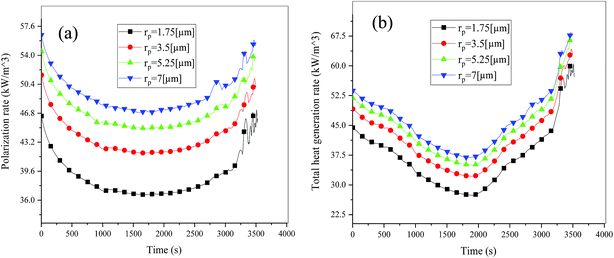 |
| | Fig. 21 Heat generation rate profiles vs. discharge time at different particle sizes. (a) Polarization heat and (b) total heat generation rate. | |
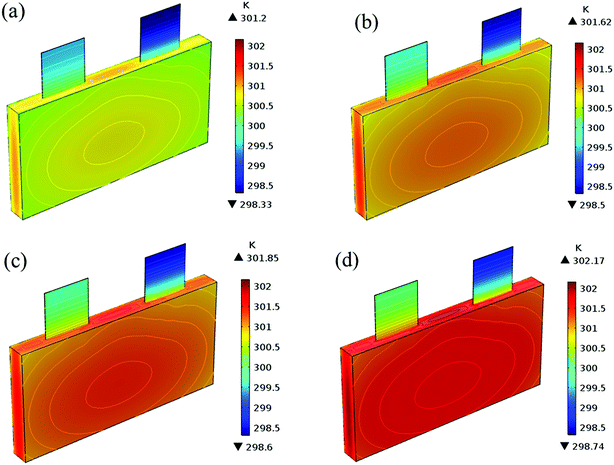 |
| | Fig. 22 Temperature distribution and contour of the battery at the end of discharge with different positive particle sizes. (a) 1.75 μm, (b) 3.5 μm, (c) 5.25 μm and (d) 7 μm. | |
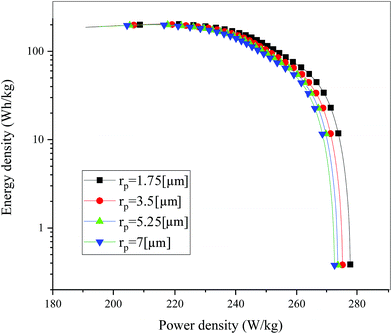 |
| | Fig. 23 Comparison of the Ragone plots for four different positive particle sizes during the discharge, where both axes are on the logarithmic scale. | |
3.4 The optimization of the electrode thickness
The effect of the positive electrode thickness of the battery performance was investigated, and it was found that the energy density will improve while the power density will degrade with an increase in the positive electrode thickness. Many cases have focused on obtaining a maximum energy density since that tends to be the most significant limitation on battery performance for many applications; however, the power density is also crucial to obtain higher rate performance. Therefore, we focused on both the energy density and power density, and the multi-parameters optimization of the thickness of the positive and negative electrode was performed in two ways: first, the energy density (indicated by “E” hereinafter) was selected as the objective function and second, the product of the energy density and power density (indicated by “E × P” hereinafter) was considered as the objective function to consider both energy density and power density. Moreover, two types of optimization methods were used to improve the accuracy of the optimization: the N–M method (Nelder–Mead method), also called the downhill simplex method or amoeba method, which was proposed by Nelder and Meada in 1965 (ref. 31) and is a commonly applied numerical method to find the minimum or maximum of an objective function. It is applied to nonlinear optimization problems for which derivatives may not be known. The other is the COBYLA method (constrained optimization by linear approximation method), which was invented by Powell32 and is a numerical optimization method for constrained problems, where the derivative of the objective function is not known. It works by iteratively approximating the actual constrained optimization problem with linear programming problems.
The procedure for the optimization is illustrated in Fig. 24. First, the initial electrode thickness was substituted into the electrochemical–thermal coupling model to calculate the values of the objective function and constraints. Next, the calculation result was fed back into the optimization method, and based on the optimization method, the next electrode thickness was substituted into the model to calculate the values of the objective function and constraints. Then, feedback to the optimization method again was performed according to whether the objective function was maximized to judge whether to perform the next iteration until the objective function was maximized, and finally the electrode thickness of the last iteration was obtained, which is the optimized electrode thickness. The constraints used in this optimization included two aspects. First, the temperature of the battery needs to be controlled within a certain range, where the best working temperature of the battery is 298–313 K.33 Second, the capacity of the negative electrode should be slightly larger than that of the positive electrode to avoid the generation of lithium dendrites; thus, the ratio of negative and positive capacity (NP ratio) is in the range of 1.1 to 1.2 according to design experience and the literature.6 The initial value of the positive electrode thickness and negative electrode thickness was 55 μm and 65 μm, and the range of the parameters was taken as 30–80 μm and 30–100 μm, respectively, which follow the trend that the sum of the upper and lower limits is twice the initial value. The two optimization methods were applied to the optimization of two different objective functions, finally obtaining four optimization results, which could be compared to gain the final optimization parameters and objective functions. The initial value and optimized results are summarized in Table 4. According to Table 4, when the objective function is E, the results obtained by the two optimization methods are basically the same; whereas, when the objective function is E × P, the two optimization methods yield different results. Although the value of the objective function of the N–M method is higher, the thickness of the positive and negative electrodes is too small, which does not meet the principle of the margin capacity of the battery design, and the energy density is lower than the initial value. For the COBYLA method, the optimized energy density and power density were both improved compared with the initial values. Thus, the COBYLA method is more appropriate for our optimization, where the positive electrode thickness of 55.335 μm and negative electrode thickness of 63.188 μm were considered as the final optimized parameters. The energy density and power density were 244.37 W h kg−1 and 247.11 W kg−1, which increased by 1.59% and 1.08% compared with the initial energy density and power density of 239.71 W h kg−1 and 244.46 W kg−1, respectively.
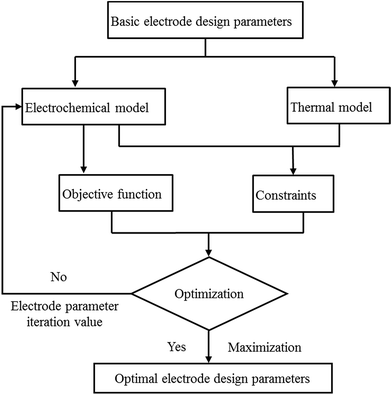 |
| | Fig. 24 Procedure for the optimization based on the electrochemical–thermal model. | |
Table 4 Initial value and optimization results based on two objective functions using two optimization methodsa
| Optimization method |
Objective function |
L
pos (μm) |
L
neg (μm) |
E (W h kg−1) |
P (W kg−1) |
E × P (W2 h kg−2) |
|
E: energy density, P: power density, Lpos: thickness of the positive electrode, Lneg: thickness of negative electrode and “—“: this part does not exist or was ignored.
|
| Initial value |
— |
55 |
65 |
239.71 |
244.46 |
58![[thin space (1/6-em)]](https://www.rsc.org/images/entities/char_2009.gif) 601 601 |
| N–M |
E
|
56.15 |
65.933 |
243.24 |
241.11 |
— |
| N–M |
E × P |
39.855 |
34.863 |
205.37 |
330.06 |
67![[thin space (1/6-em)]](https://www.rsc.org/images/entities/char_2009.gif) 784 784 |
| COBYLA |
E
|
56.511 |
66.441 |
242.57 |
241.19 |
— |
| COBYLA |
E × P |
55.335 |
63.188 |
244.37 |
247.11 |
60![[thin space (1/6-em)]](https://www.rsc.org/images/entities/char_2009.gif) 387 387 |
4. Conclusions
Based on the validated electrochemical–thermal coupling model, the effects of the battery design parameters (electrode thickness, volume fraction of the active material, and particle size) on the battery performance (electrochemical characteristics, thermal behavior, energy density and power density) were first investigated, then the representative electrode design parameters, thickness of the positive and negative electrodes, were optimized using the multi-objective (energy density and power density) and multi-method to obtain the final optimized electrode thicknesses. The conclusions are summarized as below:
(1) The effect of the volume fraction of the active material on the battery performance is similar to that of the electrode thickness: as the parameters increase, the capacity of the battery increases, leading to an increase in the 1C discharge current, where polarization, particularly the liquid phase diffusion polarization, becomes considerable. On the one hand, the gradient of the electrochemical properties, heat generation rate and temperature of the batteries all increase; on the other hand, the energy density is improved, while the power density is degraded.
(2) The particle size mainly has an impact on the solid-phase diffusion polarization, where, as the particle size decreases, the polarization and heat generation rate decrease, and both the energy density and power density are improved.
(3) For the optimization of electrode thickness, the optimized positive and negative electrode thicknesses are 55.335 μm and 63.188 μm, and the energy density and power density are 244.37 W h kg−1 and 247.11 W kg−1, which increased by 1.59% and 1.08% compared with the initial energy density and power density of 239.71 W h kg−1 and 244.46 W kg−1, respectively. The energy density and power density were both improved after optimization.
Appendix A
Governing equations and boundary conditions of the model.1,18,20
| Physics |
Governing equations and boundary conditions |
|
| Mass conservation in solid phase |

|
(A.1) |
| −∇c1|r=0 = 0 |
(A.2) |
|
|

|
(A.3) |
|
|
S
a,i = 3ε1,i/r |
(A.4) |
| Mass conservation in electrolyte phase |

|
(A.5) |
|
|
D
eff2 = D2ε2γ |
(A.6) |
|
|
−∇c2|x=0,x=L = 0 |
(A.7) |
|
|
−∇c2|x=Ln = −∇c2|x=Ln+Ls |
(A.8) |
| Charge conversation in solid phase |
i
1 = −σeff1∇φ1 |
(A.9) |
|
|

|
(A.10) |
|
|
φ
1|x=0 = 0 |
(A.11) |
|
|
−σeff1∇φ1|x=Ln,x=Ln+Ls = 0 |
(A.12) |
|
|
σ
eff1 = σ1ε1γ |
(A.13) |
|
|
−σeff1∇φ1|x=0 = −σeff1∇φ1|x=L = iapp |
(A.14) |
| Charge conversation in solution phase |

|
(A.15) |
|
|
σ
eff2 = σ2ε2γ |
(A.16) |
|
|
∇i2 = Sa,ijloc,i |
(A.17) |
| Electrochemical kinetics |

|
(A.18) |
|
|
η
i = φ1,i − φ2,i − Uoc |
(A.19) |
|
|
j
0,i = Fkic2αan(c1,max,i − c1,surf,i)αanc1,surf,iαca |
(A.20) |
| Energy conversation |

|
(A.21) |
|
|
q = qrev + qirrev; qirrev = qohm + qact |
(A.22) |
|
|
q
loss = qconv + qrad = hA(Tamb − T) + εσBA(Tamb4 − T4) |
(A.23) |
| Reversible heat |

|
(A.24) |
| Ohmic heat |
q
ohm = −i1∇φ1 − i2∇φ2 |
(A.25) |
| Polarization heat |
q
act = Sa,ijloc,iη |
(A.26) |
Appendix B
Temperature dependent parameters and battery overall thermal parameters1,34,35
| Parameters |
Equations |
|
|
Temperature-dependent parameters
|
| Diffusion coefficient of the negative electrode |

|
(B.1) |
| Diffusion coefficient of the electrolyte |

|
(B.2) |
| Electrolyte conductivity |
σ
2 = 10−4c2 × 1.2544 × (−8.2488 + 0.053248T − 0.00002987T2 + 2.26235 × 0.001c2 − 0.0093063 × 0.001c2T + 0.000008069 × 0.001c2T + 0.22002 × 10⁻⁶c22−0.0001765 × 10⁻⁶c22T)2 |
(B.3) |
| State of charge (SOC) |

|
(B.4) |
| Open circuit voltage |

|
(B.5) |
|
|
U
ref,n = 0.1493 + 0.8439![[thin space (1/6-em)]](https://www.rsc.org/images/entities/char_2009.gif) exp(−61.79θn) + 0.3824 exp(−61.79θn) + 0.3824![[thin space (1/6-em)]](https://www.rsc.org/images/entities/char_2009.gif) exp(−665.8θn) − exp(39.42θn − 41.92) − 0.0313arctan(25.59θn − 4.099) − 0.009434arctan(32.49θn − 15.74) exp(−665.8θn) − exp(39.42θn − 41.92) − 0.0313arctan(25.59θn − 4.099) − 0.009434arctan(32.49θn − 15.74) |
(B.6) |
|
|
U
ref,p = −10.27θp4 + 23.88θp3 − 16.77θp2 + 2.595θp + 4.563 |
(B.7) |
| Entropy coefficient |

|
(B.8) |
|
|
dUoc,p/dT = −0.64816 + 4.34612θp − 8.05595θp2 + 4.44722θp3 |
(B.9) |
![[thin space (1/6-em)]](https://www.rsc.org/images/entities/char_2009.gif) |
|
Battery overall thermal parameters
|
| Specific heat capacity of the battery |

|
(B.10) |
| Density of the battery |

|
(B.11) |
| Thermal conductivity parallel to the electrode |

|
(B.12) |
| Thermal conductivity perpendicular to the electrode |

|
(B.13) |
Conflicts of interest
There are no conflicts to declare.
Nomenclature (sequential ordering)
|
c
1
| Concentration of lithium in the solid particles (mol m−3) |
|
D
1
| Diffusion coefficient of lithium in solid phase (m2 s−1) |
|
r
| Radius distance variable of the solid particles (m) |
|
t
| Time (s) |
|
R
s
| Radius of electrode particles (m) |
|
j
loc
| Local current density (A m−2) |
|
S
a,i
| Specific surface area (m−1) |
|
F
| Faraday's constant (C mol−1) |
|
c
2
| Concentration of lithium in the solution (mol m−3) |
|
D
2
| Diffusion coefficient of lithium in the solution phase (m2 s−1) |
|
t
+
| Li+ transference number |
|
L
| Thickness (m) |
|
i
1
| Electronic current density in the solid phase (A m−2) |
|
C
dl
| Electrical double layer capacitance (F m−2) |
|
i
app
| Total applied current density (A m−2) |
|
i
2
| Ionic current density in the solution phase (A m−2) |
|
R
| Gas constant, 8.314 (J mol−1 K−1) |
|
T
| Battery temperature (K) |
|
f
| Average molar activity coefficient |
|
j
0,i
| Exchanged current density (A m−2) |
|
U
oc
| Open circuit potential (V) |
|
k
i
| Reaction rate (m s−1) |
|
C
p
| Heat capacity (J kg−1 K−1) |
|
q
| Heat generation rate (W m−3) |
|
q
loss
| Heat dissipation rate (W m−3) |
|
h
| Convective heat transfer coefficient (W m−1 K−1) |
|
A
| Surface area of the battery (m2) |
|
T
amb
| Ambient temperature (K) |
|
V
| Volume of the battery (m3) |
|
A
elec
| Cross-section of the electrodes (m2) |
Greek letters
|
ε
1,i
| Active material volume fraction |
|
ε
2
| Electrolyte volume fraction |
|
γ
| Bruggeman tortuosity factor |
|
σ
1
| Electronic conductivity of solid phase (S m−1) |
|
φ
1
| The electrode potential (V) |
|
φ
2
| The electrolyte potential (V) |
|
σ
2
| Ionic conductivity of electrolyte (S m−1) |
|
α
| Charge transfer coefficient |
|
η
| Overpotential (V) |
|
ρ
| Density (kg m−3) |
|
λ
| Thermal conductivity (W m−1 K−1) |
|
ε
| Emissivity |
|
σ
B
| Stefan–Boltzmann constant (W m−1 K−4) |
|
θ
i
| State of charge |
|
Φ
| Temperature-dependent parameters |
Subscripts
| 0 | Initial value |
| 1 | Solid phase |
| 2 | Solution phase |
| i | Index of the electrodes, positive or negative |
| n | Negative |
| p | Positive |
| s | Separator |
| surf | Surface |
| max | Maximum |
| min | Minimum |
| ref | Reference value |
| conv | Heat convection |
| rad | Heat radiation |
| ohm | Ohmic |
| act | Activation |
| rev | Reversible |
| irrev | Irreversible |
| cc | Current collector |
| elec | Electrode |
Superscript
| eff | Effective value |
| an | Anode |
| ca | Cathode |
Acronyms
| NE | Negative electrode |
| PE | Positive electrode |
| SEP | Separator |
Acknowledgements
This study was supported by the National Key R&D Program of China (No. 2016YFB0100306), the National Natural Science Foundation of China (No. 51674228), the External Cooperation Program of BIC, CAS (No. 211134KYSB20150004) and the Fundamental Research Funds for the Central Universities (No. WK2320000036). Dr Q. S Wang is supported by Youth Innovation Promotion Association CAS (No. 2013286).
References
- W. Mei, H. Chen, J. Sun and Q. Wang, Numerical study on tab dimension optimization of lithium-ion battery from the thermal safety perspective, Appl. Therm. Eng., 2018, 142, 148–165 CrossRef.
- M. Chen, F. Bai, W. Song, J. Lv, S. Lin, Z. Feng, Y. Li and Y. Ding, A multilayer electro-thermal model of pouch battery during normal discharge and internal short circuit process, Appl. Therm. Eng., 2017, 120, 506–516 CrossRef CAS.
- F. Bai, M. Chen, W. Song, Z. Feng, Y. Li and Y. Ding, Thermal management performances of PCM/water cooling-plate using for lithium-ion battery module based on non-uniform internal heat source, Appl. Therm. Eng., 2017, 126, 17–27 CrossRef CAS.
- C. Liu and L. Liu, Optimal Design of Li-Ion Batteries through Multi-Physics Modeling and Multi-Objective Optimization, J. Electrochem. Soc., 2017, 164(11), E3254–E3264 CrossRef CAS.
- A. Samba, N. Omar, H. Gualous, O. Capron, P. Van den Bossche and J. Van Mierlo, Impact of Tab Location on Large Format Lithium-Ion Pouch Cell Based on Fully Coupled Tree-Dimensional Electrochemical–Thermal Modeling, Electrochim. Acta, 2014, 147, 319–329 CrossRef CAS.
- S. De, P. W. C. Northrop, V. Ramadesigan and V. R. Subramanian, Model-based simultaneous optimization of multiple design parameters for lithium-ion batteries for maximization of energy density, J. Power Sources, 2013, 227, 161–170 CrossRef CAS.
- J. Ye, A. C. Baumgaertel, Y. M. Wang, J. Biener and M. M. Biener, Structural optimization of 3D porous electrodes for high-rate performance lithium ion batteries, ACS Nano, 2015, 9(2), 2194–2202 CrossRef CAS PubMed.
- K. Kisu, S. Aoyagi, H. Nagatomo, E. Iwama, M. T. H. Reid, W. Naoi and K. Naoi, Internal resistance mapping preparation to optimize electrode thickness and density using symmetric cell for high-performance lithium-ion batteries and capacitors, J. Power Sources, 2018, 396, 207–212 CrossRef CAS.
- Y. H. Chen, C. W. Wang, X. Zhang and A. M. Sastry, Porous cathode optimization for lithium cells: ionic and electronic conductivity, capacity, and selection of materials, J. Power Sources, 2010, 195(9), 2851–2862 CrossRef CAS.
- H. Zheng, R. Yang, G. Liu, X. Song and V. S. Battaglia, Cooperation between Active Material, Polymeric Binder and Conductive Carbon Additive in Lithium Ion Battery Cathode, J. Phys. Chem. C, 2012, 116(7), 4875–4882 CrossRef CAS.
- J. W. Fergus, Recent developments in cathode materials for lithium ion batteries, J. Power Sources, 2010, 195(4), 939–954 CrossRef CAS.
- C.-H. Lu and S.-W. Lin, Influence of the particle size on the electrochemical properties of lithium manganese oxide, J. Power Sources, 2001, 97–98, 458–460 CrossRef CAS.
- L. Xiao, Y. Guo, D. Qu, B. Deng, H. Liu and D. Tang, Influence of particle sizes and morphologies on the electrochemical performances of spinel LiMn2O4 cathode materials, J. Power Sources, 2013, 225, 286–292 CrossRef CAS.
- R. Zhao, J. Liu and J. Gu, The effects of electrode thickness on the electrochemical and thermal characteristics of lithium ion battery, Appl. Energy, 2015, 139, 220–229 CrossRef CAS.
- H. Zheng, J. Li, X. Song, G. Liu and V. S. Battaglia, A comprehensive understanding of electrode thickness effects on the electrochemical performances of Li-ion battery cathodes, Electrochim. Acta, 2012, 71, 258–265 CrossRef CAS.
- J. Newman, Optimization Of Porosity And Thickness Of A Battery Electrode By Means Of A Reaction-Zone Model, J. Electrochem. Soc., 1995, 142(1), 97–101 CrossRef CAS.
- S. Panchal, M. Mathew, R. Fraser and M. Fowler, Electrochemical thermal modeling and experimental measurements of 18650 cylindrical lithium-ion battery during discharge cycle for an EV, Appl. Therm. Eng., 2018, 135, 123–132 CrossRef CAS.
- M. Doyle, J. Newman, A. S. Gozdz, C. N. Schmutz and J. M. Tarascon, Comparison of modeling predictions with experimental data from plastic lithium ion cells, J. Electrochem. Soc., 1996, 143(6), 1890–1903 CrossRef.
- Y. Ye, Y. Shi, N. Cai, J. Lee and X. He, Electro-thermal modeling and experimental validation for lithium ion battery, J. Power Sources, 2012, 199, 227–238 CrossRef CAS.
- M. Doyle, T. F. Fuller and J. Newman, Modeling Of Galvanostatic Charge And Discharge Of The Lithium Polymer Insertion Cell, J. Electrochem. Soc., 1993, 140(6), 1526–1533 CrossRef CAS.
- M. Doyle and J. Newman, The Use Of Mathematical-Modeling In The Design Of Lithium Polymer Battery Systems, Electrochim. Acta, 1995, 40(13–14), 2191–2196 CrossRef CAS.
- S. Du, M. Jia, Y. Cheng, Y. Tang, H. Zhang, L. Ai, K. Zhang and Y. Lai, Study on the thermal behaviors of power lithium iron phosphate (LFP) aluminum-laminated battery with different tab configurations, Int. J. Therm. Sci., 2015, 89, 327–336 CrossRef CAS.
- Y. Q. Lai, S. L. Du, L. Ai, L. H. Ai, Y. Cheng, Y. W. Tang and M. Jia, Insight into heat generation of lithium ion batteries based on the electrochemical-thermal model at high discharge rates, Int. J. Hydrogen Energy, 2015, 40(38), 13039–13049 CrossRef CAS.
- Y. Chen and J. W. Evans, Thermal analysis of lithium polymer electrolyte batteries by a two dimensional model—thermal behaviour and design optimization, Electrochim. Acta, 1994, 39(4), 517–526 CrossRef CAS.
- S. C. Chen, Y. Y. Wang and C. C. Wan, Thermal analysis of spirally wound lithium batteries, J. Electrochem. Soc., 2006, 153(4), A637–A648 CrossRef CAS.
- C. Zhu, X. Li, L. Song and L. Xiang, Development of a theoretically based thermal model for lithium ion battery pack, J. Power Sources, 2013, 223, 155–164 CrossRef CAS.
- J. Li, Y. Cheng, L. Ai, M. Jia, S. Du, B. Yin, S. Woo and H. Zhang, 3D simulation on the internal distributed properties of lithium-ion battery with planar tabbed configuration, J. Power Sources, 2015, 293, 993–1005 CrossRef CAS.
- S. Goutam, A. Nikolian, J. Jaguemont, J. Smekens, N. Omar, P. Van Dan Bossche and J. Van Mierlo, Three-dimensional electro-thermal model of Li-ion pouch cell: Analysis and comparison of cell design factors and model assumptions, Appl. Therm. Eng. Search PubMed.
- S. C. Chen, C. C. Wan and Y. Y. Wang, Thermal analysis of lithium-ion batteries, J. Power Sources, 2005, 140(1), 111–124 CrossRef CAS.
- D. V. Ragone, Review Of Battery Systems For Electrically Powered Vehicles, SAE Trans., 1968, 77, 131 Search PubMed.
- J. A. Nelder and R. Mead, A Simplex-Method For Function Minimization, Comput J, 1965, 7(4), 308–313 CrossRef.
-
A. R. C. K. S. P. L. Toint, Approximation Theory and Optimization: Tributes to M. J. D. Powell, 1997 Search PubMed.
- A. A. Pesaran, Battery thermal models for hybrid vehicle simulations, J. Power Sources, 2002, 110(2), 377–382 CrossRef CAS.
-
I. Baghdadi, O. Briat, A. Eddahech, J. M. Vinassa, I. Baghdadi, P. Gyan and Ieee, Electro-Thermal Model of Lithium-ion Batteries for Electrified Vehicles Applications, in 2015, Ieee 24th International Symposium on Industrial Electronics, Ieee, New York, 2015, pp 1248–1252 Search PubMed.
- A. Eddahech, O. Briat and J.-M. Vinassa, Thermal characterization of a high-power lithium-ion battery: Potentiometric and calorimetric measurement of entropy changes, Energy, 2013, 61, 432–439 CrossRef CAS.
|
| This journal is © The Royal Society of Chemistry 2019 |
Click here to see how this site uses Cookies. View our privacy policy here.  a,
Haodong
Chen
a,
Jinhua
Sun
a and
Qingsong
Wang
a,
Haodong
Chen
a,
Jinhua
Sun
a and
Qingsong
Wang
 *ab
*ab
![[thin space (1/6-em)]](https://www.rsc.org/images/entities/char_2009.gif) 000
000![[thin space (1/6-em)]](https://www.rsc.org/images/entities/char_2009.gif) 420
420![[thin space (1/6-em)]](https://www.rsc.org/images/entities/char_2009.gif) 719
719![[thin space (1/6-em)]](https://www.rsc.org/images/entities/char_2009.gif) 487
487

![[thin space (1/6-em)]](https://www.rsc.org/images/entities/char_2009.gif) 484 tetrahedral elements, 6540 triangular elements, 530 edge elements and 24 vertex elements. The mesh passed the mesh independence test, where when the mesh was encrypted or coarsened twice that of the original mesh, the simulation results differed by less than 2%. The configuration of the 3D geometry and mesh is shown in Fig. 5.
484 tetrahedral elements, 6540 triangular elements, 530 edge elements and 24 vertex elements. The mesh passed the mesh independence test, where when the mesh was encrypted or coarsened twice that of the original mesh, the simulation results differed by less than 2%. The configuration of the 3D geometry and mesh is shown in Fig. 5.


![[thin space (1/6-em)]](https://www.rsc.org/images/entities/char_2009.gif) 601
601![[thin space (1/6-em)]](https://www.rsc.org/images/entities/char_2009.gif) 784
784![[thin space (1/6-em)]](https://www.rsc.org/images/entities/char_2009.gif) 387
387


