
 Open Access Article
 This Open Access Article is licensed under a Creative Commons Attribution-Non Commercial 3.0 Unported Licence
Validation of alkaline oxidation as a pre-treatment method for elemental quantification in single-walled carbon nanotubes†
Filipa R. F.
Simoes
a,
Nitin M.
Batra
 a,
Abdul-Hamid
Emwas
b and
Pedro M. F. J.
Costa
*a
a,
Abdul-Hamid
Emwas
b and
Pedro M. F. J.
Costa
*a
aKing Abdullah University of Science and Technology (KAUST), Physical Science and Engineering Division, Thuwal 23955-6900, Saudi Arabia. E-mail: pedro.dacosta@kaust.edu.sa
bKing Abdullah University of Science and Technology (KAUST), Core Labs, Thuwal 23955-6900, Saudi Arabia
First published on 18th February 2019
Abstract
Nanocarbons continue to stimulate the scientific community while their production has also started to reach the industrial scale. With the commercialization of products that are based on materials such as carbon nanotubes (CNTs), it has become imperative to implement reliable quality control protocols for the routine analysis of their chemical composition and structure. Herein, we propose alkaline oxidation (a.k.a., fusion) as a valuable approach to disintegrate the graphitic structure of carbon nanotubes. Using the certified reference material SWCNT-1, it was shown that fusion enables the subsequent determination of elemental concentrations (Ni, Co and Mo) by a routine analytical tool such as inductively coupled plasma optical emission spectroscopy (ICP-OES). Furthermore, the fusion residues were investigated, clarifying that the process does not result in the formation of non-intentional carbon compounds (e.g., carbides or carbonates) or lattice doping (e.g., B doping or Li intercalation).
1. Introduction
The field of carbon science and engineering has seen a “golden era” for the past three decades. However, translating all the laboratory activity into technological developments and consumer goods remains a challenge.1 While this can be understood from a technological life-cycle perspective, key issues such as the lack of appropriate quality control standards and protocols can considerably delay the pace of progress for the large-scale deployment of products based on materials such as carbon nanotubes (CNTs) and graphene.2,3 In fact, CNTs are a good example of how difficult it is to control the production parameters, which can result in non-homogenous structural metrics, morphology, purity and physical properties at batch scales.2 Presently, the most disseminated method to produce CNTs is chemical vapor deposition (CVD).4,5 This is understandable given the decade long tradition and accumulated know-how derived from growing analogous carbon (nano)fibers via CVD.6 Relying heavily on transition-metal catalysts, CVD by-products include metallic nanoparticles encapsulated in carbon shells. These are notoriously difficult to eliminate and may affect the physical properties of the sample.7,8 Even though ‘‘purified’’ CNTs are available commercially, it is sometimes challenging to find trustworthy information regarding the content of metals and/or the lot-to-lot compositional homogeneity.9–12 While this may not constitute a critical issue in applications such as mechanical reinforcement of polymers, in other cases such as electrocatalysis, it can lead to erroneous data interpretation.13Historically, two of the most reliable routine tools to quantify metal elements in CNTs are optical emission spectroscopy (OES) and mass spectrometry (MS).11,14,15 These are commonly associated with inductively coupled plasma (ICP) burners. Prior to the ICP-OES/MS analysis, the carbon material needs to be disintegrated and dispersed in a liquid (a.k.a., sample pre-treatment). Fragmenting the sturdy honeycomb-type lattice of graphitic materials effectively constitutes the critical step in the application of these analytical tools for CNTs and other nanocarbons. Dry ashing (i.e., the combustion of carbon) and wet digestion (through the use of strongly oxidizing liquid reagents, e.g., concentrated nitric acid), or eventually a combination of both, are the most common methods to disintegrate CNTs.16,17
To overcome the shortcomings related to time expenditure and the use of high amounts of reagents, novel approaches in sample pre-treatments, such as the use of microwave systems instead of furnaces, have been developed.15,18 Concurrent with these advances, some of us proposed alkaline oxidation (or “fusion”) as an alternative approach to disintegrate CNTs for ICP-based analyses.8 This treatment is normally applied to samples that are impervious to strong acids. Among these are refractory materials such as carbides19,20 and borides, ceramics,21 mineral ores,22,23 marine sediments24,25 and human bones. The application of fusion to carbon materials was previously limited to coal26 and graphite27 but, in 2016, we used it for CNTs and graphene and compared its elemental quantification results with those obtained from wet digestion.8 Among other advantages, when alkaline oxidation is applied to nanocarbons, it offers a simple two-step procedure (fusion followed by glass-bead dissolution) and avoids the use of concentrated acids and/or peroxides. Furthermore, the mass of flux employed is small, i.e., in the range of tens to hundreds of mg. In our previous work,8 due to the absence of certified reference samples, the results were not conclusive. Hence, we looked into the available standards for CNTs28,29 and found that the certified reference material (CRM) SWCNT-1 produced by the National Research Council Canada (NRC)29 would be a good candidate to validate the reliability of fusion as an ICP-OES/MS sample pre-treatment approach. Here, we re-assert and more importantly validate the applicability of the alkaline oxidation approach as an alternative sample preparation method for the quantitative chemical analysis of CNTs by ICP-OES.
2. Experimental section
(a) Reagents and solutions
The CRM designated SWCNT-1 was procured from the NRC (the certificate of composition is available29). The alkaline salt or flux used was a high-purity mixture containing 66 wt% of lithium tetraborate (Li2B4O7) and 34 wt% of lithium metaborate (LiBO2) (X-ray Flux Type 66:34, XRF Chemicals Pty Ltd, Australia; as per vendor: Co < 1 ppm, Ni < 1 ppm, Mo below detection limit). A releasing agent was employed, consisting of a mixture of 30 wt% ammonium iodide (NH4I) and 70 wt% starch (NH4I tablets, XRF Chemicals Pty Ltd, Australia). Pt/Au crucibles and molds (95/5 wt%, Malvern Panalytical, United Kingdom) were used to hold the powder samples during the fusion process and after melting, respectively. To dissolve the fused materials, a 10% nitric acid (HNO3) solution was prepared from 70% HNO3 (ultrapure grade for trace metal analysis, Aristar Ultra, BDH, Canada) using deionized water (produced with a Milli-Q system from Millipore, UK, and with a resistivity of 18 MΩ cm). Standard stock solutions of single elements from Inorganic Ventures, USA, were used for Co (3 v/v% HNO3), Ni (2 v/v% HNO3) and Mo (in H2O/tr.NH4OH).(b) Fusion procedure
The Pt crucibles and molds were thoroughly washed with a diluted acid solution for one hour and then cleaned with 70% (v/v) ethanol (96% vol, AnalaR NORMAPUR®, VWR International Ltd, United Kingdom). The fusion blank (control sample) was prepared by weighing 100 mg of the flux. In parallel, the SWCNT-1 mixture was prepared by weighing 10 mg of the CRM and 100 mg of the flux (1![[thin space (1/6-em)]](https://www.rsc.org/images/entities/char_2009.gif) :10 ratio) in a Pt crucible and then thoroughly mixing these with a vortex. The two crucibles were taken to the Claisse Eagon2 machine (Malvern Panalytical), which was operated under the optimized parameters listed in Table S1 (in ESI†). Upon cooling, two fused beads (blank and SWCNT-1 mixture) were obtained. Each of these was dissolved in 20 mL of a 10% HNO3 solution and heated for 20 minutes at 130 °C (this temperature is slightly above the boiling point of HNO3 and is used to assist in the dissolution of the glass-beads). Finally, the resulting transparent solutions were transferred to 50 mL vials and ICP-OES analysis was carried out.
:10 ratio) in a Pt crucible and then thoroughly mixing these with a vortex. The two crucibles were taken to the Claisse Eagon2 machine (Malvern Panalytical), which was operated under the optimized parameters listed in Table S1 (in ESI†). Upon cooling, two fused beads (blank and SWCNT-1 mixture) were obtained. Each of these was dissolved in 20 mL of a 10% HNO3 solution and heated for 20 minutes at 130 °C (this temperature is slightly above the boiling point of HNO3 and is used to assist in the dissolution of the glass-beads). Finally, the resulting transparent solutions were transferred to 50 mL vials and ICP-OES analysis was carried out.
(c) ICP-OES analysis
For the ICP-OES analysis, a Varian 720-ES spectrometer bearing a dual detector assembly and covering a wavelength window between 165 nm and 782 nm was employed. The ICP-OES parameters are shown in Table 1.| RF power | 1.2 kW |
| Plasma Ar gas flow | 16 L min−1 |
| Auxiliary Ar gas flow | 1.5 L min−1 |
| Nebulizer gas flow | 0.7 L min−1 |
| Sample uptake rate | 1 mL min−1 |
| Sample rinse time | 50 s |
| Sample pump rate | 15 rpm |
| Stabilization delay | 10 s |
The ICP-OES calibration was carried out with single-element solutions of Co, Ni and Mo at concentrations of 1, 5 and 10 mg L−1. All were derived from the respective 1000 ppm single-element standards. A quality control sample (10 mg L−1) and continuing calibration verification (5 mg L−1) solutions were also prepared in order to check the instrument performance and ensure that its precision was not degrading over the period of the analysis.
(d) General characterization
SWCNT-1 was characterized as-received and after the fusion treatment. For the characterization with transmission electron microscopy (TEM), Raman spectroscopy and solid-state nuclear magnetic resonance (SS-NMR), the glass-like fused material had to be shattered first with a manual press and subsequently, it was ground into a fine powder with an agate pestle and mortar.Transmission electron microscopy (TEM) imaging was generally performed on an FEI TECNAI G2 Spirit TWIN microscope at 120 kV. Further imaging and energy dispersive X-ray spectroscopy (EDS) were carried out in FEI Titan SuperTWIN operated at 300 kV and incorporating an EDAX octane silicon drift detector. To prepare the TEM sample, 1 mg of the as-received SWCNT-1 (or the grinded SWCNT-1 mixture bead) was dispersed in ethanol and drop-casted onto a Holey carbon metal grid (Au or Cu) and then dried in a vacuum oven at 70 °C.
The Raman analysis was done in a WITec Alpha 300RA system with a 532 nm laser and a UHT300 spectrometer. The powdered samples (i.e., the as-received flux and the SWCNT-1) were placed in a silicon wafer and flat-pressed, while the fusion beads were ground with an agate pestle and mortar until they became powder and transferred to the wafer. The OriginPro software was used to plot and process the Raman spectra.
The SS-NMR studies were performed on a Bruker 400 MHz AVANACIII spectrometer equipped with a 4 mm BBO magic angle spinning (MAS) probe (BrukerBioSpin, Germany). To spin a conductive material such as CNTs, the as-received SWCNT-1 was mixed and finely ground with KBr, then packed evenly into a 4 mm zirconia rotor and finally sealed at the open end with a Vespel cap. The 13C NMR spectra were all recorded under the same instrumental parameters and conditions at 12 kHz spinning rate and using one pulse program with 30 degrees flipping angle with a recycle delay time of 10 s. In addition to C, Li and B were probed with SS-NMR. The 7Li and 11B spectra were obtained with 14 kHz spinning rate using 90° one pulse program with recycle delays of 2 s and 3 s, respectively. The Bruker Topspin 3.2 software (Bruker BioSpin, Germany) was used to collect and process the raw data. The OriginPro software was used to plot the figures.
The CHN analysis was performed in a Thermo Scientific Flash 2000 Organic Elemental Analyzer, where combustion occurred for 7 s under an oxygen flow of 300 mL min−1 and a constant He flow of 140 mL min−1.
3. Results and discussion
Two transition metal catalysts, namely, Co and Ni were used to produce SWCNT-1, while a Mo stub supported the pressed laser-ablation targets.29 As mentioned above, the identification of carbon-encapsulated catalyst particles is a common occurrence in as-produced CNTs by CVD. Similar by-products were also found in the synthesis of single-walled carbon nanotubes (SWCNTs) by laser ablation.29 The TEM micrographs in Fig. 1a and b show that the as-received SWCNT-1 primarily consists of SWCNT bundles, agglomerates of amorphous carbon and catalyst nanoparticles. The presence of a graphitic coating on the latter was confirmed with high-resolution TEM (not shown). The diameters of the nanotubes and particles were 1.2 (±0.1) nm and between 3 and 25 nm, respectively. The localized elemental survey performed with EDS confirmed the presence of Fe, Co, Ni and Mo (Fig. 1c). As disclosed by NRC, these are elements with certified mass fractions.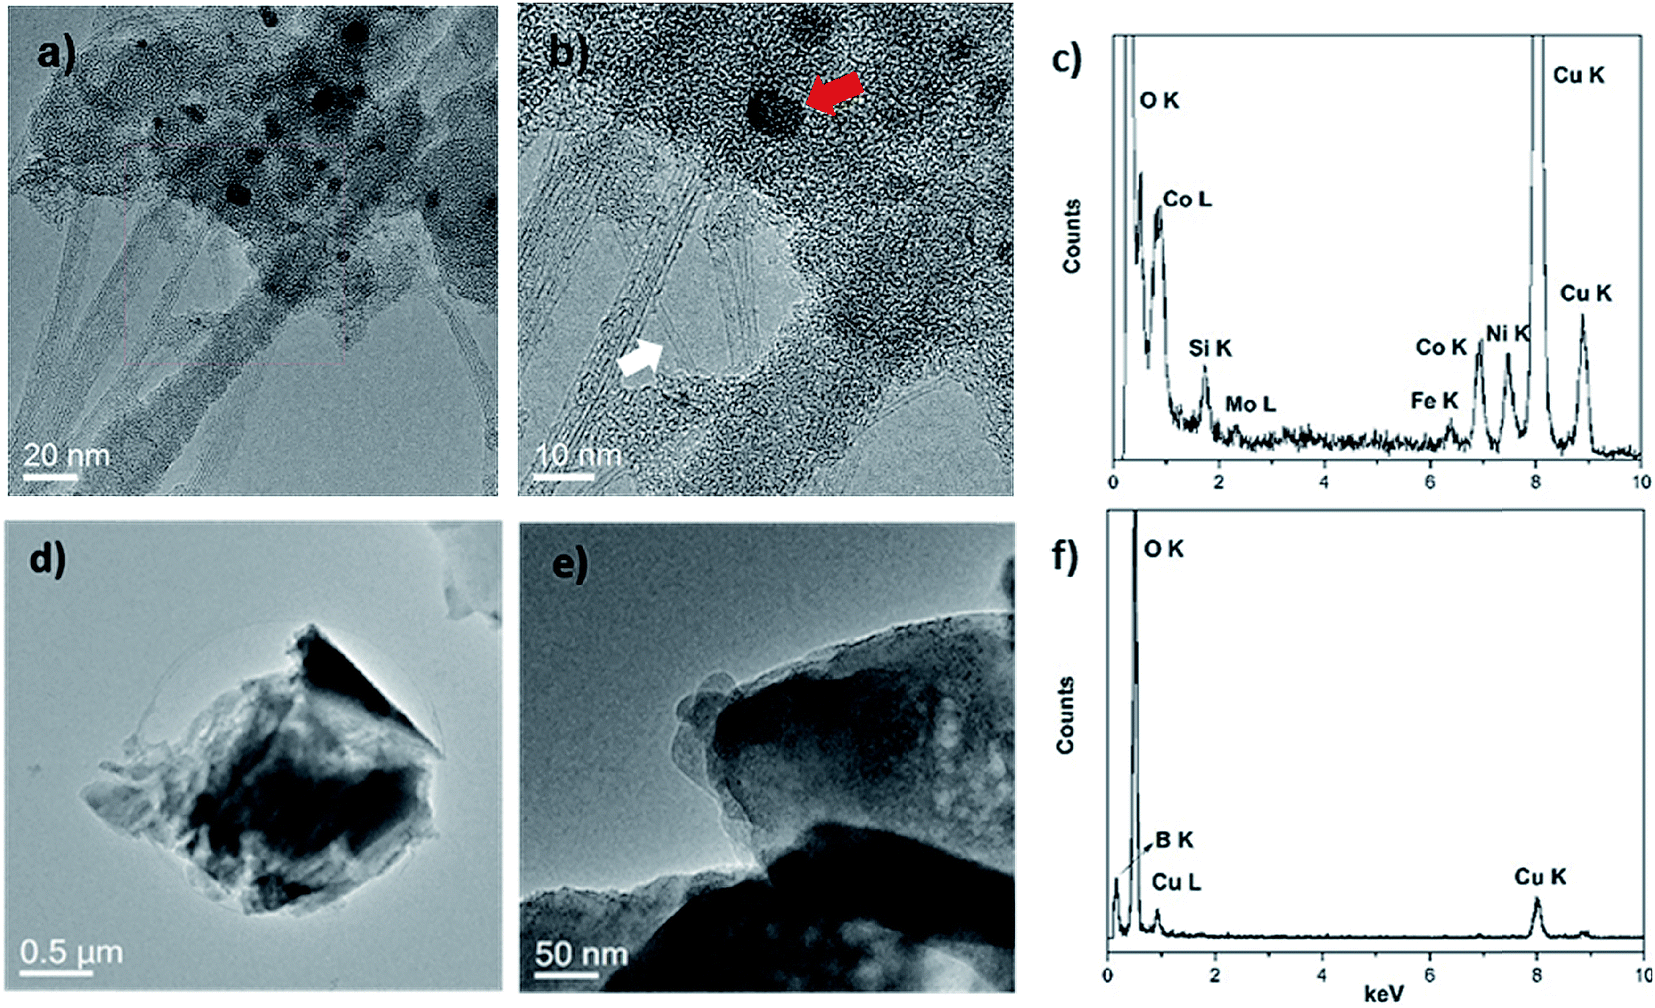 | ||
| Fig. 1 (a and b) TEM micrographs of the as-received SWCNT-1, where the white arrow points to a single nanotube, while the red arrow marks a catalyst particle; (c) EDS of the sample in (a); (d and e) TEM micrographs of a typical aggregate found in the fusion residues of the SWCNT-1 mixture; (f) EDS of (d). Please note that the Si and Cu peaks in the spectra of (c) and (f) originate from the sample grid. | ||
When the fusion procedure was used, the powder samples (flux and SWCNT-1 mixture) transformed into glass-like beads. Another visible effect was the color change. While the bead of the flux itself (blank) was transparent, that of the SWCNT-1 mixture exhibited a dark-blue hue (Fig. S1†). This color may originate from the formation of transition metal oxides: tetrahedral Co2+ complexes are a known ceramic colorant (e.g., cobalt blue).30 After crushing the SWCNT-1 mixture beads and reducing them to a powder, it was possible to identify and characterize minute amounts of ash. When imaged with TEM, both SWCNTs and catalyst nanoparticles were conspicuously absent, but sub-micron aggregates with no crystalline order were often observed (Fig. 1d and e). The EDS elemental survey performed on these aggregates could not identify the presence of C, Fe, Co, Ni or Mo. However, B and O were very prominent, certainly originating from the borate salt mixture (Fig. 1f). The absence of a C peak was explained by the localized nature of the EDS analysis and the much larger mass of fused flux present after the oxidation of carbon (the sample flux exhibited a 1:10 mass ratio of carbon-to-salt). In fact, this was evident when elemental (CHN) analysis was used to quantify the content of carbon in the as-received SWCNT-1 and respective fusion residues. Initially, C represented 90 wt% of the sample, a value that agrees well with the thermogravimetric data presented in the NRC certificate.29 The same analysis when performed in the residues provided values of <1 wt%, thereby confirming the almost complete combustion of various carbonaceous species.
To provide a more reliable overview of the flux and SWCNT-1 mixture in both their pre- and post-fusion states, less-localized means of characterization than TEM were employed. In particular, possible structural changes induced by the fusion process were evaluated with Raman spectroscopy and SS-NMR. The Raman analysis of the flux showed some variations in the pre- and post-fusion states (Fig. S2†). These were in good agreement with previously reported results31 and reflected the crystalline-to-amorphous structural changes that the salt undergoes with melting. As for SWCNT-1, the spectrum of the as-received SWCNT-1 showed intense peaks with maxima at 178 cm−1, 1582 cm−1 and 2650 cm−1 (Fig. 2a); these correspond to the characteristic normal modes of vibration for SWCNTs, i.e., the radial breathing mode (RBM), the tangential mode (G-band) and the second order harmonic of the D-mode (2D-band). Despite slight variation in the laser energy used when compared with that of the NRC certificate (532 nm versus 514 nm), the spectral agreement was clear.29 Following the fusion process, the Raman analysis of the SWCNT-1 mixture residues showed significantly changed spectra (Fig. 2b and S3†). First, and in contrast to the localized TEM and EDS probing, it was possible to identify the presence of solid carbon. Second, despite the higher noise level justified by the much smaller content of carbon present, RBM was absent but both the D- (1348 cm−1) and the G- (1585 cm−1) bands were visible. The D-band, which was practically absent in the spectrum of the as-received SWCNT-1 and commonly associated with sp3-type carbons,32,33 is very prominent in all post-fusion spectra. While the spectrum in Fig. 2b can be interpreted as the fingerprint of a glass-like carbon material, the variability of the spectral signatures in the different locations probed (cf. Fig. S3†) implies that different types of carbon nanotextures co-exist in the residues. Still, it is clear that the radial symmetry of the carbon nanotubes was eliminated.
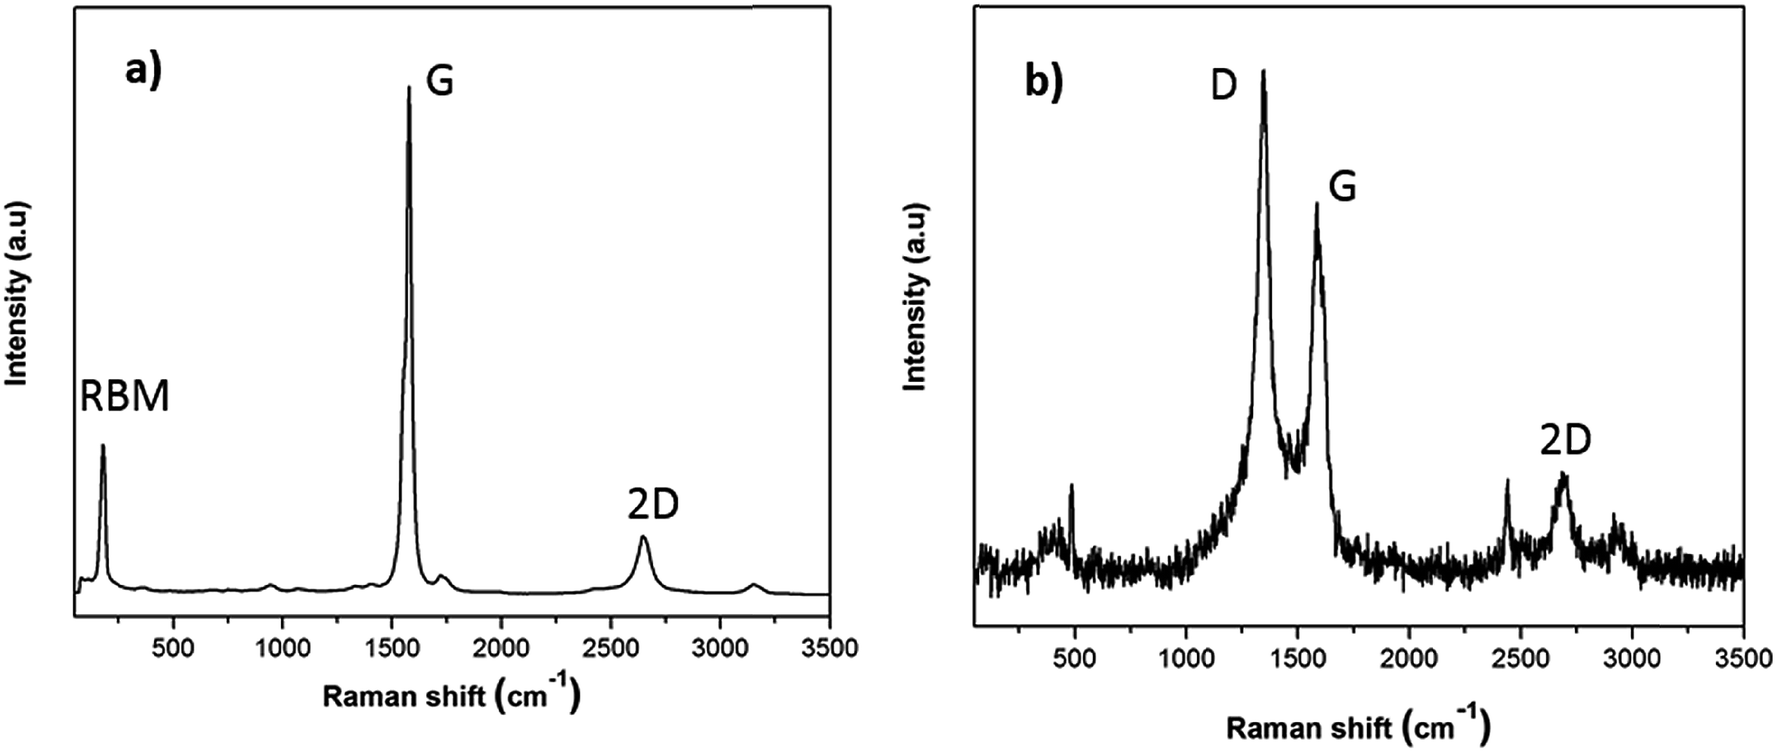 | ||
| Fig. 2 Raman spectra of (a) as-received SWCNT-1 and (b) fusion residues of the SWCNT-1/salt mixture. | ||
Following the Raman analysis, SS-NMR was performed using different nuclei: 7Li, 11B and 13C. As seen in Fig. S4,† the flux (alkaline salt) undergoes a rearrangement of the BO3 units, a phenomenon expected at high temperatures. As for the SWCNT-1 mixture, the 13C SS-MAS NMR analysis is shown in Fig. 3a and b. In both spectra, the same single peak is present albeit with slightly changed chemical shifts: at 121.6 ppm for the as-received SWCNT-1 (pre-fusion) and at 112.5 ppm for the SWCNT-1 mixture residues (post-fusion). This peak can be assigned to the C![[double bond, length as m-dash]](https://www.rsc.org/images/entities/char_e001.gif) C bond characteristic of the SWCNT lattice. The position of the peak in the spectrum of the as-received SWCNT-1 is consistent with the reported chemical shift of semiconducting SWCNTs,34 the additional down-field shoulder attributed to metallic 13C resonance. As for the SWCNT-1 mixture residues, there is a noticeable broadening of the equivalent peak. This observation can be explained by the overlap of chemical shift anisotropy as the post-fusion sample is expectedly composed of a much more fragmented and disordered collection of carbon particles. Furthermore, the up-field shift indicates the presence of a less electrically conductive sample. Altogether, the SS-NMR analysis concurs with the Raman spectroscopy analysis by proposing the presence of different types of carbon textures in the residues.
C bond characteristic of the SWCNT lattice. The position of the peak in the spectrum of the as-received SWCNT-1 is consistent with the reported chemical shift of semiconducting SWCNTs,34 the additional down-field shoulder attributed to metallic 13C resonance. As for the SWCNT-1 mixture residues, there is a noticeable broadening of the equivalent peak. This observation can be explained by the overlap of chemical shift anisotropy as the post-fusion sample is expectedly composed of a much more fragmented and disordered collection of carbon particles. Furthermore, the up-field shift indicates the presence of a less electrically conductive sample. Altogether, the SS-NMR analysis concurs with the Raman spectroscopy analysis by proposing the presence of different types of carbon textures in the residues.
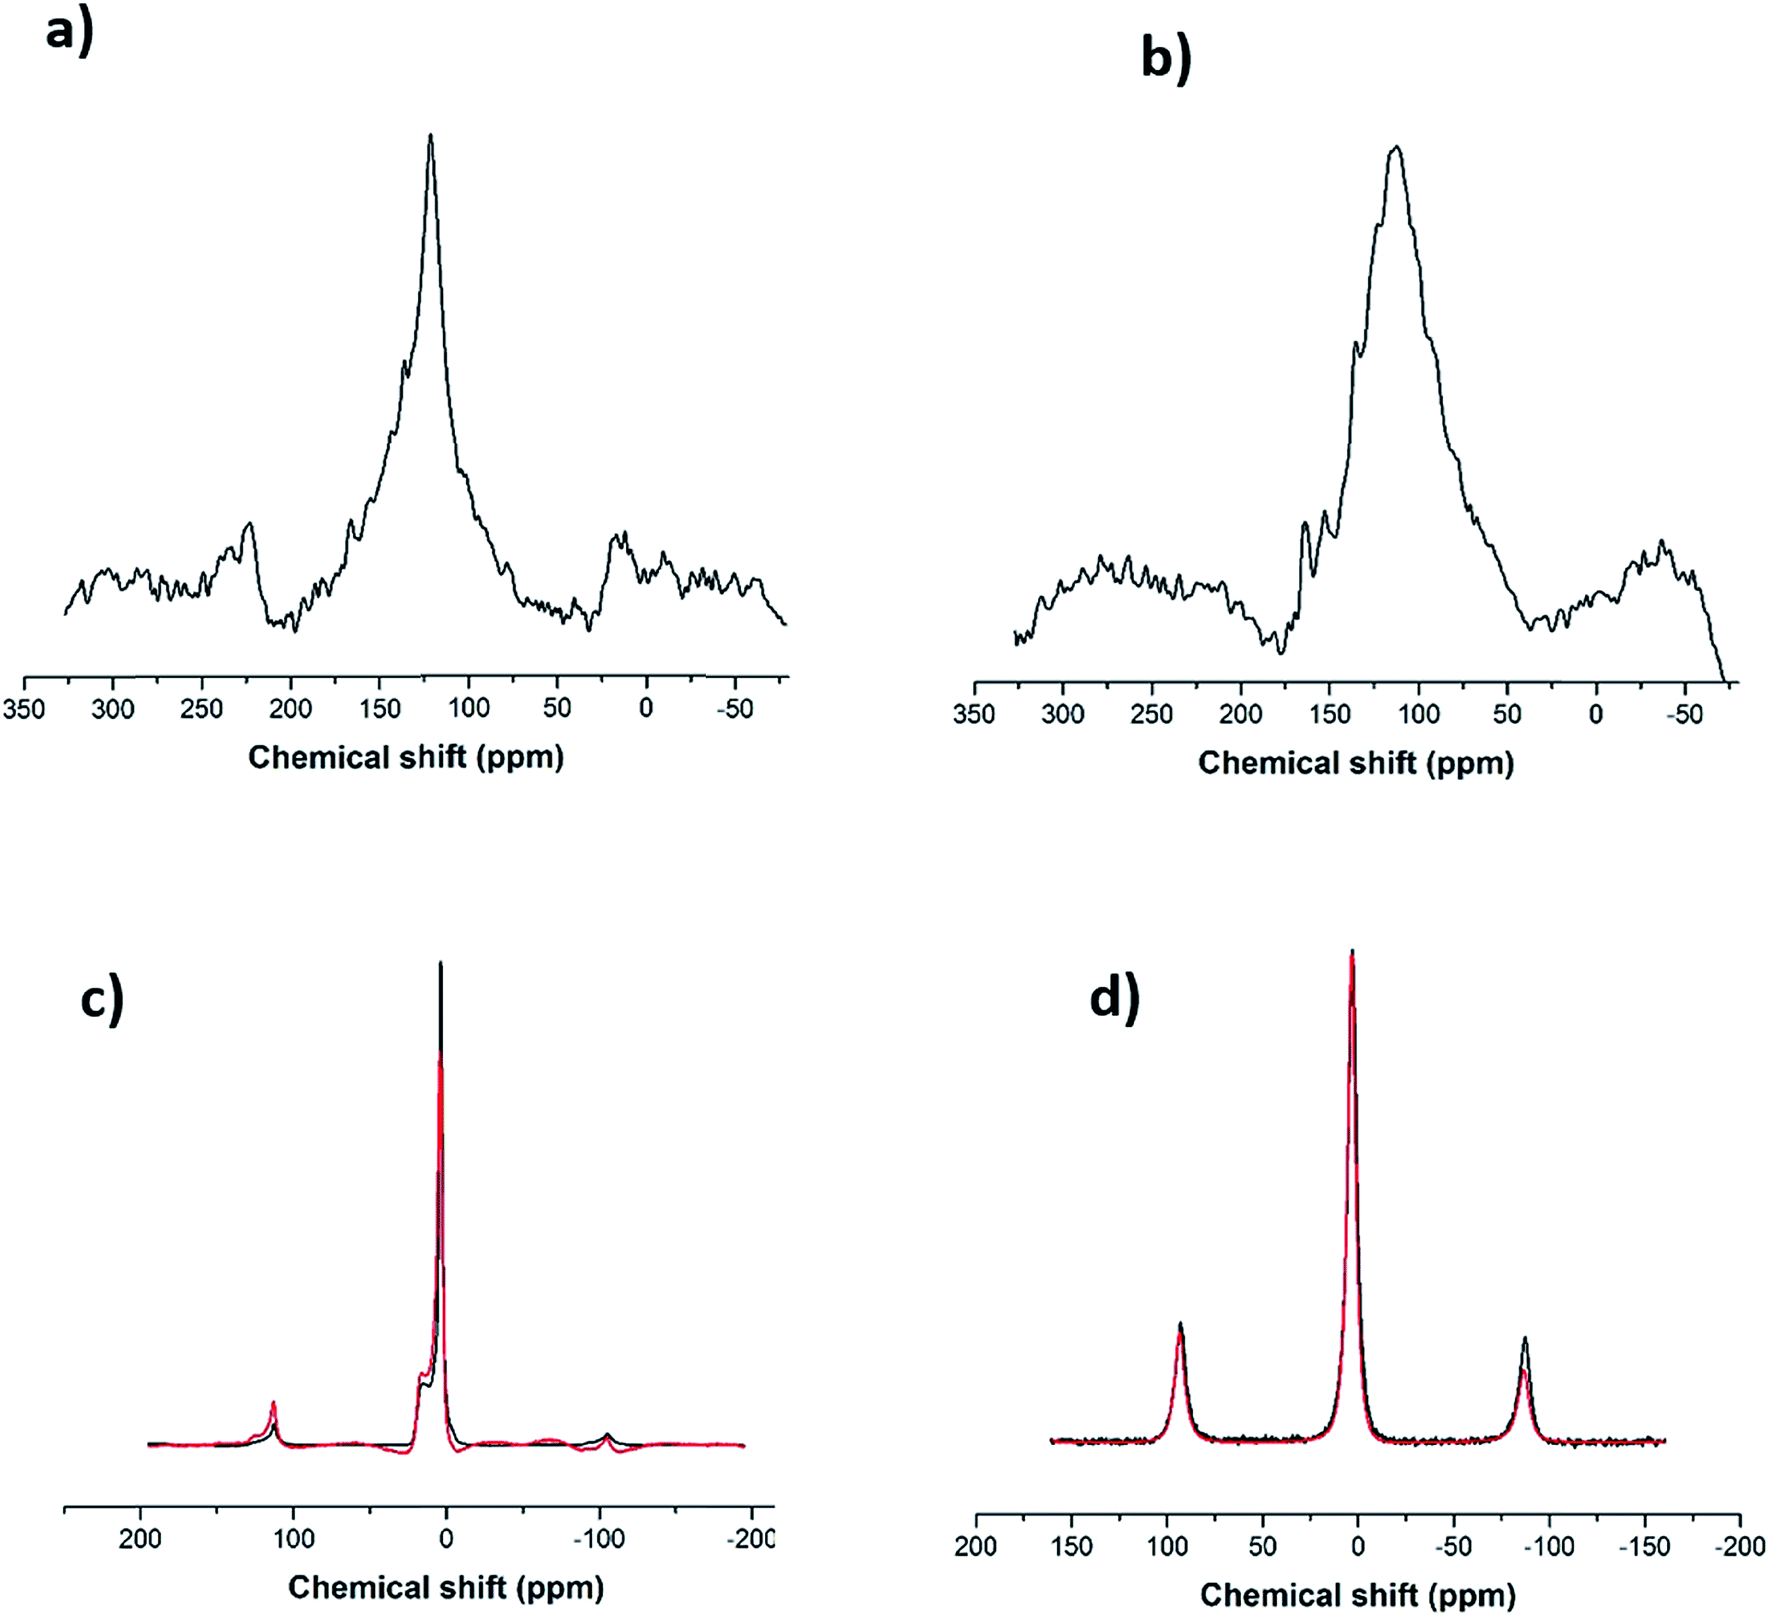 | ||
| Fig. 3 (a) 13C SS-NMR spectrum for the as-received SWCNT-1 (the smaller peaks at ∼25 and ∼225 ppm are spinning side-bands), (b) 13C SS-NMR spectrum for the SWCNT-1 mixture residues, (c) 11B SS-NMR spectra for the fused salt (black line) and the SWCNT-1 mixture residues (red line), (d) 7Li SS-NMR spectra for the fused salt (black line) and the SWCNT-1 mixture residues (red line). | ||
In order to investigate the interaction between the alkaline salt (mainly composed of boron and lithium) and the carbon nanotubes, SS-NMR analysis was carried out using the nuclei 11B and 7Li. After comparing the 11B spectrum of the fused flux (Fig. 3c, black line) with the corresponding one from the SWCNT-1 mixture (Fig. 3c, red line), it is evident that the profiles are identical. According to the literature,35,36 it can be inferred that the two resonances obtained with chemical shifts of 3 ppm and 15 ppm are due to BO4− and BO3 species. This indicates that the salt is inert, there are no chemical bonds with carbon, and boron is not doping the carbon lattice. In the case of the 7Li spectra (Fig. 3d), only one chemical environment was identified at 3 ppm. Moreover, the fused spectra were identical for the flux and SWCNT-1 mixture, providing further evidence of the chemical inertness of the salt and the absence of intercalation as well as carbides, carbonates or other carbon-containing species.
After the fusion procedure and subsequent dilution of fused fluxes (blanks) and respective SWCNT-1 mixtures, ICP-OES was used to quantify the three transition metals known to be present in higher concentrations in SWCNT-1: Co, Ni and Mo. The results are summarized in Fig. 4 alongside the corresponding NRC-certified concentrations. Six replicas were studied, which yielded average concentrations (in mg L−1) and standard deviations of 13116 ± 316 for Co, 11972 ± 460 for Ni, and 6253 ± 171 for Mo; these values correspond to average recoveries of 82%, 83% and 86% and are within the acceptable range when working with a CRM.37
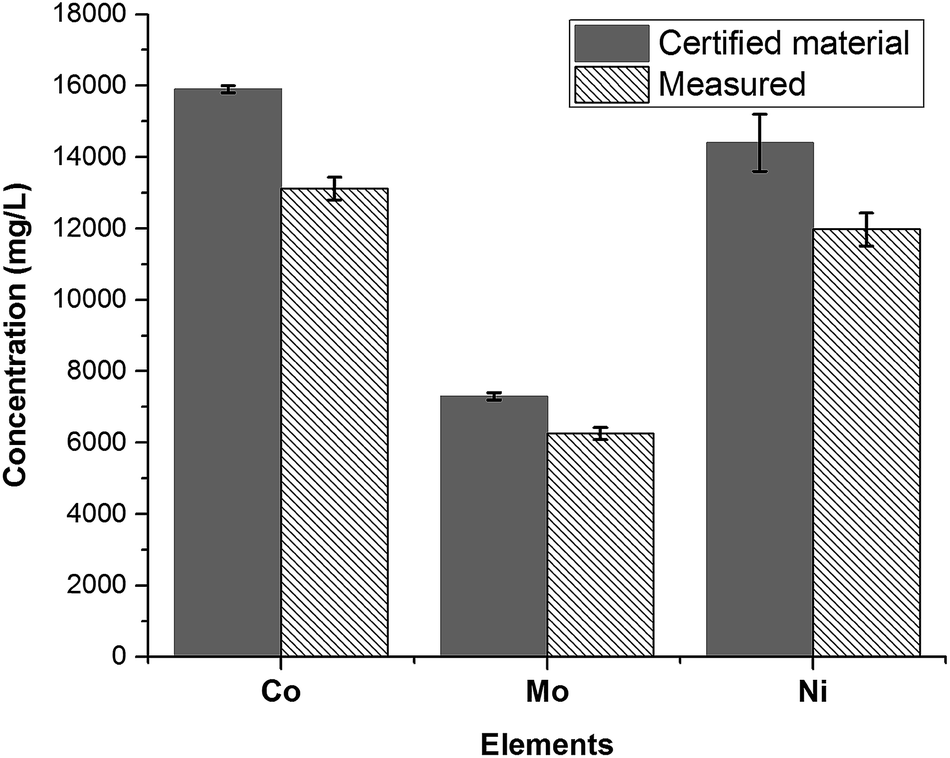 | ||
| Fig. 4 Concentrations of the most abundant transition metals in SWCNT-1, following a fusion pre-treatment step and measured by ICP-OES (N = 6). | ||
4. Conclusions
Alkaline oxidation was successfully validated as an alternative approach to wet digestion and ashing to prepare SWCNT materials for ICP-OES analysis. The post-fusion residues of SWCNT-1 were analyzed using TEM and Raman and NMR spectroscopies, confirming the structural disintegration of the nanotubes. The concentration levels determined for the transition metals Co, Ni and Mo agreed well with the certified mass fractions provided in the SWCNT-1 certificate of analysis, indicating recovery levels more than 80%. With further optimization and attending to variables such as flux composition and fusion dwell times, it should be possible to progress to higher recoveries. Finally, we believe that this approach can be used for other nanocarbons as these have also been successfully digested through alkaline oxidation.8 If appropriate levels of recovery are confirmed for these materials, then, the present work will have paved the way for a safer, less time consuming and more universal ICP-OES sample preparation approach for carbon materials.5. Disclaimer
A patent application has been filed under the Patent Cooperative Treaty (PCT/IB2016/051191).Conflicts of interest
There are no conflicts to declare.Acknowledgements
KAUST is acknowledged for funding (URF/1/2980-01-01). The technical advice from Christian Canlas, from the Core Labs at KAUST is appreciated, as well as the graphical abstract contribution from Xavier Pita, scientific illustrator at KAUST.Bibliography
- R. H. Baughman, A. A. Zakhidov and W. A. de Heer, Carbon Nanotubes-the Route Toward Applications, Science, 2002, 297, 787–792 CrossRef CAS PubMed.
- A. Jorio, G. M. Dresselhaus and M. S. Dresselhaus, Carbon Nanotubes: Advanced Topics in the Synthesis, Structure, Properties and Applications, Springer: Verlag Berlin Heidelberg, 2008, vol. 111 Search PubMed.
- A. Jorio, Raman Spectroscopy in Graphene-Based Systems: Prototypes for Nanoscience and Nanometrology, ISRN Nanotechnol., 2012, 1–16 Search PubMed.
- Q. Zhang, J. Q. Huang, W. Z. Qian, Y. Y. Zhang and F. Wei, The road for nanomaterials industry: a review of carbon nanotube production, post-treatment, and bulk applications for composites and energy storage, Small, 2013, 9(8), 1237–1265 CrossRef CAS PubMed.
- N. M. Mubarak, E. C. Abdullah, N. S. Jayakumar and J. N. Sahu, An overview on methods for the production of carbon nanotubes, J. Ind. Eng. Chem., 2014, 20(4), 1186–1197 CrossRef CAS.
- M. Inagaki and F. Kang, Materials science and engineering of carbon: fundamentals, Butterworth-Heinemann, 2014 Search PubMed.
- L. Zhang, D.-M. Sun, P.-X. Hou, C. Liu, T. Liu, J. Wen, N. Tang, J. Luan, C. Shi, J.-C. Li, H.-T. Cong and H.-M. Cheng, Selective Growth of Metal-Free Metallic and Semiconducting Single-Wall Carbon Nanotubes, Adv. Mater., 2017, 29, 9 Search PubMed.
- S. Patole, F. Simões, T. F. Yapici, B. H. Warsama, D. H. Anjum and P. M. F. J. Costa, An evaluation of microwave-assisted fusion and microwave-assisted acid digestion methods for determining elemental impurities in carbon nanostructures using inductively coupled plasma optical emission spectrometry, Talanta, 2016, 148, 94–100 CrossRef CAS PubMed.
- K. X. Yang, M. E. Kitto, J. P. Orsini, K. Swami and S. E. Beach, Evaluation of sample pretreatment methods for multiwalled and single-walled carbon nanotubes for the determination of metal impurities by ICPMS, ICPOES, and instrument neutron activation analysis, J. Anal. At. Spectrom., 2010, 25(8), 1290 RSC.
- L. Ayouni-Derouiche, M. Méjean, P. Gay, M.-L. Milliand, P. Lantéri, L. Gauthier and E. Flahaut, Development of efficient digestion procedures for quantitative determination of cobalt and molybdenum catalyst residues in carbon nanotubes, Carbon, 2014, 80, 59–67 CrossRef CAS.
- E. I. Braun and P. Pantano, The importance of an extensive elemental analysis of single-walled carbon nanotube soot, Carbon, 2014, 77, 912–919 CrossRef CAS PubMed.
- M. Pumera, A. Ambrosi and E. L. K. Chng, Impurities in graphenes and carbon nanotubes and their influence on the redox properties, Chem. Sci., 2012, 3(12), 3347–3355 RSC.
- V. Mazánek, J. Luxa, S. Matějková, J. Kučera, D. Sedmidubský, M. Pumera and Z. Sofer, Ultrapure Graphene Is a Poor Electrocatalyst: Definitive Proof of the Key Role of Metallic Impurities in Graphene-Based Electrocatalysis, ACS Nano, 2019, 13(2), 1574–1582 Search PubMed.
- P. Grinberg, R. E. Sturgeon, L. d. O. Diehl, C. A. Bizzi and E. M. M. Flores, Comparison of sample digestion techniques for the determination of trace and residual catalyst metal content in single-wall carbon nanotubes by inductively coupled plasma mass spectrometry, Spectrochim. Acta, Part B, 2015, 105, 89–94 CrossRef CAS.
- R. S. Mortari, R. C. Cocco, R. F. Bartz, L. V. Dresssler and M. E. Flores de Morais, Fast Digestion Procedure for Determination of Catalyst Residues in La- and Ni-Based Carbon Nanotubes, Anal. Chem., 2010, 82(10), 4298–4303 CrossRef PubMed.
- C. Ge, F. Lao, W. Li, Y. Li, C. Chen, Y. Qiu, X. Mao, B. Li, Z. Chai and Y. Zhao, Quantitative analysis of metal impurities in carbon nanotubes: efficacy of different pretreatment protocols for ICPMS spectroscopy, Anal. Chem., 2008, 80, 9426–9434 CrossRef CAS PubMed.
- E. I. Müller, M. F. Mesko, D. P. Moraes, M. d. G. A. Korn and É. M. M. Flores, Chapter 4 – Wet Digestion Using Microwave Heating, in Microwave-Assisted Sample Preparation for Trace Element Analysis, ed. É. M. d. M. Flores, Elsevier, Amsterdam, 2014, pp. 99–142 Search PubMed.
- F. R. Simoes, N. K. Batra, B. H. Warsama, C. G. Canlas, S. P. Patole, T. F. Yapici and P. M. Costa, Elemental Quantification and Residues Characterisation of Wet Digested Certified and Commercial Carbon Materials, Anal. Chem., 2016, 11783–11790 CrossRef CAS PubMed.
- F. Claisse, Fusion and fluxes. 2003, vol. 41, pp. 301–311 Search PubMed.
- U. Schaffer and V. Krivan, Multielement Analysis of Graphite and Silicon Carbide by Inductively Coupled Plasma Atomic Emission Spectrometry Using Solid Sampling and Electrothermal Vaporization, Anal. Chem., 1999, 71(4), 849–854 CrossRef.
- A. Tsolakidou, B. J. Garrigós and V. Kilikoglou, Assessment of dissolution techniques for the analysis of ceramic samples by plasma spectrometry, Anal. Chim. Acta, 2002, 474, 177–188 CrossRef CAS.
- S. Awaji, K. Nakamura, T. Nozaki and Y. Kato, A Simple Method for Precise Determination of 23 Trace Elements in Granitic Rocks by ICP-MS after Lithium Tetraborate Fusion, Resour. Geol., 2006, 56(4), 471–478 CrossRef CAS.
- P. J. Potts and P. Robinson, Chapter 24 – Sample preparation of geological samples, soils and sediments, in Sample Preparation for Trace Element Analysis, ed. Z. S. R. Mester, Elsevier Amsterdam, 2003, vol. 41, pp. 723–763 Search PubMed.
- S. Huang, R. E. Sholkovitz and H. M. Conte, Application of high-temperature fusion for analysis of major and trace elements in marine sediment trap samples, Limnol. Oceanogr.: Methods, 2007, 5, 13–22 CrossRef CAS.
- J. Yoshinaga, A. Nakama and K. Takata, Determination of total tin in sediment reference materials by isotope dilution inductively coupled plasma mass spectrometry after alkali fusion, Analyst, 1999, 124, 257–261 RSC.
- R. A. Wood, L. S. Dale and K. W. Riley, A borate fusion method for the determination of fluorine in coal, Fuel, 2003, 82(13), 1587–1590 CrossRef CAS.
- S. Thangavel, K. Dash, S. M. Dhavile and A. C. Sahayam, Determination of trace levels of boron in graphite powder by inductively coupled plasma-optical emission spectrometry (ICP-OES), Anal. Methods, 2013, 5(20), 5799–5803 RSC.
- K. Eric, C. Lin, R. L. Watters and J. Chief, Certificate of Analysis Standard Reference Material 2483 Single-Wall Carbon Nanotubes (Raw Soot), National Institute of Standards & Technology, Department of Commerce, USA, 2011 Search PubMed.
- Z. Mester, Certificate of Analysis, SWCNT-1 Single-Wall Carbon Nanotubes Certified Reference Material, National Research Council (NRC), Ottawa, Canada, June 2013 Search PubMed.
- X. He, F. Wang, H. Liu, L. Niu and X. Wang, Synthesis and color properties of the TiO2@CoAl2O4 blue pigments with low cobalt content applied in ceramic glaze, J. Am. Ceram. Soc., 2018, 101(6), 2578–2588 CrossRef CAS.
- M. Loubser, Chemical and physical aspects of lithium borate fusion, December 2009 Search PubMed.
- A. C. Ferrari and J. Robertson, Raman Spectroscopy in Carbons: From Nanotubes to Diamond: Papers of a Theme Issue, Royal Society, 2004 Search PubMed.
- M. S. Dresselhaus, A. Jorio, M. Hofmann, G. Dresselhaus and R. Saito, Perspectives on Carbon Nanotubes and Graphene Raman Spectroscopy, Nano Lett., 2010, 10(3), 751–758 CrossRef CAS PubMed.
- C. Engtrakul, M. F. Davis, K. Mistry, B. A. Larsen, A. C. Dillon, M. J. Heben and J. L. Blackburn, Solid-State 13C NMR Assignment of Carbon Resonances on Metallic and Semiconducting Single-Walled Carbon Nanotubes, J. Am. Chem. Soc., 2010, 132, 9956–9957 CrossRef CAS PubMed.
- V. Montouillout, H. Fan, L. del Campo, S. Ory, A. Rakhmatullin, F. Fayon and M. Malki, Ionic conductivity of lithium borate glasses and local structure probed by high resolution solid-sate NMR, J. Non-Cryst. Solids, 2018, 484, 57–64 CrossRef CAS.
- A. Ananthanarayanan, G. P. Kothiyal, L. Montagne and B. Revel, MAS-NMR investigations of the crystallization behaviour of lithium aluminum silicate (LAS) glasses containing P2O5 and TiO2 nucleants, J. Solid State Chem., 2010, 183(6), 1416–1422 CrossRef CAS.
- H. Rüdel, J. Kösters and J. Schörmann, Determination of the Elemental Content of Environment Samples using ICP-OES Guidelines for Chemical Analysis, 2007 Search PubMed.
Footnote |
| † Electronic supplementary information (ESI) available. See DOI: 10.1039/c8ay02213e |
| This journal is © The Royal Society of Chemistry 2019 |