Micro free flow electrophoresis
Alexander C.
Johnson
and
Michael T.
Bowser
 *
*
Department of Chemistry, University of Minnesota, 207 Pleasant Street SE, Minneapolis, MN 55455, USA. E-mail: bowser@umn.edu
First published on 17th October 2017
Abstract
Micro free-flow electrophoresis (μFFE) is a continuous separation technique in which analytes are streamed through a perpendicularly applied electric field in a planar separation channel. Analyte streams are deflected laterally based on their electrophoretic mobilities as they flow through the separation channel. A number of μFFE separation modes have been demonstrated, including free zone (FZ), micellar electrokinetic chromatography (MEKC), isoelectric focusing (IEF) and isotachophoresis (ITP). Approximately 60 articles have been published since the first μFFE device was fabricated in 1994. We anticipate that recent advances in device design, detection, and fabrication, will allow μFFE to be applied to a much wider range of applications. Applications particularly well suited for μFFE analysis include continuous, real time monitoring and microscale purifications.
Introduction
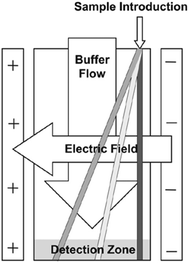
Free flow electrophoresis (FFE) was introduced by Barrollier et al., and later Hannig, almost 60 years ago.1,2 A continuous sample stream is introduced into buffer flowing through a planar separation channel.3–5 An electric field is applied perpendicularly to the buffer flow, separating streams in space according to analyte size and charge (see Fig. 1). Electrodes are isolated from of the channel using ion-permeable membranes to prevent electrolysis bubbles from interfering with the separation. Sample introduction, separation and collection are performed continuously. Analytes are separated spatially rather than in time. The continuous nature of FFE makes the separation technique particularly well suited for preparative scale fractionation and purification of biomolecules.5 FFE has been demonstrated using a number of electrophoresis modes including zone electrophoresis (ZE), isotachophoresis (ITP), isoelectric focusing (IEF), and micellar electrokinetic chromatography (MEKC).4,6,7Preparative scale FFE does present a number of challenges. The relatively large dimensions of the separation channel results in significant current, which in turn leads to significant Joule heating and electrolysis, even at low potentials.4,8 Laminar flow must be maintained to achieve predictable analyte streams. Careful control of separation channel depth and buffer flow is therefore necessary. The scale of FFE separations makes online detection methods challenging. Instead, offline UV absorbance analysis of collected fractions is usually performed. This can be time consuming since 90 or more fractions are commonly collected. These challenges make FFE an attractive candidate for miniaturization into a micro free flow electrophoresis (μFFE) system. Operating on the microscale increases surface area to volume ratios which improves heat dissipation, shortens separation times, minimizes buffer and sample volumes, promotes consistent laminar flow, facilitates on device detection, and lends itself to integration with other microfluidic techniques for a total analysis system.9
Raymond et al. were the first to successfully fabricate a μFFE device in 1994.10 The device significantly reduced Joule heating while incorporating on device, real time detection of analyte streams. The device was limited to ≤75 V due to the electrical breakdown potential of the silicon substrate used for fabrication.10 Since then a number of groups have continued to optimize μFFE through improved fabrication methods and instrument designs. The introduction of novel applications has increased as the performance and reliability of μFFE has improved. In the current manuscript we review the state of the μFFE field, critically assessing separation fundamentals and theory, fabrication strategies and unique applications.
Fabrication and design
Fabrication substrates
Raymond et al. fabricated their initial μFFE device in a silicon substrate to leverage existing micromachining techniques developed in the electronics industry.10 However, silicon is not an ideal substrate for μFFE due to its low electric breakdown potential, which in turn limits the separation potential that can be applied. Silicon subtrates were therefore quickly replaced in favor of more suitable materials such as poly(dimethylsiloxane) (PDMS),11–14 glass,15–18 polystyrene,19 and various rigid polymers.20–22 When choosing a fabrication strategy, it is important to consider challenges that are unique to μFFE. For example, the aspect ratio of the open separation channel is much higher than normally encountered in microfluidic devices. Eliminating electrolysis bubbles generated at electrodes also presents a significant design challenge. Fig. 2 shows images of a number of μFFE devices reported in the literature, demonstrating various design approaches to address these challenges.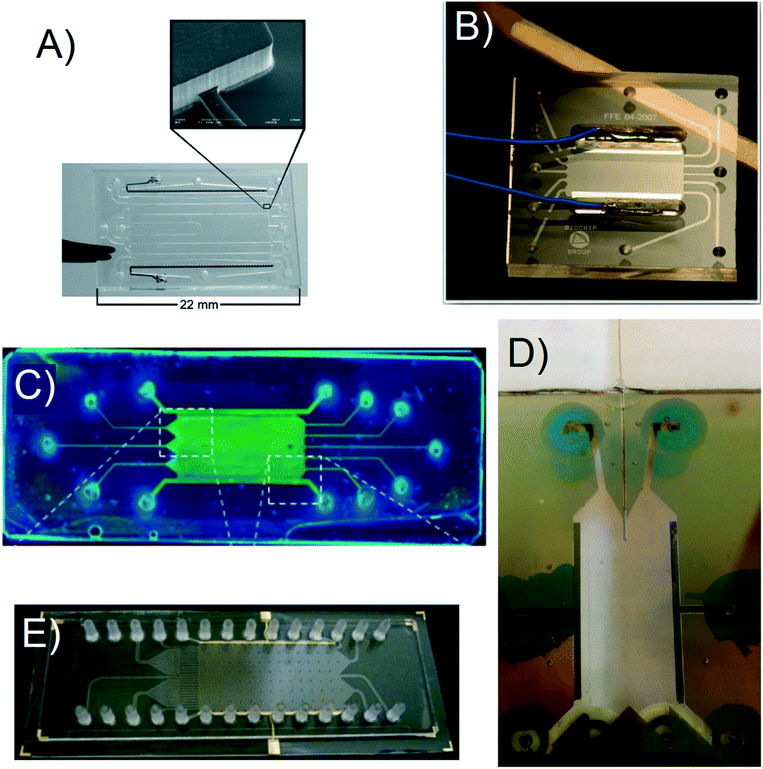 | ||
| Fig. 2 A) A Pyrex based μFFE device used for bacteria concentration. Adapted with permission from ref. 87 from the Royal Society of Chemistry. B) A Borofloat wafer based μFFE device created for bubble free electrophoresis. Adapted with permission from ref. 26 from the Royal Society of Chemistry. C) A glass slide μFFE device for the fluorescent determination of pIs in proteins. Adapted with permission from ref. 17 from the Royal Society of Chemistry. D) A Borofloat wafer based μFFE design for high peak capacity 2D separations of peptides. Adapted with permission from A. C. Johnson, M. T. Bowser, Anal. Chem., 2017, 89, 1665–1673. Copyright (2017) American Chemical Society. E) An injection molded μFFE device in cycloolefin polymer for low cost fast mass production of devices. Adapted with permission from ref. 37 from the Royal Society of Chemistry. | ||
Glass is a rigid material well suited for μFFE fabrication since it can withstand high voltages and pressure, is stable over a wide range of pH, and is relatively chemically inert.23 Fabrication in glass uses standard photolithography and wet etching techniques to pattern the electrode channel, separation channel, and electrodes in a bottom wafer.9,15,24 The featured wafer is then bonded to a second unpatterned glass wafer to enclose the channel. Thermal bonding and anodic bonding have been used to bond the two wafers together.15,25,26 While thermal bonding is much more commonly used in general microfluidics fabrication, the large open channel in μFFE devices makes this approach challenging. Care must be taken during the annealing step to prevent sagging in the separation channel. Additionally, the low contact area between wafers can lead to significant interfacial stress between the wafers upon cooling, which can make the final devices brittle and prone to fractures. Anodic bonding addresses these issues.27 In anodic bonding, amorphous silicon is deposited on the featureless wafer. The two wafers are aligned, brought into contact with electrodes, and a voltage is applied through the wafers. Current through the glass oxidizes the amorphous silicon, forming covalent bonds between the oxidized amorphous silicon and the glass.27,28
More recently, Jezierski et al. reported a method for fabrication of a glass μFFE device using liquid phase photolithography between two glass wafers.29 They were able to use a spacerless design to achieve channel heights of 25 μm while eliminating bonding steps. Another interesting way to bond glass wafers is through the use of a polymer bonding layer. Ding et al. used a photocurable monomer Norland Optical Adhesive 81 (NOA 81) as the bonding layer between two glass wafers in a μFFE device (see Fig. 3).30 The layer is dissolvable, making the glass wafers reusable and easier to maintain if the device is clogged.
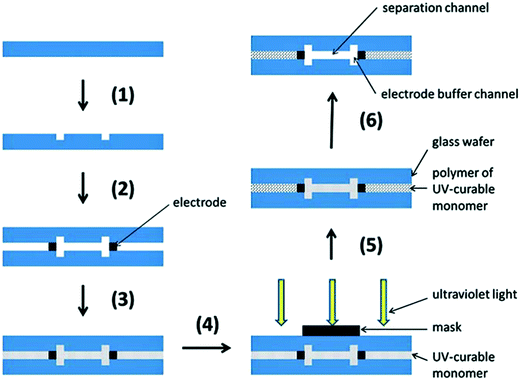 | ||
| Fig. 3 Schematic diagram of fabrication: (1) standard photolithography, wet etching and drilling; (2) fixing and alignment; (3) filling UV-curable monomer (NOA 81); (4) protecting the functional domain; (5) standard photolithography; (6) removing uncured monomer (NOA 81). Reproduced from ref. 33 with permission from The Royal Society of Chemistry. | ||
Since the introduction of soft photolithography by Whitesides et al., PDMS has become a standard substrate for microfluidics fabrication.31–34 PDMS fabrication follows a simple and inexpensive replica molding strategy which is able to quickly produce devices without the need for specialized facilities or instrumentation.35 However, the inherent flexibility of PDMS is a challenge for fabrication of μFFE devices. Using standard μFFE designs, the large open area of a separation channel fabricated in PDMS would bow out when under pressure. Zhang and Manz addressed this issue by using vacuum to pull buffer through a PDMS μFFE device.14 Support pillars were incorporated to prevent the separation channel from collapsing under the applied vacuum.14 While successful, precise fluidic control through an applied vacuum is significantly more challenging than using pressure driven flow. There was also some concern regarding what effect multiple paths around the pillars have on stream broadening and the homogeneity of the electric field.
More recent μFFE fabrication strategies have aimed to combine the performance of glass devices with the simplicity and cost effectiveness of PDMS devices. Most successful strategies have utilized low-cost, hard polymer substrates. Walowski et al. fabricated low-cost μFFE devices using a multistep lamination process in poly(methyl methacrylate) (PMMA).36 Devices were fabricated in 1 h using transfer tape as a spacer to generate a separation channel between two PMMA wafers. Devices supported field strengths as high as 422 V cm−1 without any degradation. Akagi et al. used a computer numerical controlled (CNC) milling machine to fabricate a PMMA device.20 The two PMMA substrate wafers were sealed using masking tape. Köhler et al. were able to mass produce μFFE devices using an injection molding fabrication method.37 An 80 ton clamping force injection molding machine was used to fabricate devices with a separation channel depth of 20 μm. de Jesus et al. used laser printer toner to make raised channels on a glass substrate.38 Devices with channel depths as small as 8 μm were fabricated in 1 h. Anciaux et al. were able to produce a μFFE device in ABS (acrylonitrile butadiene styrene) using an off the shelf, consumer grade 3D printer (see Fig. 4).21 They were able to produce a working μFFE device for less than $0.25 in material cost. The two printed wafers were bonded using an acetone vapor bath and platinum wires were inserted as the electrodes. While the fabrication throughput was slower than other approaches, the ease with which design modifications could be implemented suggests that 3D printing would be an excellent strategy for fast prototype development.
Electrolysis mediation
The relatively large cross sectional area of the separation channel gives rise to higher currents than typically observed in microfluidic systems, even at low potentials. This enhanced current generates significant electrolysis and bubble formation at the electrodes. Bubble formation is particularly troublesome since they disrupt flow paths and distort the electric field, giving rise to unstable separations. The continuous nature of the separation is one of μFFE's strongest attributes. Being unable to apply a separation potential over extended periods of time without significant bubble formation negates this advantage. As such, significant effort has been spent developing design improvements that mediate the effect of electrolysis bubble formation on μFFE stream stability. These designs can be classified as open or closed channel devices (see Fig. 5).Early devices aimed to replicate the closed channel, ion permeable membranes commonly used in conventional FFE to isolate the electrodes from the separation channel. Microfabricated channels were integrated as a pseudo membrane between the separation channel and electrode channels.10,14,39 Unfortunately, these side channels proved largely ineffective. Long, narrow side channels are necessary to effectively isolate flow in the electrode channels from the separation channel. These channels increased electrical resistance, resulting in a significant proportion of the applied potential being realized in the membrane channels, not the separation channel. In some designs it was reported that <5% of applied potential drop occurred across the separation channel.39 Subsequent closed channel designs have proven more effective. Several groups have used in situ polymerization to generate ion permeable membranes.20,29,30 These ion permeable membranes effectively segregate bubbles from the separation channel, but lacked chemical stability and still introduced a resistive barrier that reduces the applied potential realized in the separation channel. Köhler et al. took a unique approach by creating a wall between the electrode channel and separation channel with a 20 μm gap at the top of the device allowing voltage to be applied through a liquid bridge.22 While electric field strength improved, the device acted as a closed system causing electrodynamic broadening. Other closed design devices include electrostatic induction,40 and salt bridge connections.41
Open channel μFFE devices operate without any physical barrier between the electrodes and the separation channel. While open channel devices are simpler to fabricate and do not introduce an electrically resistive barrier, they are potentially less effective at isolating electrolysis bubbles than closed channel devices. Lu et al. prevented the formation of bubbles in an open channel μFFE device by operating below the potential required for water electrolysis.42 This strategy limited the separation potential to <2 V, greatly increasing the time necessary to achieve reasonable separation power. Kohlheyer et al. introduced a competing redox pair to suppress bubble formation.43 Streaming a mixture of hydroquinone and p-benzoquinone over the electrodes suppressed bubble formation at field strengths as high as 215 V cm−1. Fonslow et al. demonstrated that electrolysis bubbles could be effectively cleared by simply fabricating electrodes in channels that are deeper than the separation channel.44 Lubrication theory predicts that linear velocity in a planar channel is proportional to the square of the channel depth.45 An electrode channel that was 4× deeper than the separation channel generated a 16-fold increase in linear velocity, effectively clearing electrolysis bubbles while keeping the buffer velocity in the separation channel low enough to allow the separation to occur. An electric field as high as 589 V cm−1 could be applied without interference from electrolysis bubbles. It was estimated that approximately 91% of the applied potential was experienced in the separation channel. Frost et al. found that adding a surfactant (e.g. 300 μM Triton X-100) or organic modifier (e.g. 50![[thin space (1/6-em)]](https://www.rsc.org/images/entities/char_2009.gif) :
:![[thin space (1/6-em)]](https://www.rsc.org/images/entities/char_2009.gif) 50 water–methanol) to the separation buffer improved stream stability 8-fold.46 The buffer additives lowered the surface tension of the water, resulting in smaller electrolysis bubbles, which were more easily cleared from the μFFE device. A separation of fluorescent dyes at an electric field strength of 75 V cm−1 was stable for ≥2 hours. Herzog et al. used a nanoporous PTFE membrane as a top cover for the μFFE chip to purge the channels of bubbles.47 The PTFE membranes performed well, and were stable in electric fields as high as 500 V cm−1 for continuous separations over 3 hours. Without the membrane however, the separation became unstable after 7 min of continuous operation.
50 water–methanol) to the separation buffer improved stream stability 8-fold.46 The buffer additives lowered the surface tension of the water, resulting in smaller electrolysis bubbles, which were more easily cleared from the μFFE device. A separation of fluorescent dyes at an electric field strength of 75 V cm−1 was stable for ≥2 hours. Herzog et al. used a nanoporous PTFE membrane as a top cover for the μFFE chip to purge the channels of bubbles.47 The PTFE membranes performed well, and were stable in electric fields as high as 500 V cm−1 for continuous separations over 3 hours. Without the membrane however, the separation became unstable after 7 min of continuous operation.
Over the past several decades there have been tremendous advances in μFFE fabrication and design. Fabrication is now possible in a range of chemically diverse substrates and costs have dropped dramatically. Both open and closed channel designs are available that support continuous operation over several hours at reasonable separation potentials. The choice between open and closed channel designs is largely driven by the fabrication strategies available. Open channel designs are simpler to fabricate and easier to operate. Closed channel designs are more effective at isolating electrolysis bubbles but require more complex fabrication procedures, may introduce resistive barriers that lower the effective separation potential and can introduce electrodynamic broadening.
μFFE separation theory
While μFFE appears in many ways analogous to other microfluidic separations, the relative direction of flow and field introduce a number of unique differences that influence separation optimization. To this end, μFFE is able to draw on established FFE separation theory.6,48,49 The position where an analyte crosses the detection zone, or deflection distance (d), is determined by the analyte's overall mobility (μtotal), the electric field in the separation channel (E) and the time the analyte spends in the electric field (t):48,50| d = μtotalEt | (1) |
The product (Et) is referred to as the separation power of the FFE separation. A notable difference from other electrophoretic separations is that in FFE the electric field and the time an analyte spends in the electric field are independent. The time an analyte spends in the electric field can be manipulated in FFE by changing the buffer flow rate (v), or the separation channel length (L), neither of which impact, or are impacted by, the electric field. Multiple combinations of electric field and time are possible that give the same separation power and consequently the same deflection distance. The electric field and buffer velocity can therefore be changed independently to optimize μFFE resolution.
Factors that contribute to broadening in FFE have been discussed previously.6,51 The contributing factors to overall peak variance (σFFE2) in FFE are injection stream width (σinj2), analyte diffusion (σD2), electrodynamic broadening (σED2), hydrodynamic broadening (σHD2), and electrohydrodynamic broadening (σEHD2):6
| σFFE2 = σinj2 + σD2 + σED2 + σHD2 + σEHD2 | (2) |
The variance due to injection stream width is simply determined by the width of the sample stream as it enters the FFE separation channel. The variance caused by diffusion can be quantified according to:
| σD2 = 2Dt | (3) |
Hydrodynamic broadening is a consequence of the difference in the profiles of the pressure driven flow acting on the analyte longitudinally while the electric field moves the analyte laterally.49 The pressure driven flow generates a parabolic flow profile. Analytes near the wall of the separation channel move slower and therefore spend more in the electric field than analytes transiting the center of the channel. Increased time in the electric field increases the deflection distance. A crescent shaped profile is generated where analytes travelling through the center of the channel are deflected less than analytes nearer the separation channel walls.53 Hydrodynamic broadening (σHD2) is determined by:
 | (4) |
Electrohydrodynamic broadening is caused when the conductivity of the buffer solution is higher than that of the sample stream.6 A difference in conductivity between the sample stream and the separation buffer generates a discontinuity in the electric field, which causes analytes to either speed up or slow down as the exit the sample stream. If the conductivity of the sample stream is higher than that of the separation buffer, analyte migration velocity increases as it crosses the boundary, generating broader stream widths through de-stacking.
Fonslow and Bowser were able to demonstrate that in an open channel μFFE device, where the sample matrix was well matched with the separation buffer, stream width was primarily determined by injection width, diffusion and hydrodynamic broadening:49
| σμFFE2 = σinj2 + σD2 + σHD2 | (5) |
The expression could be further expanded to predict the effect of various experimental parameters on broadening:
 | (6) |
Combining equations for stream position (eqn (3)) and width (eqn (6)) allows the effect of experimental parameters on the resolution of a pair of streams to be predicted:49
 | (7) |
At lower buffer velocities, where diffusion is the dominant factor for broadening, eqn (7) can be approximated by:49
 | (8) |
Under these conditions resolution scales linearly with the electric field and inversely with the square root of the buffer linear velocity.
At higher buffer velocities and deflection distances, where hydrodynamic broadening dominates, eqn (7) can be approximated by:49
 | (9) |
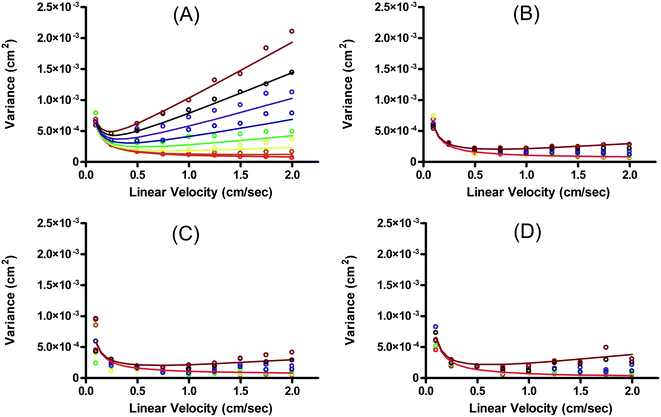
In this case, resolution is independent of the electric field and again inversely proportional to the square root of the buffer linear velocity. These equations suggest that in μFFE, high combinations of electric field and buffer linear velocity are not necessary to achieve optimal resolution. Fonslow and Bowser used eqn (7) to demonstrate that in μFFE a practically achievable resolution maximum occurs at a relatively low combination of buffer linear velocity and electric field.49 They suggested that the separation power should be maximized to spread analyte streams across the full width of the separation channel. The linear velocity of the buffer should then be adjusted to minimize stream width while also adjusting the electric field to keep the separation power, and therefore stream positions, constant. The low combination of electric field and buffer linear velocity necessary to optimize μFFE separations is an important contrast with most microscale electrophoretic separations where high electric fields and shorter analysis times almost always improve resolution.56,57 It is also of practical importance since it demonstrates that high pressure pumps and high voltage power supplies are not required for optimum μFFE performance.
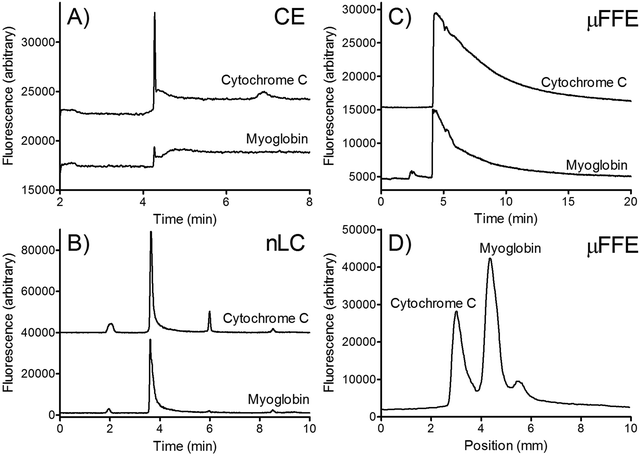
By analogy to capillary electrophoresis, early μFFE publications included broadening terms for wall adsorption and Joule heating.10,39 More recently, Geiger et al. have demonstrated that adsorption does not broaden stream width in μFFE separations.58 Analytes with no affinity for the wall stream directly through the separation channel. If an analyte adsorbs onto the surface it is fixed in position, moving neither in the pressure driven flow or electric field. When the analyte desorbs it returns to its original flow path determined by its mobility and the linear velocity of the separation buffer. Geiger et al. were even able to demonstrate effective μFFE separations of proteins that strongly adsorbed onto the glass surface of the separation channel (see Fig. 7).58 It is important to note that while surface adsorption does not contribute to μFFE broadening in the spatial dimension, it does affect the time required for an analyte to travel through the separation channel. This temporal broadening is an important consideration for monitoring applications where μFFE is used to continuously assay a changing analyte stream over time.
Recent modeling by Okhonin et al. has suggested that performing FFE separations with electric fields that are not perpendicular to the separation channel (i.e. non-orthogonal) can increase resolution at the expense of sample residence time.59 However, fabrication challenges have prevented this approach from being confirmed experimentally at the time of this publication.
Detection
Due to size and volume constraints, conventional scale FFE detection is usually performed offline via UV analysis of collected fractions.6,8 Using a similar offline analysis strategy for μFFE is generally infeasible due to the reduced volumes and complex channels necessary to collect a large number of fractions from discrete positions across the separation channel. Conversely, fabrication of a separation channel with a smaller detection zone in an optically clear substrate facilitates direct online detection. Consequently, μFFE devices are usually used in analytical separations while conventional scale FFE is more often used as a preparative separation.Fluorescence
Early μFFE utilized a point source detector with translational movement of the device to scan across the width of the separation channel.10,39,60 Unfortunately, scanning limits the sampling rate of the separation and physical translation complicates reliable alignment of the optical system. μFFE systems quickly migrated to imaging detectors with a large field of view to continuously image the entire width of the separation channel.40–42,44,46,61,62 Fluorescence detection is ideal due to its high sensitivity and the wide availability of fluorescence microscopes. Excitation with a lamp is easily performed in an epifluorescence alignment. Limits of detection can be further improved using laser-induced fluorescence (LIF).63,64 Integration of LIF can be as simple as focusing laser output into a line that extends across the width of the separation channel. Emission is recorded using a standard fluorescence microscope. Kochmann and Krylov have recently developed an open-source software suite in an effort to normalize image collection and analysis conditions for μFFE separations in conjunction with a homebuilt portable fluorescence detection system.65 The software provides detailed information on stream trajectory, width, and resolution of the separation on the whole chip.Optical detection in μFFE is more analogous to imaging than a typical separation detector. In chromatography or CE separations the detector only has a short period of time to measure the intensity of a peak as it exits the column. In μFFE, continuous injection of a sample presents a static sample stream that can be imaged over longer time periods. Turgeon et al. used signal averaging over relatively long exposure times to improve the detection limit of a simple μFFE LIF detector.64 The limit of detection improved 20 to 24-fold by collecting and averaging 500 sequential images over 2 min. The observed limit of detection for fluorescein was 14 pM.
Label-free detection
While extremely sensitive, the drawbacks of fluorescence detection are well known. Most analytes are not natively fluorescent and must be labeled with a fluorophore in order to be detected, which can dramatically affect the chemical properties of the sample. Expanded strategies for label free μFFE detection are needed. Unfortunately, few examples have been reported in the literature to date. An obvious candidate for label free detection would be UV-vis absorbance. This is challenging in microscale devices due to the short optical path length.66 Köhler et al. fabricated a fused silica μFFE device that allowed deep UV fluorescence scanning for the detection of aromatics and proteins.60 Lysozyme and chymotrypsinogen, were separated and detected using a single point scanning method and a 266 nm Nd:YAG laser. Challenges included low sensitivity due to large autofluorescence background signal from the buffer components. Wavelength selection was limited by the availability of deep UV laser sources. Poehler et al. used UV laser fluorescence in conjunction with a near-infrared fluorescent sensor layer under the separation bed to perform biomolecular isoelectric point analysis in near real-time.67 With this μFFIEF method, the pH gradient and biomolecule separation could be simultaneously observed. The separation was validated with offline mass spectrometric analysis.Jezierski et al. used cells adhered to the separation channel walls as biosensors for ATP.68 The position of a 20 μM stream of ATP was successfully visualized using human embryonic kidney cells doped with a calcium-sensitive fluorescent probe. The cells could be subjected to linear buffer velocities as high as 4.6 mm s−1 and an electric field of 100 V cm−1 before they would detach from the walls.
Becker et al. reported using surface enhanced Raman spectroscopy (SERS) as a label free detection mode for an isotachophoretic μFFE separation of myoglobin.69 However, the silver colloids used in SERS frequently blocked channel flow, and more experimentation is necessary to determine the feasibility of the technique.
Mass spectrometry
Coupling the planar μFFE separation channel to mass spectrometry (MS) remains a significant technical challenge. Benz et al. recently coupled μFFE to nanospray MS by manipulating the buffer flow velocity from different inlets to sequentially shift analyte streams to an outlet channel (see Fig. 8).70 A sample stream of 4 fluorescent dyes were visualized via fluorescence to assist directing the dye of interest into the MS outlet connection. The authors then applied this detection scheme to analyze the products of a multicomponent [3 + 2]-cycloannulation reaction. Only 2.5 min was necessary to fully scan the width of the separation channel.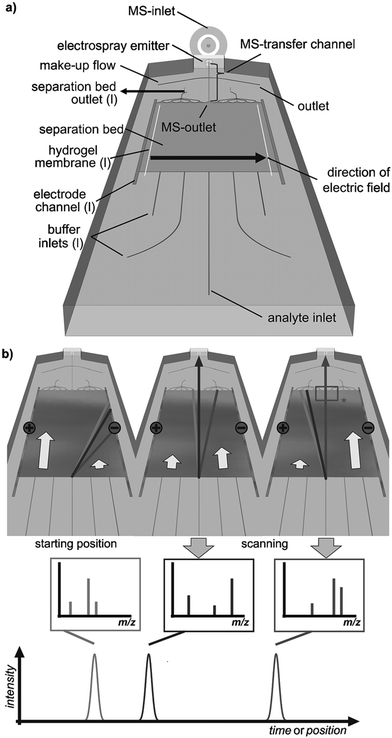 | ||
| Fig. 8 a) Layout of a microfluidic FFE-MS chip (l = left). b) The analysis principle. The separated analytes are directed towards the mass spectrometric outlet by alteration of the buffers' hydrodynamic flow. Arrows indicate relative flow rates and the rectangle (*) labels the area visualized by fluorescence imaging. Reproduced from ref. 70 with permission from John Wiley and Sons. | ||
Applications
Design and technical improvements in μFFE devices have made continuous, stable operation over long time periods possible. The majority of μFFE applications reported to date have been static, proof of concept separations used to assess the progress of this design development or replicate separations similar to those employed in conventional scale FFE. μFFE separations for a wide range of analytes have been reported including: fluorescent dyes,18,27,49 peptides,71,72 amino acids,73 and proteins.41,74 μFFE separation modes demonstrated to date include zone electrophoresis,10,15,21,39,58,75,76 isoelectric focusing,42,77–82 isotachophoresis,40,83 and field step electrophoresis.84 While these applications demonstrate the breadth and flexibility of μFFE separations, they generally don't perform significantly better than existing microscale separations. For μFFE to find widespread use, applications that take advantage of its unique properties must be developed. The continuous nature of μFFE separations allows it to be utilized in applications not typically associated with separations. Specifically, μFFE is particularly well suited for microscale purification and online monitoring applications.Microscale purification.
Sample flow rates into μFFE devices are typically 100–500 nL min−1.73,76,85–88 These flow rates make purifications on a low microliter scale possible in a reasonable time period. Fractionation is as simple as directing flow streams to specific outlet channels for collection. Purifications on this volume scale are challenging with limited competing technologies available.Chartogne et al. used μFFE as an online bridging step between capillary isoelectric focusing (cIEF) and electrospray ionization mass spectrometry (ESI-MS).89 High concentrations of carrier ampholytes in cIEF cause sensitivity issues in ESI-MS due to ion suppression of proteins.90,91 Ampholytes also cause salt buildup in the ESI interface which in turn leads to electrospray instability. μFFE was shown to effectively remove carrier ampholytes from a cIEF separation prior to ESI-MS analysis. A separation of myoglobin, carbonic anhydrase 1, and β-lactoglobulin B was demonstrated.
Jing et al. used μFFE to isolate aptamers for human IgE by Systematic Evolution of Ligands by EXponential enrichment (SELEX).76 High affinity aptamers (Kd = 20 nM) were isolated within 2–4 rounds of selection. The continuous nature of the μFFE separation greatly simplified fraction collection. Significantly larger volumes could be enriched using μFFE selections (3 μL) than was possible in similar CE based selections (∼8 nL). The increased sample volume allowed 1.8 × 10¹⁴ ssDNA ligands to be assessed in every round of selection, a 300-fold increase over CE-SELEX.
Podszun et al. used μFFE to concentrate viable bacteria from mL to μL volumes.87 Charged bacteria samples were concentrated in a Tris-borate-EDTA buffer at a constant current of 250 μA (see Fig. 9). Bacteria were continuously streamed into the μFFE device at 300 nL min−1 where they were deflected toward the electrode, which was blocked by a gel barrier. Bacteria were collected at the barrier for 30 min. The polarity of the electrode was then reversed to migrate bacteria back into the separation channel for collection. Enrichment efficiencies of up to 80% were reported. Concentration factors of 13 and 25 were reported for 100 μL and 200 μL samples, respectively.
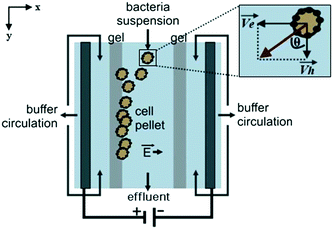 | ||
| Fig. 9 Illustration of the μFFE device for bacteria concentration. As charged bacteria are injected, they migrate toward the electrode. The gel barrier stops the bacteria migration effectively trapping the bacteria. The polarity of the electrodes are flipped to release the bacteria, and the buffer eluent is collected at the outlet at the bottom of the device. Reproduced from ref. 87 with permission from the Royal Society of Chemistry. | ||
Kostal et al. used μFFE to assess the electrophoretic properties of mitochondria isolated from rat myoblasts.85 The distribution of mitochondria mobilities were assessed in less than 30 s. The mobility distributions correlated well with CE-LIF measurements of the same sample. The benefits of the μFFE separation included less reagents, lower electric field, and shorter analysis time when compared to the CE method. The lower electric field of the μFFE separation was particularly important since it was determined that extrapolation to account for particle polarization was not necessary, eliminating the need to make measurements across a range of separation potentials.
A challenge associated with quantum dot (QD) synthesis is extracting pure QDs from unreacted impurities after the reaction is completed. Purification is particularly challenging in mass production of QDs. Kim et al. used μFFE as a platform for continuous separation of QDs from reaction impurities.92 A simple open channel device with two inlets and two outlets was fabricated in glass. The QD solution was injected in one inlet and the target solvent of ethanol flowed through the other. Voltage was applied, and the QDs were collected in the target solvent outlet, while the impurities did not migrate. A yield of 60% was reported.
Continuous monitoring
The ability of μFFE to separate and analyze a continuous analyte stream makes the technique ideally suited for online monitoring applications. The temporal response of the separation is only limited by the exposure time of the detection system, which can be 100 ms or faster.64 μFFE analyses offer the potential to combine the selectivity of a separation with a time response typically associated with an electrochemical or optical sensor.Fonslow and Bowser used gradient μFFE as an efficient way to optimize electrophoretic separation conditions.93 μFFE was used to continuously monitor a separation of NBD-F labeled amino acids as the separation buffer was increased from 0 to 50 mM hydroxypropyl-β-cyclodextrin (HP-β-CD) over a 5 min period (see Fig. 10). μFFE separations were recorded every 5 s, allowing the resolution to be assessed at 60 different HP-β-CD concentrations. This nearly continuous coverage allowed the optimum HP-β-CD concentration to be unambiguously identified in 5 min. A similar optimization using CE would take several hours.
Turgeon et al. used gradient μFFE to measure aptamer affinities for their targets across a range of ligand concentrations.86 A constant concentration of aptamer was combined with an increasing concentration of ligand in an online mixing tee. μFFE was used to continuously measure the ratio of bound to free aptamer as the ligand concentration was increased over a 5 min period. μFFE separations were recorded every 1 s allowing the equilibrium to be assessed at 300 distinct ligand concentrations in 5 min. Aptamers for IgE and HIV-RT were assessed. The nearly continuous coverage of the binding isotherm allowed the affinity and stoichiometry of the equilibrium to be assessed with greater confidence.
Cheng and Chang reported a novel method for the generation of a pH gradient in μFFIEF.94 Rather than create several inlet channels for the introduction of several ampholyte solutions, a pH gradient was created with electrically switchable pH actuators and 3D integrated polyurethane based salt bridges. The pH actuator is achieved with bipolar membranes that inject excess OH− or H+ ions which are produced by electric field water dissociation at the membrane junction. The device was able to create pH gradients from pH 2 to pH 10 without ampholytes in proof of concept testing.
Two dimensional separations
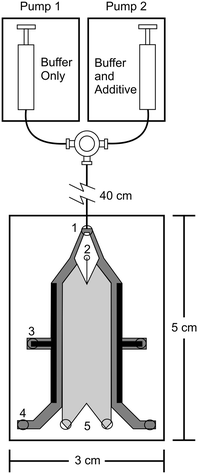
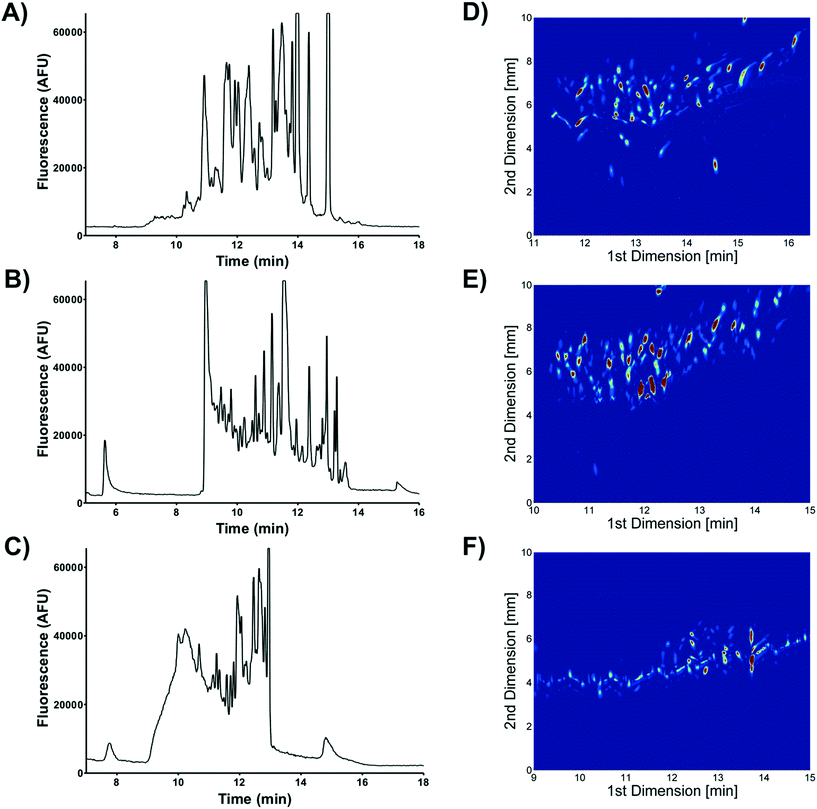
Two dimensional (2D) separations offer a powerful approach for analyzing complex samples. Under ideal conditions the peak capacity of a 2D separation approaches the product of the peak capacity of each individual separation.95 Unfortunately, the speed of hyphenated 2D separations is limited by the sampling rate of the 2nd dimension separation.96 Peak capacity is lost if the 2nd dimension separation undersamples peaks as they elute off the first dimension column.97 To overcome this undersampling limitation hyphenated 2D separations often couple a very slow first dimension separation with a faster than optimum second dimension separation.μFFE is ideally suited to act as the second dimension of a hyphenated 2D separation. Continuous μFFE separation effectively eliminates undersampling as a limitation, allowing peak capacity to be increased significantly without increasing the first dimension separation time. Geiger et al. coupled nano-liquid chromatography (nLC) with μFFE to perform 2D separations of peptides and amino acids (see Fig. 11).73,98 Coupling was achieved via a connection capillary introduced directly into the μFFE separation channel to make a zero dead volume connection. Analyte peaks streamed directly into the μFFE separation channel as they eluted from the nLC column. No complicated modulation or valving was necessary to couple the two separations. A separation of a fluorescently labeled BSA tryptic digest yielded an ideal 2D peak capacity of 1320 in a 5 min separation window (264 peaks per min).73
Johnson and Bowser coupled CE and μFFE to perform 2D separations.88 An ideal 2D peak capacity of 2592 was observed in a 9 min CE × μFFE separation of a fluorescently labeled BSA digest (7.6 min separation window, 342 peaks per min). Adding the second dimension μFFE separation increased the peak capacity 24-fold with no increase in the first dimension CE separation time. μFFE separations were recorded every 250–500 ms, generating ≥8 data points/peak as they migrated off the CE capillary, effectively eliminating under sampling as a source of band broadening. CE performed better than nLC at faster separation times allowing even faster first dimension analyses to be executed. For example, CE × μFFE generated an ideal peak capacity of 1885 in a 2.7 min separation of fluorescently labeled small molecule bioamines (1.8 min separation window, 1053 peaks per min).
Conclusions
Dramatic improvements have been made in μFFE over the past several decades. A number of fabrication strategies have been developed with recent emphasis on producing lower cost μFFE devices in hard plastic substrates. Design improvements have effectively addressed performance issues that arise from electrolysis bubble generation, allowing continuous operation over several hours. μFFE separation theory has been developed allowing rational optimization of separation parameters. Simple detection schemes have been demonstrated but further development in this area is needed. Label-free detection strategies and MS interfaces would dramatically increase the applicability of μFFE separations. Unique applications that take advantage of the continuous nature of μFFE separations continue to be introduced. Applications of particular interest include microscale purifications, continuous monitoring and high peak capacity 2D separations.Conflicts of interest
There are no conflicts of interest to declare.Acknowledgements
The authors gratefully acknowledge funding from the National Science Foundation (CHE-1152022) and the National Institutes of Health (GM063533).References
- J. Barrollier, E. Watzke and H. Gibian, Z. Naturforsch., B: Anorg. Chem., Org. Chem., 1958, 13, 754–756 Search PubMed.
- K. Hannig, Fresenius' Z. Anal. Chem., 1961, 181, 244–254 CrossRef CAS.
- K. Hannig, J. Chromatogr., 1978, 159, 183–191 CrossRef CAS PubMed.
- L. Křivánková and P. Boček, Electrophoresis, 1998, 19, 1064–1074 CrossRef PubMed.
- M. Islinger, C. Eckerskorn and A. Völkl, Electrophoresis, 2010, 31, 1754–1763 CrossRef CAS PubMed.
- M. C. Roman and P. R. Brown, Anal. Chem., 1994, 66, 86A–94A CrossRef CAS.
- C. Eckerskorn, R. Wildgruber, M. Nissum and G. Weber, Tec. Lab., 2005, 27, 1020–1023 CAS.
- H. Wagner, Nature, 1989, 341, 669–670 CrossRef.
- A. Arora, G. Simone, G. B. Salieb-Beugelaar, J. T. Kim and A. Manz, Anal. Chem., 2010, 82, 4830–4847 CrossRef CAS PubMed.
- D. E. Raymond, A. Manz and H. M. Widmer, Anal. Chem., 1994, 66, 2858–2865 CrossRef CAS.
- S. Koehler, C. Weilbeer, S. Howitz, H. Becker, V. Beushausen and D. Belder, Lab Chip, 2011, 11, 309–314 RSC.
- Y.-A. Song, M. Chan, C. Celio, S. R. Tannenbaum, J. S. Wishnok and J. Han, Anal. Chem., 2010, 82, 2317–2325 CrossRef CAS PubMed.
- Y.-A. Song, L. Wu, S. R. Tannenbaum, J. S. Wishnok and J. Han, Anal. Chem., 2013, 85, 11695–11699 CrossRef CAS PubMed.
- C.-X. Zhang and A. Manz, Anal. Chem., 2003, 75, 5759–5766 CrossRef CAS PubMed.
- B. R. Fonslow and M. T. Bowser, Anal. Chem., 2005, 77, 5706–5710 CrossRef CAS PubMed.
- M. Becker, U. Marggraf and D. Janasek, J. Chromatogr. A, 2009, 1216, 8265–8269 CrossRef CAS PubMed.
- S. Jezierski, D. Belder and S. Nagl, Chem. Commun., 2013, 49, 904–906 RSC.
- B. R. Fonslow, V. H. Barocas and M. T. Bowser, Anal. Chem., 2006, 78, 5369–5374 CrossRef CAS PubMed.
- J. E. Prest, S. J. Baldock, P. R. Fielden, N. J. Goddard, R. Goodacre, R. O'Connor and B. J. Treves Brown, J. Chromatogr., B, 2012, 903, 53–59 CrossRef CAS PubMed.
- T. Akagi, R. Kubota, M. Kobayashi and T. Ichiki, Jpn. J. Appl. Phys., 2015, 54, 1–5 CrossRef CAS.
- S. K. Anciaux, M. Geiger and M. T. Bowser, Anal. Chem., 2016, 88, 7675–7682 CrossRef CAS PubMed.
- S. Köhler, C. Benz, H. Becker, E. Beckert, V. Beushausen and D. Belder, RSC Adv., 2012, 2, 520–525 RSC.
- N. P. Bansal and R. H. Doremus, Handbook of Glass Properties, Elsevier, Cambridge, 1986 Search PubMed.
- B. R. Fonslow, V. H. Barocas and M. T. Bowser, Anal. Chem., 2006, 78, 5369–5374 CrossRef CAS PubMed.
- M. Becker, U. Marggraf and D. Janasek, J. Chromatogr. A., 2009, 1216, 8265–8269 CrossRef CAS PubMed.
- D. Kohlheyer, J. C. Eijkel, S. Schlautmann, A. van den Berg and R. B. Schasfoort, Anal. Chem., 2008, 80, 4111–4118 CrossRef CAS PubMed.
- B. R. Fonslow and M. T. Bowser, Anal. Chem., 2005, 77, 5706–5710 CrossRef CAS PubMed.
- M. Esashi, N. Ura and Y. Matsumoto, Proceedings IEEE Micro Electro Mechanical Systems, 1992, pp. 43–48 Search PubMed.
- S. Jezierski, L. Gitlin, S. Nagl and D. Belder, Anal. Bioanal. Chem., 2011, 401, 2651–2656 CrossRef CAS PubMed.
- H. Ding, X. Li, X. Lv, J. Xu, X. Sun, Z. Zhang, H. Wang and Y. Deng, Analyst, 2012, 137, 4482–4489 RSC.
- Y. Xia and G. M. Whitesides, Annu. Rev. Mater. Sci., 1998, 28, 153–184 CrossRef CAS.
- R. S. Kane, S. Takayama, E. Ostuni, D. E. Ingber and G. M. Whitesides, Biomaterials, 1999, 20, 2363–2376 CrossRef CAS PubMed.
- G. M. Whitesides, E. Ostuni, S. Takayama, X. Jiang and D. E. Ingber, Annu. Rev. Biomed. Eng., 2001, 3, 335–373 CrossRef CAS PubMed.
- D. Qin, Y. Xia and G. M. Whitesides, Nat. Protoc., 2010, 5, 491–502 CrossRef CAS PubMed.
- J. C. McDonald and G. M. Whitesides, Acc. Chem. Res., 2002, 35, 491–499 CrossRef CAS PubMed.
- B. Walowski, W. Hüttner and H. Wackerbarth, Anal. Bioanal. Chem., 2011, 401, 2465–2471 CrossRef CAS PubMed.
- S. Köhler, C. Benz, H. Becker, E. Beckert, V. Beushausen and D. Belder, RSC Adv., 2012, 2, 520–525 RSC.
- D. P. de Jesus, L. Blanes and C. L. do Lago, Electrophoresis, 2006, 27, 4935–4942 CrossRef PubMed.
- D. E. Raymond, A. Manz and H. M. Widmer, Anal. Chem., 1996, 68, 2515–2522 CrossRef CAS PubMed.
- D. Janasek, M. Schilling, A. Manz and J. Franzke, Lab Chip, 2006, 6, 710–713 RSC.
- Y.-A. Song, M. Chan, C. Celio, S. R. Tannenbaum, J. S. Wishnok and J. Han, Anal. Chem., 2010, 82, 2317–2325 CrossRef CAS PubMed.
- H. Lu, S. Gaudet, M. A. Schmidt and K. F. Jensen, Anal. Chem., 2004, 76, 5705–5712 CrossRef CAS PubMed.
- D. Kohlheyer, J. C. T. Eijkel, S. Schlautmann, A. van den Berg and R. B. M. Schasfoort, Anal. Chem., 2008, 80, 4111–4118 CrossRef CAS PubMed.
- B. R. Fonslow, V. H. Barocas and M. T. Bowser, Anal. Chem., 2006, 78, 5369–5374 CrossRef CAS PubMed.
- O. Reynolds, Philos. Trans. R. Soc. London, 1886, 177, 157–234 CrossRef.
- N. W. Frost and M. T. Bowser, Lab Chip, 2010, 10, 1231–1236 RSC.
- C. Herzog, G. F. W. Jochem, P. Glaeser and S. Nagl, Microchim. Acta, 2015, 182, 887–892 CrossRef CAS.
- V. Kašička, Z. Prusík, P. Sázelová, J. Jiráček and T. Barth, J. Chromatogr. A., 1998, 796, 211–220 CrossRef.
- B. R. Fonslow and M. T. Bowser, Anal. Chem., 2006, 78, 8236–8244 CrossRef CAS PubMed.
- V. Kašička, Z. Prusik and J. Pospíšek, J. Chromatogr. A., 1992, 608, 13–22 CrossRef.
- P. H. Rhodes and R. S. Snyder, Electrophoresis, 1986, 7, 113–120 CrossRef CAS.
- J. C. Giddings, Unified Separation Science, Wiley, New York, 1991 Search PubMed.
- K. Hannig, H. Wirth, B.-H. Meyer and K. Zeiller, Hoppe-Seyler's Z. Physiol. Chem., 1975, 356, 1209–1224 CrossRef CAS PubMed.
- D. Dutta, J. Chromatogr. A, 2015, 1404, 124–130 CrossRef CAS PubMed.
- J. Van Deemter, F. Zuiderweg and A. V. Klinkenberg, Chem. Eng. Sci., 1956, 5, 271–289 CrossRef CAS.
- A. W. Moore and J. W. Jorgenson, Anal. Chem., 1993, 65, 3550–3560 CrossRef CAS PubMed.
- R. T. Kennedy, Anal. Chim. Acta, 1999, 400, 163–180 CrossRef CAS.
- M. Geiger, R. K. Harstad and M. T. Bowser, Anal. Chem., 2015, 87, 11682–11690 CrossRef CAS PubMed.
- V. Okhonin, C. J. Evenhuis and S. N. Krylov, Anal. Chem., 2010, 82, 1183–1185 CrossRef CAS PubMed.
- S. Köhler, S. Nagl, S. Fritzsche and D. Belder, Lab Chip, 2012, 12, 458–463 RSC.
- S. Koehler, C. Benz, H. Becker, E. Beckert, V. Beushausen and D. Belder, RSC Adv., 2012, 2, 520–525 RSC.
- B. Walowski, W. Huttner and H. Wackerbarth, Anal. Bioanal. Chem., 2011, 401, 2465–2471 CrossRef CAS PubMed.
- V. Kostal, B. R. Fonslow, E. A. Arriaga and M. T. Bowser, Anal. Chem., 2009, 81, 9267–9273 CrossRef CAS PubMed.
- R. T. Turgeon and M. T. Bowser, Electrophoresis, 2009, 30, 1342–1348 CrossRef CAS PubMed.
- S. Kochmann and S. N. Krylov, Lab Chip, 2017, 17, 256–266 RSC.
- K. B. Mogensen and J. P. Kutter, Electrophoresis, 2009, 30, S92–S100 CrossRef PubMed.
- E. Poehler, C. Herzog, C. Lotter, S. A. Pfeiffer, D. Aigner, T. Mayr and S. Nagl, Analyst, 2015, 140, 7496–7502 RSC.
- S. Jezierski, A. S. Klein, C. Benz, M. Schaefer, S. Nagl and D. Belder, Anal. Bioanal. Chem., 2013, 405, 5381–5386 CrossRef CAS PubMed.
- M. Becker, C. Budich, V. Deckert and D. Janasek, Analyst, 2009, 134, 38–40 RSC.
- C. Benz, M. Boomhoff, J. Appun, C. Schneider and D. Belder, Angew. Chem., Int. Ed., 2015, 54, 2766–2770 CrossRef CAS PubMed.
- M. Geiger, N. W. Frost and M. T. Bowser, Anal. Chem., 2014, 86, 5136–5142 CrossRef CAS PubMed.
- C. Herzog, E. Poehler, A. J. Peretzki, S. M. Borisov, D. Aigner, T. Mayr and S. Nagl, Lab Chip, 2016, 16, 1565–1572 RSC.
- M. Geiger and M. T. Bowser, Anal. Chem., 2016, 88, 2177–2187 CrossRef CAS PubMed.
- Q.-Y. Shen, C.-G. Guo, J. Yan, Q. Zhang, H.-Y. Xie, S. Jahan, L.-Y. Fan, H. Xiao and C.-X. Cao, J. Chromatogr. A., 2015, 1397, 73–80 CrossRef CAS PubMed.
- H. Kobayashi, K. Shimamura, T. Akaida, K. Sakano, N. Tajima, J. Funazaki, H. Suzuki and E. Shinohara, J. Chromatogr. A., 2003, 990, 169–178 CrossRef CAS PubMed.
- M. Jing and M. T. Bowser, Lab Chip, 2011, 11, 3703–3709 RSC.
- J. W. Albrecht, J. El-Ali and K. F. Jensen, Anal. Chem., 2007, 79, 9364–9371 CrossRef CAS PubMed.
- D. Kohlheyer, G. A. Besselink, S. Schlautmann and R. B. Schasfoort, Lab Chip, 2006, 6, 374–380 RSC.
- D. Kohlheyer, J. C. Eijkel, S. Schlautmann, A. Van Den Berg and R. B. Schasfoort, Anal. Chem., 2007, 79, 8190–8198 CrossRef CAS PubMed.
- Y.-A. Song, S. Hsu, A. L. Stevens and J. Han, Anal. Chem., 2006, 78, 3528–3536 CrossRef CAS PubMed.
- Y. Xu, C.-X. Zhang, D. Janasek and A. Manz, Lab Chip, 2003, 3, 224–227 RSC.
- B. Walowski, W. Huettner and H. Wackerbarth, Anal. Bioanal. Chem., 2011, 401, 2465–2471 CrossRef CAS PubMed.
- D. Janasek, M. Schilling, J. Franzke and A. Manz, Anal. Chem., 2006, 78, 3815–3819 CrossRef CAS PubMed.
- D. Kohlheyer, J. C. Eijkel, A. van den Berg and R. Schasfoort, Electrophoresis, 2008, 29, 977–993 CrossRef CAS PubMed.
- V. Kostal, B. R. Fonslow, E. A. Arriaga and M. T. Bowser, Anal. Chem., 2009, 81, 9267–9273 CrossRef CAS PubMed.
- R. T. Turgeon, B. R. Fonslow, M. Jing and M. T. Bowser, Anal. Chem., 2010, 82, 3636–3641 CrossRef CAS PubMed.
- S. Podszun, P. Vulto, H. Heinz, S. Hakenberg, C. Hermann, T. Hankemeier and G. A. Urban, Lab Chip, 2012, 12, 451–457 RSC.
- A. C. Johnson and M. T. Bowser, Anal. Chem., 2017, 89, 1665–1673 CrossRef CAS PubMed.
- A. Chartogne, U. R. Tjaden and J. Van der Greef, Rapid Commun. Mass Spectrom., 2000, 14, 1269–1274 CrossRef CAS PubMed.
- Q. Tang, A. K. Harrata and C. S. Lee, Anal. Chem., 1995, 67, 3515–3519 CrossRef CAS.
- Q. Tang, A. K. Harrata and C. S. Lee, Anal. Chem., 1997, 69, 3177–3182 CrossRef CAS PubMed.
- D. Kim, H. K. Park, H. Choi, J. Noh, K. Kim and S. Jeong, Nanoscale, 2014, 6, 14467–14472 RSC.
- B. R. Fonslow and M. T. Bowser, Anal. Chem., 2008, 80, 3182–3189 CrossRef CAS PubMed.
- L.-J. Cheng and H.-C. Chang, Lab Chip, 2014, 14, 979–987 RSC.
- J. C. Giddings, Anal. Chem., 1984, 56, 1258A–1270A CrossRef CAS PubMed.
- K. Horvath, J. N. Fairchild and G. Guiochon, Anal. Chem., 2009, 81, 3879–3888 CrossRef CAS PubMed.
- L. W. Potts, D. R. Stoll, X. Li and P. W. Carr, J. Chromatogr. A., 2010, 1217, 5700–5709 CrossRef CAS PubMed.
- M. Geiger, N. W. Frost and M. T. Bowser, Anal. Chem., 2014, 86, 5136–5142 CrossRef CAS PubMed.
| This journal is © The Royal Society of Chemistry 2018 |


