DOI:
10.1039/C7RA00974G
(Paper)
RSC Adv., 2017,
7, 17980-17987
Emission enhancement of GFP chromophore in aggregated state via combination of self-restricted effect and supramolecular host–guest complexation†
Received
22nd January 2017
, Accepted 9th March 2017
First published on 24th March 2017
Abstract
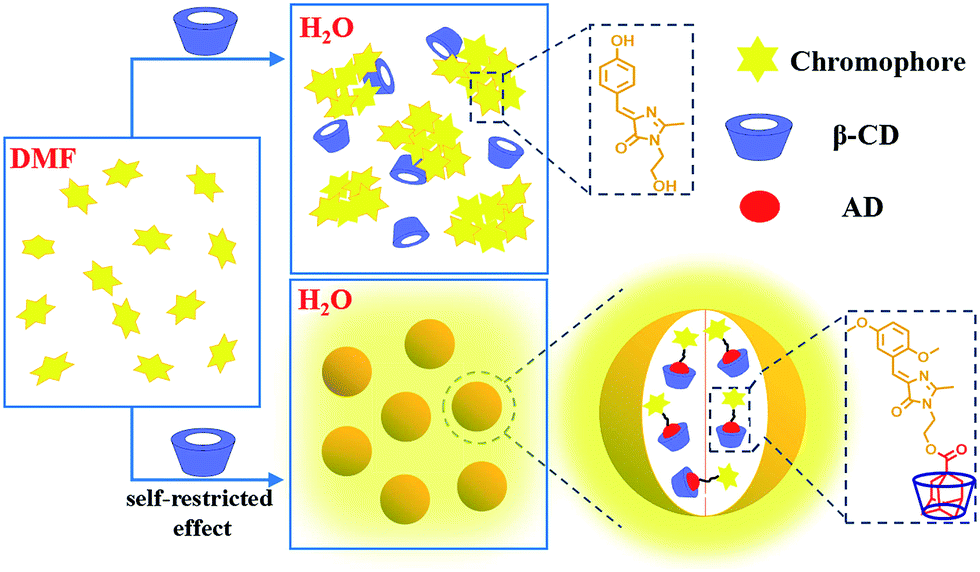
The emission enhancement of GFP-like chromophores in the aggregated state is a great challenge due to its free conformational motions and aggregation-induced quenching (ACQ) features. Herein, the emission response of a GFP chromophore (GFPc) in its aggregated state has been greatly enhanced via combination of self-restricted effect and supramolecular host–guest complexation. Specifically, the benzene group of the GFP chromophore (HBHI) was tailored by 2,5-methoxy group to construct a self-restricted chromophore (MBHI), which shows enhanced emission response in both solutions and aggregated state compared to HBHI due to the formation of the self-restricted effect. After conjugated to adamantine (AD), the chromophore (MBIAD) exhibits aggregation-induced emission enhancement (AIEE) feature compared to MBHI in aggregated state. Moreover, the aggregated emission of MBIAD further enhances by complexation with proper β-cyclodextrin (β-CD), which reduces strong ACQ between chromophores. Furthermore, the aggregated emission can also be tuned by controlling the ratio of β-CD and AD. Under a ratio of 1![[thin space (1/6-em)]](https://www.rsc.org/images/entities/char_2009.gif) :2, MBIAD and Me-β-CD can assemble into nanoparticle with a diameter of about 55 nm, which has been applied to cell imaging due to the relatively low cell cytotoxicity.
:2, MBIAD and Me-β-CD can assemble into nanoparticle with a diameter of about 55 nm, which has been applied to cell imaging due to the relatively low cell cytotoxicity.
1. Introduction
The emission enhancement of fluorophores in the aggregated state has become an application-driven requirement to enhance material emission performance due to their wide applications in photovoltaic cells, light-emitting devices, optical sensors and biological fluorescent probes.1–5 In this respect, a variety of methodologies have been developed to avoid the formation of delocalized excitons or strong π–π stacking between conventional aggregation-caused quenching (ACQ) fluorophores, such as the utilization of a micellar nanosystem or a metal nanostructure, the formation of J-type or H-type aggregate and the alkyl substituent-mediated crystal packing.6–12 Recently, a unique aggregation-induced emission (AIE) phenomenon was discovered by Tang and his co-workers, providing an effective approach to enhance the emission response of defined fluorophores in aggregated state.13 Further, a serious of multicolour AIE fluorescent probes have been designed and applied to biological applications.14–18 Nevertheless, novel methods for the emission enhancement of specific fluorophores are still in great demands.
The chromophore, 4-hydroxybenzylidene imidazolinone (HBI), formed in situ via autocatalytic dehydration/oxidation of a Ser–Tyr–Gly tripeptide, enables green fluorescent protein (GFP) eminent photophysical character, making it a powerful tool for fluorescence labeling in biology.19,20 Surprisingly, the fluorescence of either isolated or synthesized HBI diminishes dramatically by four orders of magnitude in fluid solvents due to an ultrafast internal conversion caused by free conformational motion around the CC bonds.21–24 Meanwhile, the solid power of HBI is also completely non-emissive because of the strong π–π stacking between adjacent molecules.25–27 Over past years, the emission enhancement of HBI in fluid solutions has drawn great attention.28 On the one hand, the fluorescence is recovered by physical encapsulation with supramolecular hosts, polymers, porous scaffolds, proteins or ribonucleic acid, which can inhibit the conformational free motion by forming a confined environment.29–32 On the other hand, chemical modification of the chromophore has also been applied to enhance the fluorescence emission. An effective strategy is to develop conformational locked chromophores via chemically locking strategy, which greatly suppresses the chromophores' free torsional rotations and results in highly luminescent chromophores.33,34 Recently, our research group has constructed a family of unlocked self-restricted GFP chromophore analogues with dramatic emission enhancement in fluid solutions.35 Considering the non-emissive and ACQ nature of HBI, it is a great challenge to enhance its emission response in aggregated state in solutions.
Cyclodextrins (CDs) are characteristic of a hydrophilic exterior surface and a hydrophobic interior cavity, which can accommodate a wide range of molecules as guests. Among the varieties of such host–guest pairs, the inclusion complex of β-CD and adamantly group (AD) has been mostly investigated due to their high association constant.36 This host–guest interaction has been greatly employed to build supramolecular assemblies.37 Given the flexibility of supramolecular chemistry, host–guest interaction turns out to be an effective approach to tune the optical properties of fluorescent polymers or dyes.38–40 We tried to learn from previous reports of emission enhancement by alkyl substituent-mediated crystal packing and artificially engineered porous scaffolds, which inspires us to investigate the possibility of enhancing the emission of HBI in aggregated state via combination of self-restricted effect and supramolecular host–guest complexation.30,41 Hopefully, the dual function would greatly enhance the fluorescence of HBI in its aggregated state.
Herein, we report the emission enhancement of HBI in the aggregated state via the combination of self-restricted effect and host–guest complexation. By 2 + 3 cycloaddition, the self-restricted chromophore (MBHI) was constructed, which shows enhanced emission response in both solutions and aggregated state compared to the GFP chromophore (HBHI) due to self-restricted effect. After conjugated with adamantine (AD), the chromophore (MBIAD) exhibits some aggregation-induced emission enhancement (AIEE) feature compared to that of MBHI in the aggregated state. Moreover, the aggregated emission of MBIAD further increases after complexation with proper β-CD due to its isolation effect, which can reduce strong π–π interaction between chromophores. By controlling the amount of β-CD, the emission of the assembled complex can also be tuned. As a demonstration, the emission enhanced chromophores have been applied to cell imaging, providing another effective approach for the application of GFPc analogue in aggregated state (Fig. 1).
 |
| | Fig. 1 Concept of emission enhancement of GFP chromophore in aggregated state. Upper: the aggregated emission of GFP chromophore (HBIHI) is very dim due to free conformational motion and ACQ; below: the aggregated emission is greatly enhanced via self-restricted effect and host–guest interaction. | |
2. Experimental section
2.1 Materials and chemicals
2,5-Dimethoxybenzaldehyde, 2-aminoethanol, β-cyclodextrin (β-CD), methyl-β-cyclodextrin (Me-β-CD), triacetyl-β-cyclodextrin (Ac-β-CD), 1-adamantanecarboxylic acid, N-(4-pyridyl)dimethylamine (DMAP), N,N′-dicyclohexylcarbodiimide (DCC) were purchased and used as received. Dichloromethane was dried over CaH2 and refluxed for 2 h before use. Ethanol was refluxed over calcium oxide for 3 h before use. Methyl 2-(1-ethoxy-ethylideneamino)acetate (MEEA) and 4-(4-hydroxy-benzylidene)-1-hydroxyethyl-2-methyl-5-imidazolinone (HBHI) were synthesized as detailed by our previous publications.29,42 All other reagents and solvents were purchased commercially and used without further purification. For cell experiments, MCF-7 cells (a human breast adenocarcinoma cell line) were purchased from ATCC. DMEM (Dulbecco's modified Eagle's medium), FBS (fetal bovine serum), antibiotics (50 units per mL penicillin and 50 units per mL streptomycin) were all purchased from ThermoFisher.
2.2 Characterizations
Both 1H and 13C NMR spectra were measured with Varian MERCURY plus-400 spectrometer at 400 MHz and 100 MHz instruments respectively using dimethylsulfoxide-d6 (DMSO-d6) or chloroform-d (CDCl3-d) as the solvent at 298 K. Chemical shifts (δ) are quoted in parts per million (ppm) and coupling constants (J) are recorded in hertz (Hz). The chemical shifts were referenced to the residual peak of deuterated solvent: DMSO-d6 (2.48 ppm); CDCl3 (7.26 ppm). FTIR spectra were tested with a Perkin Elmer Paragon 1000 spectrophotometer between 4000 and 450 cm−1. All sample slices were measured by pestling the solid sample with dry potassium bromide (KBr) and then moulding under high pressure. HRMS was measured on a Waters Micromass Q-TOF Premier Mass Spectrometer with data acquired for each sample from 50 to 1000 Da with a 0.10 s scan time and a 0.01 s interscan delay over a 10 min analysis time. The UV-Vis absorption spectra of the sample solutions were tested at room temperature on a Perkin Elmer Lambda 20 UV-Vis spectrometer with a scan speed of 480 nm min−1. The fluorescence emission spectra were measured with a PTI-QM/TM/IM steady-state & time-resolved fluorescence spectrofluorometer (USA/CAN Photon Technology International Int.). Excitation wavelength was the maximum UV-Vis absorption wavelength. Dynamic light scattering (DLS) measurements were carried out on a Malvern Zetasizer Nano ZS90 apparatus equipped with a 4.0 mW He–Ne laser operating at λ = 633 nm. All samples were measured at room temperature with a scattering angle of 90°. Transmission Electron Microscopy (TEM) studies were performed with a JEOL JEM-100CX-II instrument at a voltage of 200 kV. Samples were prepared by drop-casting complex solutions onto carbon-coated copper grids and then air-drying at room temperature before measurement.
2.3 Synthesis
General procedure for synthesis of GFPc analogue.
GFPc analogue was conveniently synthesized through a 1,3-dipolar, [2 + 3] cycloaddition of an imide with aromatic Schiff bases as reported by Deng.29 Briefly, Schiff bases were prepared by combining the given aromatic aldehyde (1 mmol) with ethanolamine (1.1 mmol) in ethanol for 12 h at room temperature. Then, the solvent was removed under vacuum and methyl 2-(1-ethoxyethylideneamino)acetate (1.1 mmol) was added in ethanol. The reaction was allowed to stir overnight under ambient conditions. The progression of the reaction was monitored by thin-layer-chromatography. Finally, the mixture was purified by silica gel column chromatography using ethyl acetate and petroleum ether as the solvents.
Synthesis of 4-(2,5-dimethoxylbenzylidene)-1-hydroxyethyl-2-methyl-5-imidazolinone (MBHI).
2,5-Dimethoxybenzaldehyde was stirred with 2-aminoethanol in ethanol in a molar ratio of 1:1.1 to get the Schiff bases, which then reacted with methyl 2-(1-ethoxy-ethylideneamino)acetate (MEEA) to obtain the crude products. Products were purified by silica gel column chromatography and characterized by 1H and 13C NMR, HRMS, and IR spectra. Yellow solid, yield 72%. 1H NMR (400 MHz, DMSO-d6): δ 8.38 (t, J = 1.7 Hz, 1H), 6.98 (d, J = 1.7 Hz, 2H), 4.94 (d, J = 5.5 Hz, 1H), 3.81 (s, 4H), 3.73–3.71 (m, 4H), 3.60 (t, J = 5.4 Hz, 2H), 3.51 (t, J = 5.4 Hz, 2H), 3.31 (s, 1H), 2.48 (dt, J = 3.6, 1.8 Hz, 1H), 2.37 (s, 3H). 13C NMR (100 MHz, DMSO-d6): δ 170.61, 165.25, 153.66, 153.57, 139.15, 123.62, 118.01, 117.71, 117.65, 112.90, 59.46, 56.82, 56.09, 43.61, 16.49. HRMS: m/z calculated for [C15H19N2O4]+: 291.1267, found: 291.1332. IR (KBr): 3442, 3087, 2953, 2824, 1691, 1635, 1499, 1405, 1240, 1048, 804, 692, 596 cm−1.
Synthesis of 2-(4-(2,5-dimethoxylbenzylidene)-2-methyl-5-imidazolinone)ethyl adamantane-1-carboxylate (MBIAD).
A mixture of 4-(2,5-dimethoxylbenzylidene)-1-hydroxyethyl-2-methyl-5-imidazolinone (MBHI), 1-adamantanecarboxylic acid, N-(4-pyridyl)dimethylamine (DMAP), and N,N′-dicyclohexylcarbodiimide (DCC) were stirred in 5 mL DCM for 12 h. The mixture was purified by silica gel column chromatography using acetate and petroleum ether as the solvents. Yellow solid, yield 41%. 1H NMR (400 MHz, CDCl3): δ 8.38 (d, J = 3.1 Hz, 1H), 7.65 (s, 1H), 6.93 (dd, J = 9.0, 3.1 Hz, 1H), 6.83 (d, J = 9.0 Hz, 1H), 4.24 (s, 2H), 3.88 (t, J = 5.6 Hz, 2H), 3.84 (s, 6H), 2.45 (s, 3H), 2.00 (s, 3H), 1.85 (d, J = 2.7 Hz, 6H), 1.69 (d, J = 7.9 Hz, 6H). 13C NMR (100 MHz, CDCl3): δ 177.67, 170.67, 161.54, 154.15, 153.67, 138.92, 138.12, 123.87, 121.76, 118.19, 117.29, 112.04, 61.84, 56.42, 56.01, 39.83, 39.01, 36.60, 28.04, 16.07. HRMS: m/z calculated for [C26H33N2O5]+: 453.2311, found: 453.2375. IR (KBr): 3431, 2905, 1713, 1636, 1411, 1227, 1073, 834, 690 cm−1.
2.4 Cell experiments
Cell culture and imaging.
MCF-7 cells (a human breast adenocarcinoma cell line) were seeded in flexiPERM reusable cell culture chambers in combination of glass coverslips and cultured in DMEM (Dulbecco's modified Eagle's medium) supplied with 10% FBS (fetal bovine serum) and antibiotics (50 units per mL penicillin and 50 units per mL streptomycin) at 37 °C under a humidified atmosphere containing 5% CO2. After 24 h of culture, the self-assembled complexes were added to the culture wells, and the cells were incubated at 37 °C for 30 min. After washing with PBS three times, the cells were fixed with 4% formaldehyde for 15 min at room temperature, and then the slides were mounted and observed using a Leica DMI6000B. The excitation wavelength for all samples was 405 nm.
Cytotoxicity measurements.
The cytotoxicity of the complex was determined using an MTT viability assay against MCF-7 cells. Firstly, MCF-7 cells were placed into 96-well plates at a density of 1 × 10⁴ cells per well in 200 μL medium. After 24 h, the culture medium was replaced with 200 μL of serial dilutions of aggregates. The cells were cultured for another 48 h. Then, 20 μL of 5 mg mL−1 MTT assay stock solution in PBS was added to each well. After 4 h, the medium was replaced with 200 μL of DMSO, and the absorbance was measured using a BioTek Synergy H4 at a wavelength of 490 nm.
3. Results and discussion
3.1 Synthesis of chromophores
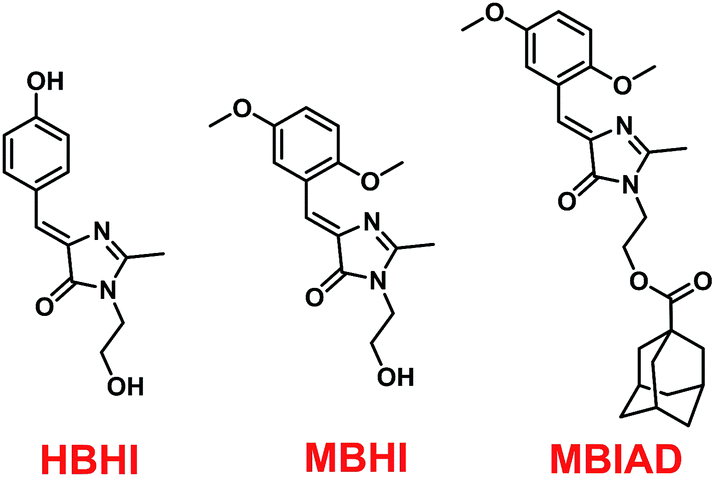
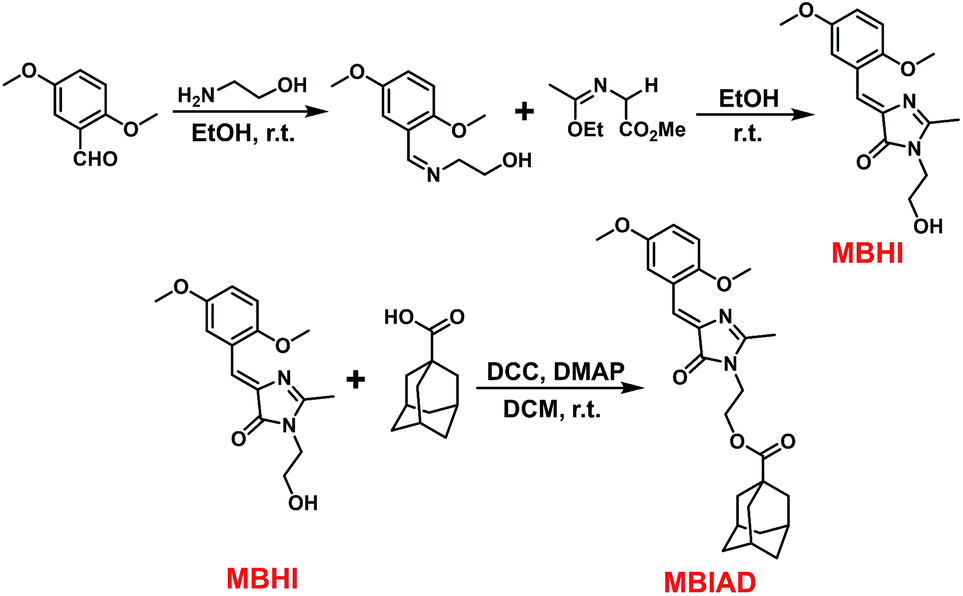
Conveniently, all chromophores were prepared by a 2 + 3 cycloaddition method with high yields. Through an esterification reaction, AD was covalently linked to MBHI to obtain MBIAD. Firstly, HBHI was designed and synthesized as a model compound of GFP core chromophore HBI, which further serves as a control for MBHI and MBIAD. To construct the self-restricted chromophore, the benzene ring of HBHI was tailored by 2,5-methoxy group to get MBHI. The molecular structures of HBHI, MBHI and MBIAD are given in Scheme 1. Synthetic procedures are shown in Scheme 2 and details of characterizations are given in the Experimental section.
 |
| | Scheme 1 The molecular structures of HBHI, MBHI and MBIAD. HBHI is used as a model compound for the GFP core chromophore. | |
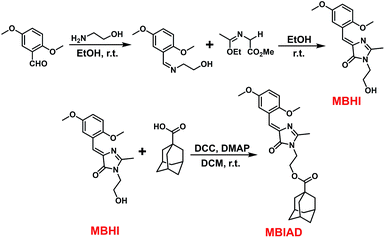 |
| | Scheme 2 The synthetic routes for MBHI and MBIAD, which involve a 2 + 3 cycloaddition followed by another esterification reaction. | |
3.2 Optical properties in fluid solutions
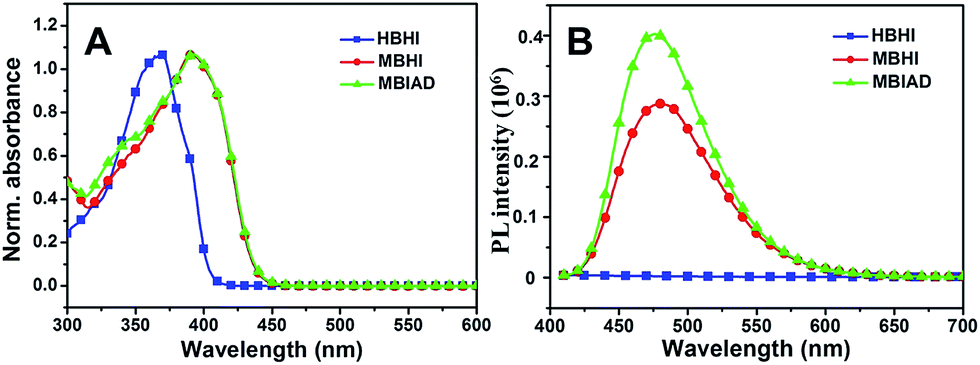
As shown in Fig. 2, the common optical properties of synthesized chromophores were tested in ethyl acetate (EA). For HBHI, the absorption peak is at around 368 nm, which redshifts to 392 nm in the case of MBHI due to the formation of the self-restricted effect. And, the absorption shows little change after conjugating to AD (MBIAD). However, with the same concentration, HBHI is almost non-emissive in EA; while self-restricted MBHI is highly emissive with an emission peak at about 475 nm, which is in agreement with reported results.35 After conjugating to AD, the emission enhances by 1.2-fold at the same concentration, which might be ascribed to the reduced hydrogen bonding effect for MBHI.
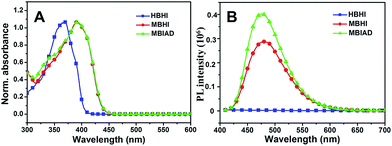 |
| | Fig. 2 The normalized UV-Vis absorption (A) and fluorescence emission spectra (B) of HBHI, MBHI and MBIAD in ethyl acetate (EA). The excitation wavelength was the corresponding absorption maximum. | |
Subsequently, the solvent dependence of absorption and emission were readily recorded in both aprotic and protic solvents. As shown in Fig. 4A, MBIAD shows an intense absorption peak at 392 nm in Hex. In aprotic solvents, the absorption spectrum and peak hardly changes from Hex to ACN. In MeOH, the absorption peak redshifts about 398 nm and the secondary absorption peak at about 347 nm strengthens due to the influence of solvent–solute hydrogen bonding.43 Generally, the absorption of MBIAD shows little dependent on solvent polarity, which obeys the same rule for that of MBHI and HBHI (Fig. 3A and S8†). However, the absorption peak of HBHI blueshifts to around 370 nm and hydrogen bonding effect has a small influence on MBHI and little influence on HBHI. Meanwhile, as shown in Fig. 4B, the emission of MBIAD displays a single peak at about 445 nm in Hex. Upon going from Hex to MeOH, the fluorescence emission peak exhibits an obvious red shift of about 100 nm from 445 nm to 542 nm, showing a remarkable solvatofluorochromism feature.35 The emission peak further redshifts in MeOH due to strong solvent–solute hydrogen bonding.43 In the case of MBHI, obvious solvatofluorochromism feature is also observed with the increasing of solvent polarity from Hex to MeOH (Fig. 3B).
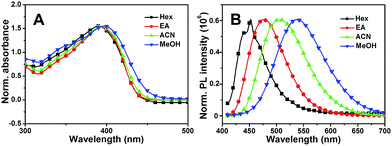 |
| | Fig. 3 The normalized UV-Vis absorption (A) and fluorescence emission spectra (B) of MBHI in various solvents from Hex to MeOH. The excitation wavelength was the corresponding absorption maximum. | |
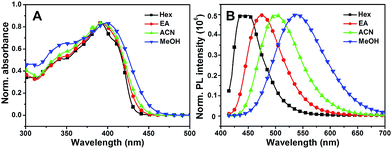 |
| | Fig. 4 The normalized UV-Vis absorption (A) and fluorescence emission spectra (B) of MBIAD in various solvents from Hex to MeOH. The excitation wavelength was the corresponding absorption maximum. | |
3.3 Fluorescent property in aggregated state
To investigate the fluorescent property in aggregated state, the emission spectra of these three chromophores were measured in mixed solvents of DMF (a good solvent) and water (a poor solvent).
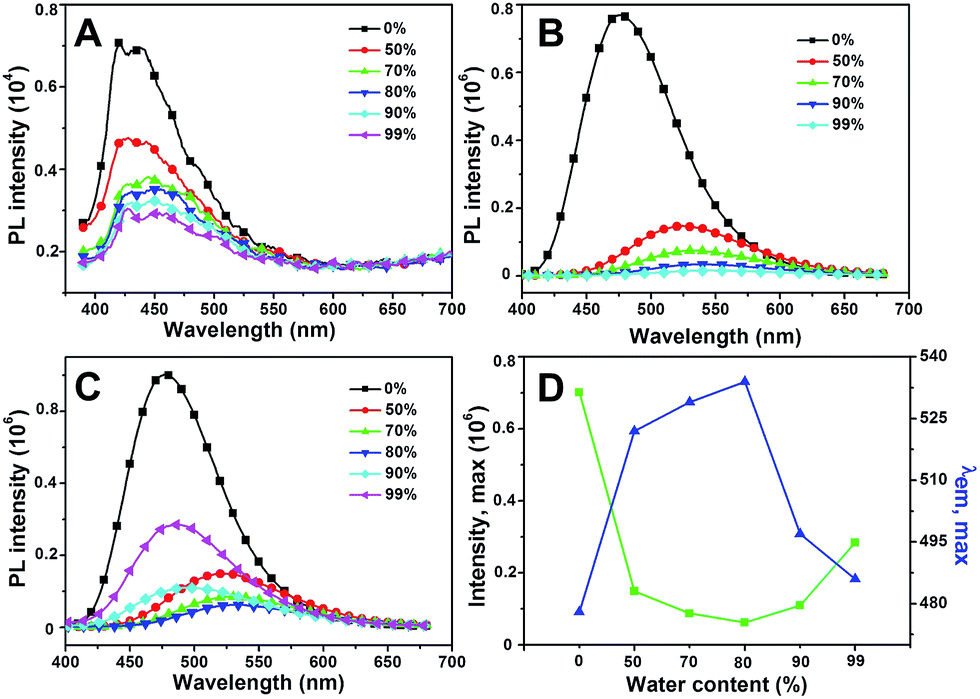
As shown in Fig. 5A, HBHI is weakly emissive in DMF, which shows two-orders of magnitude reduction compared to that of MBHI and MBIAD. With the increasing of water content in the mixed solvent, the emission further decreases due to strong π–π interaction.25 In the case of MBHI, as shown in Fig. 5B, obvious fluorescence with an emission peak at 478 nm is observed in DMF. With the increasing of water content, the fluorescence quenched heavily accompanied by large red shifts to 540 nm due to strong hydrogen bonding and π–π interaction in aggregated state. This phenomenon agrees well with the typical aggregation-caused quenching mechanism.44 For MBIAD, with the increasing of water content, the emission intensity decreases below 80% water content, which follows the same reason of strong solvent–solute H-bonding and π–π interaction; but enhances 4-fold in the cases of higher water contents with obvious blue-shift of about 47 nm (Fig. 5D), showing typical aggregation-induced emission enhancement phenomenon.13 The enhanced emission can be ascribed to the extrusion of water from the aggregates and the segregation effect of AD in the compact aggregated state, which reduces the strong H-bonding and π–π interaction greatly.
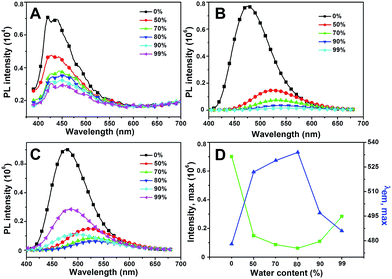 |
| | Fig. 5 The emission of (A) HBHI, (B) MBHI and (C) MBIAD in DMF/H2O mixed solvents. Water contents are given. (D) The fluorescence intensity and peak maximum changes with the increasing of water contents for MBIAD in (C). Concentration = 50 μM, λex = 400 nm. Slits: 2.4/2.4 nm. | |
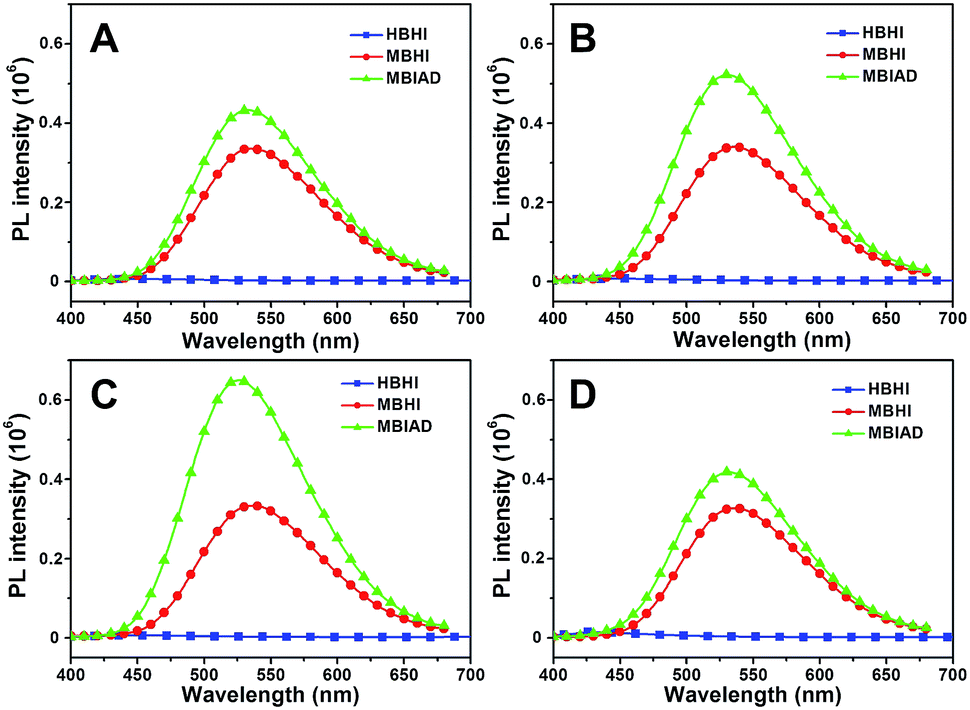
To further enhance the fluorescence emission in aggregated state, the effect of host–guest complexation between CD and AD is investigated. As depicted in Fig. 6A, HBHI is almost non-emissive. Under the same condition, the great enhancement of emission for MBHI is due to the influence of self-restricted effect and the further emission increase of MBIAD is owing to the segregation effect of AD in aggregated state. Actually, the emission in Fig. 6A serves as control experiments for the corresponding results with different kinds of CDs. As shown in Fig. 6, the fluorescence is very dim for HBHI in all cases due to the non-emissive nature and strong internal molecular interactions.45 Meanwhile, the emission intensity of MBHI hardly changes regardless of the addition of different kinds of CDs. MBHI can't interact with CD through host–guest complexation from the result of 1H NMR tests (Fig. S9†), which has little influence on the self-aggregating process of MBHI molecules. For MBIAD, the complexation with β-CD enhances the emission by 1.5-fold compared to MBHI, which is due to the segregation effect of β-CD in the aggregated state caused via the host–guest interaction. Moreover, the complexation with Me-β-CD further enhances the emission by 2.0-fold because the hydrophobic effect of Me-β-CD can better isolate the chromophore and inhibit its free conformational motion.46 However, the emission is hardly affected in the case of Ac-β-CD due to the big steric hindrance of the acetyl group which hinders the complexation between AD and CD.
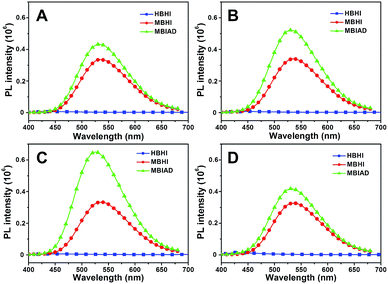 |
| | Fig. 6 Water was added dropwise to GFPc/cyclodextrin mixed solution. The emission spectra of HBHI, MBHI and MBIAD in aggregated state after complexation with different CDs: (A) without CD, control; (B) β-CD; (C) Me-β-CD; (D) Ac-β-CD. Water content is about 85% for all samples. Concentration (chromophore) = 50 μM, concentration (CD) = 100 μM. Slits: 3.2/3.2 nm. | |
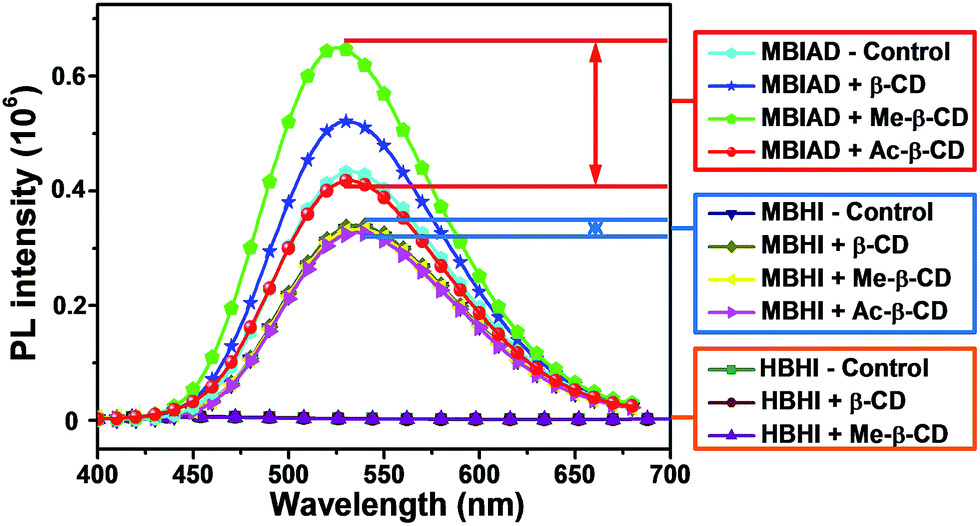
To make it clearer, the emission spectra of different chromophores with varied CDs were overlapped in Fig. 7. In all cases, the model compound of GFP chromophore, HBHI, is completely non-emissive. For MBHI, the aggregated emission enhances greatly compared to that of HBHI due to the self-restricted effect.35 However, the addition of different CDs hardly affects its emission response because the aggregated process can't be disturbed due to the lack of interactions between MBHI and CDs. In the case of MBIAD, the aggregated emission further enhances compared to that of MBHI owing to the segregation effect of AD group to the bulk chromophores. And, the complexation with β-CD further increases the emission intensity due to the better segregation effect of CD compared to that of AD.46 Meanwhile, the complexation with Me-β-CD results in the maximum emission intensity due to the hydrophobic nature of Me-β-CD. But, the addition of Ac-β-CD shows little influence compared to MBIAD control because the large steric hindrance of the acetyl group inhibits the complexation between AD and CD. Importantly, the aggregated emission enhances more than 100-fold for MBIAD–Me-β-CD complex compared to that of the GFP chromophore HBHI. Through the above results, the self-restricted effect and host–guest complexation between AD and CD are essential for the emission enhancement in aggregated state.
 |
| | Fig. 7 Comparison of the emission performance of different chromophores in aggregated state with or without different CDs. Water content is 85%, concentration (chromophore) = 50 μM, concentration (cyclodextrin) = 100 μM. Slits: 3.2/3.2 nm. | |
3.4 Tuning of aggregated emission
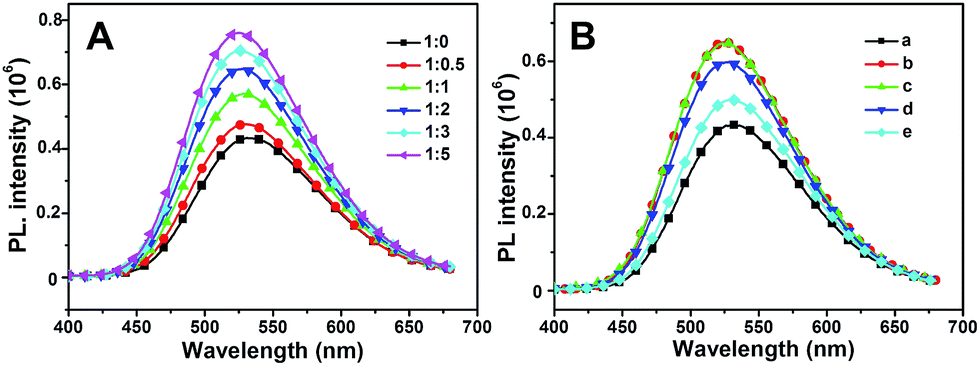
Typically, intermolecular interactions such as hydrogen bonding can also act as driving force to construct complexes.47 As shown in Fig. 8A, the aggregated emission of MBIAD in complexation with different molar ratio of Me-β-CD was further investigated. With the increase of Me-β-CD from 0 to 1 eq., the aggregated emission enhances gradually due to the increase of complexation between AD and CD. After further increase of the ratio of Me-β-CD, the aggregated emission still enhances gradually (from 1:1 to 1:5). It is generally reported that AD and CD can form complexation in a 1:1 molar ratio.48 Under higher molar ratio, the additional CD can further segregated the chromophore via molecular interactions with MBIAD–Me-β-CD complex, which will decrease π–π stacking, resulting in the further enhancement of fluorescence emission.49 Meanwhile, the fluorescence emission can also be tuned by adding different amounts of AD. As shown in Fig. 8B, the fluorescence emission decreases with the increasing of AD due to the competitive complexation of AD and MBIAD with CD. Definitely, the supramolecular host–guest complexation turns out to be a fabulous method to tune the emission response of GFP chromophore in aggregated state.
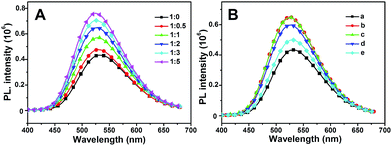 |
| | Fig. 8 (A) The emission spectra of MBIAD/Me-β-CD complex with different molar ratio of MBIAD and Me-β-CD ranging from 1:0 to 1:5. Water content is 85%, concentration (MBIAD) = 50 μM. Slits: 3.2/3.2 nm. (B) The emission spectra of MBIAD/Me-β-CD complex with different molar ratio of additional AD: (a) MBIAD, no CD, no AD; (b) n(MBIAD):n(CD) = 1:2, no AD; (c) n(MBIAD):n(CD):n(AD) = 1:2:1; (d) n(MBIAD):n(CD):n(AD) = 1:2:2; (e) n(MBIAD):n(CD):n(AD) = 1:2:5. Water content is 85%, concentration (MBIAD) = 50 μM. Slits: 3.2/3.2 nm. | |
3.5 Cell imaging
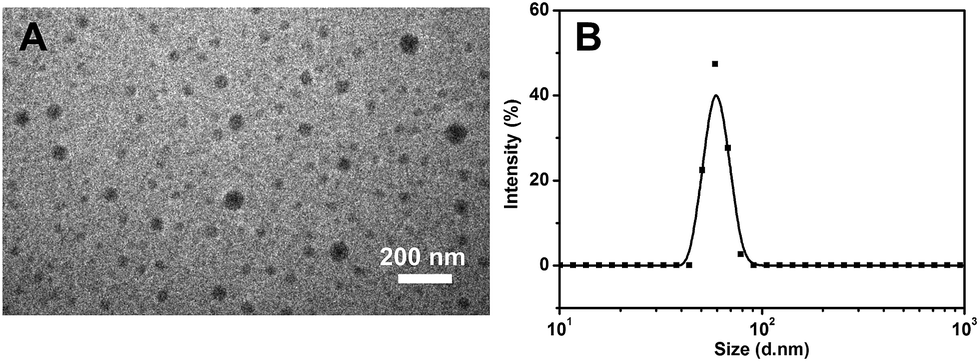
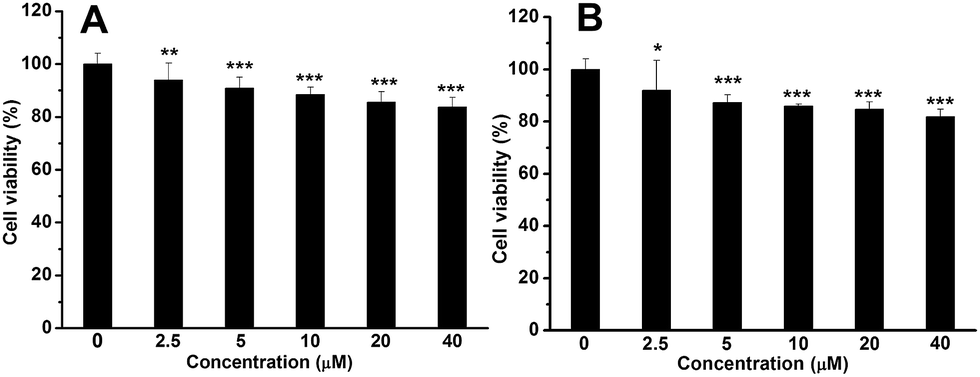
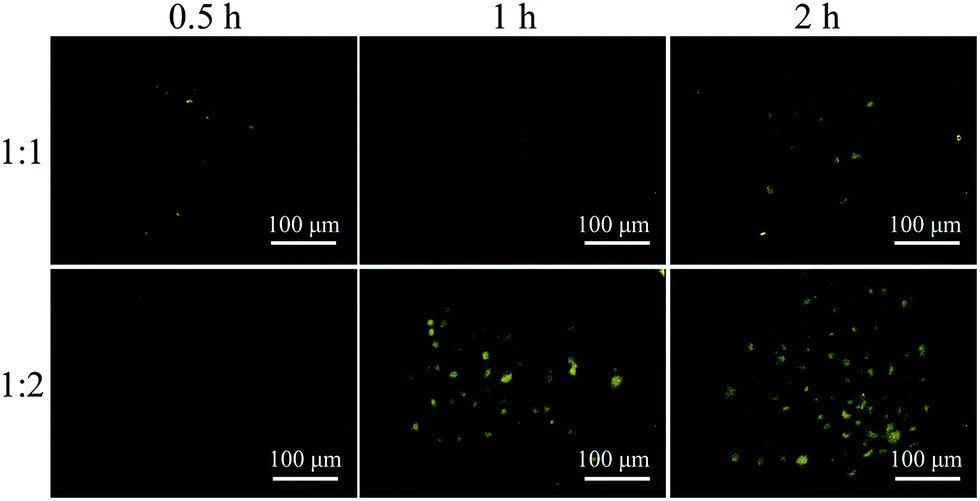
GFP has been widely used for cell imaging or tracking in biology.20 To study the possibility for cell imaging, the morphology of the assembled complex between Me-β-CD/MBIAD with a 2:1 molar ratio was firstly investigated using both TEM and DLS tests. As shown in Fig. 9, the assembled complex can form a sphere nanoparticle with a diameter of around 55 nm from both results. Considering the enhanced emission of MBIAD in aggregated state, the potential application in cell imaging was also further studied. The cytotoxicity of MBIAD–Me-β-CD complex was evaluated by MTT assay using MCF-7 cells. As shown in Fig. 10A and B, the cell viability of MCF-7 cells treated with different mole ratios and concentrations of the assembled complex demonstrate little cytotoxicity even when the concentration is up to 40 μM after co-cultured for 24 hours. Thus, the MBIAD–Me-β-CD complex can be further applied to cell imaging. As shown in Fig. 11, both complexes with a 1:1 and 1:2 molar ratio can enter into the MCF-7 cells with yellow fluorescent signals, which enhance gradually with increasing time. However, stronger yellow fluorescence with the complex of 1:2 ratio can be observed under the same condition, demonstrating the ability of MBIAD–Me-β-CD complex for cell imaging application.
 |
| | Fig. 9 The TEM image (A) and DLS measurement (B) of the assembled complex of Me-β-CD/MBIAD with a 2:1 molar ratio. The PDI of DLS result is 0.407. | |
 |
| | Fig. 10 Cell viability of MCF-7 cells treated with different concentrations of MBIAD–Me-β-CD complex (A) n(MBIAD):n(Me-β-CD) = 1:1; (B) n(MBIAD):n(Me-β-CD) = 1:2 after cultured for 24 h. P* < 0.5, P** < 0.01, P*** < 0.001. | |
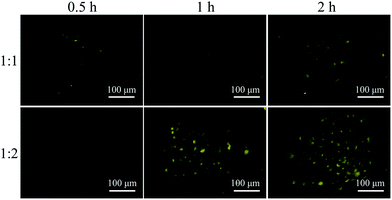 |
| | Fig. 11 Fluorescent MBIAD/Me-β-CD complex (mole rate: 1:2) for fluorescence imaging of MCF-7 cells after different incubation time. Concentration = 10 μM, λex = 405 nm. | |
4. Conclusions
In conclusion, the emission enhancement of the GFP chromophore in aggregated state has been greatly enhanced via combination of self-restricted effect and supramolecular host–guest complexation due to the inhibition of molecular motion and the reduction of π–π interaction. With the influence of supramolecular host–guest complexation, physically molecular interactions can also further enhance the aggregated emission response. Moreover, the aggregated emission can be easily tuned by changing the co-assembly constituents of CD, AD and MBIAD. Due to the enhanced emission and low cytotoxicity, the chromophore-based host–guest complex can be applied to cell imaging, raising the possibility toward chemical and biological applications using nanoaggregates derived from GFP-like fluorophores.
Acknowledgements
We are grateful to the financial support from National Basic Research Program of China (2015CB931801), National Key Research and Development Plan of China (2016YFA0201500), and National Natural Science Foundation of China (51473093).
Notes and references
- U. Panda, S. Roy, D. Mallick, P. Dalapati, S. Biswas, N. B. Manik, A. Bhattacharyya and C. Sinha, J. Lumin., 2016, 175, 44–49 CrossRef CAS.
- J. Huang, N. Sun, Y. Q. Dong, R. L. Tang, P. Lu, P. Cai, Q. Q. Li, D. G. Ma, J. G. Qin and Z. Li, Adv. Funct. Mater., 2013, 23, 2329–2337 CrossRef CAS.
- S. Ast, T. Schwarze, H. Mller, T. Kçrzdçrfer, A. Drkop and H. J. Holdt, Chem.–Eur. J., 2013, 19, 14911–14917 CrossRef CAS PubMed.
- J. Qian, Z. F. Zhu, A. J. Qin, W. Qin, L. L. Chu, F. H. Cai, H. Q. Zhang, Q. Wu, R. R. Hu, B. Z. Tang and S. L. He, Adv. Mater., 2015, 27, 2332–2339 CrossRef CAS.
- M. M. Zheng, Y. Q. Wang, H. Shi, Y. X. Hu, L. D. Feng, Z. L. Luo, M. Zhou, J. He, Z. Y. Zhou, Y. Zhang and D. J. Ye, ACS Nano, 2016, 10, 10075–10085 CrossRef CAS.
- P. Bandyopadhyay and A. K. Ghosh, J. Phys. Chem. B, 2009, 113, 13462–13464 CrossRef CAS.
- S. Yoo, J. H. Lee, B. H. Sohn, I. Eom, T. Joo, S. J. An and G. C. Yi, Adv. Funct. Mater., 2008, 18, 2984–2989 CrossRef CAS.
- W. B. Li, J. N. Zhang, Y. Zhou and P. Zhang, Chem. Commun., 2011, 47, 5834–5836 RSC.
- S. Basak, N. Nandi, A. Baral and A. Banerjee, Chem. Commun., 2015, 51, 780–783 RSC.
- V. Lau and B. Heyne, Chem. Commun., 2010, 46, 3595–3597 RSC.
- J. Dong, K. M. Solntsev and L. M. Tolbert, J. Am. Chem. Soc., 2009, 131, 662–670 CrossRef CAS.
- H. Zhou, J. S. Li, M. H. Chua, H. Yan, Q. Ye, J. Song, T. T. Lin, B. T. Zhong and J. W. Xu, Chem. Commun., 2016, 52, 12478–12481 RSC.
- J. Luo, Z. Xie, J. W. Y. Lam, L. Cheng, H. Chen, C. Qiu, H. S. Hwok, X. Zhan, Y. Liu, D. Zhu and B. Z. Tang, Chem. Commun., 2001, 18, 1740–1741 RSC.
- H. B. Shi, J. Z. Liu, J. L. Geng, B. Z. Tang and B. Liu, J. Am. Chem. Soc., 2012, 134, 9569–9572 CrossRef CAS.
- C. W. T. Leung, Y. N. Hong, S. J. Chen, E. G. Zhao, J. W. Y. Lam and B. Z. Tang, J. Am. Chem. Soc., 2013, 135, 62–65 CrossRef CAS.
- Y. Y. Yuan, R. T. K. Kwok, B. Z. Tang and B. Liu, J. Am. Chem. Soc., 2014, 136, 2546–2554 CrossRef CAS.
- A. Reisch and A. S. Klymchenko, Small, 2016, 15, 1968–1992 CrossRef.
- H. Naito, Y. Morisaki and Y. Chujo, Angew. Chem., Int. Ed., 2015, 54, 5084–5087 CrossRef CAS.
- D. S. Ma, A. A. Jaye, K. L. Ronayne, J. Nappa, S. R. Meech and P. J. Tonge, J. Am. Chem. Soc., 2008, 130, 1227–1235 CrossRef.
- S. R. Meech, Chem. Soc. Rev., 2009, 38, 2922–2934 RSC.
- A. Baldridge, S. R. Samanta, N. Jayaraj, V. Ramamurthy and L. M. Tolbert, J. Am. Chem. Soc., 2010, 132, 1498–1499 CrossRef CAS.
- N. Y. A. Baffour-Awuah and M. Zimmer, Chem. Phys., 2004, 303, 7–11 CrossRef CAS.
- J. S. Yang, G. J. Huang, Y. H. Liu and S. M. Peng, Chem. Commun., 2008, 1344–1346 RSC.
- Y. O. Jung, J. H. Lee, J. Kim, M. Schmidt, K. Moffat, V. Srajer and H. Ihee, Nat. Chem., 2013, 5, 212–220 CrossRef CAS.
- V. S. Padalkar and S. Seki, Chem. Soc. Rev., 2016, 45, 169–202 RSC.
- K. Benelhadj, J. Massue, P. Retailleau, G. Ulrich and R. Ziessel, Org. Lett., 2013, 15, 2918–2921 CrossRef CAS.
- K. Furukawa, N. Yamamoto, T. Nakabayashi, N. Ohta, K. Amimoto and H. Sekiya, Chem. Phys. Lett., 2012, 45, 539–540 Search PubMed.
- H. P. Deng and X. Y. Zhu, Materials Chemistry Frontiers, 2016 10.1039/c6qm00148c.
- H. P. Deng, Y. Su, M. X. Hu, X. Jin, L. He, Y. Pang, R. J. Dong and X. Y. Zhu, Macromolecules, 2015, 48, 5969–5979 CrossRef CAS.
- D. E. Williams, E. A. Dolgopolova, P. J. Pellechia, A. Palukoshka, T. J. Wilson, R. Tan, J. M. Maier, A. B. Greytak, M. D. Smith, J. A. Krause and N. B. Shustova, J. Am. Chem. Soc., 2015, 137, 2223–2226 CrossRef CAS.
- J. S. Paige, T. N. Duc, W. J. Song and S. R. Jaffrey, Science, 2012, 335, 1194 CrossRef CAS.
- Q. Zhou, F. C. Wu, M. Wu, Y. Tian and Z. W. Niu, Chem. Commun., 2015, 51, 15122–15124 RSC.
- L. X. Wu and K. Burgess, J. Am. Chem. Soc., 2008, 130, 4089–4096 CrossRef CAS.
- Y. H. Hsu, Y. A. Chen, H. W. Tseng, Z. Y. Zhang, J. Y. Shen, W. T. Chuang, T. C. Lin, C. S. Lee, W. Y. Hung, B. C. Hong, S. H. Liu and P. T. Chou, J. Am. Chem. Soc., 2014, 136, 11805–11812 CrossRef CAS.
- H. P. Deng, C. Y. Yu, L. D. Gong and X. Y. Zhu, J. Phys. Chem. Lett., 2016, 7, 2935–2944 CrossRef CAS PubMed.
- D. Harries, D. C. Rau and V. A. Parsegian, J. Am. Chem. Soc., 2005, 127, 2184–2190 CrossRef CAS.
- R. N. Dsouza, U. Pischel and W. M. Nau, Chem. Rev., 2011, 111, 7941–7980 CrossRef CAS PubMed.
- X. Z. Yan, F. Wang, B. Zheng and F. H. Huang, Chem. Soc. Rev., 2012, 41, 6042–6065 RSC.
- P. F. Wei, X. Z. Yan and F. H. Huang, Chem. Soc. Rev., 2015, 44, 815–832 RSC.
- R. J. Dong, Y. F. Zhou and X. Y. Zhu, Acc. Chem. Res., 2014, 47, 2006–2016 CrossRef CAS.
- J. Dong, K. M. Solntsev and L. M. Tolbert, J. Am. Chem. Soc., 2009, 131, 662–670 CrossRef CAS.
- H. P. Deng, Q. Zhu, D. L. Wang, C. L. Tu, B. S. Zhu and X. Y. Zhu, Polym. Chem., 2012, 3, 1975–1977 RSC.
- G.-J. Huang, J.-H. Ho, C. Prabhakar, Y.-H. Liu, S.-M. Peng and J.-S. Yang, Org. Lett., 2012, 14, 5034–5037 CrossRef CAS.
- R. H. Friend, R. W. Gymer, A. B. Holms, J. H. Burroughes, R. N. Marks, C. Taliani, D. D. C. Bradley, D. A. Dos Santos, J. L. Brédas, M. Lögdlund and W. R. Salaneck, Nature, 1999, 397, 121–128 CrossRef CAS.
- L. M. Tolbert, A. Baldridge, J. Kowalik and K. M. Solntsev, J. Chem. Res., 2012, 45, 171–181 CrossRef CAS PubMed.
- J. S. Park, J. N. Wilson, K. I. Hardcastle, U. H. F. Bunz and M. Srinivasarao, J. Am. Chem. Soc., 2006, 128, 7714–7715 CrossRef CAS PubMed.
- T. Aida, E. W. Meijer and S. I. Stupp, Science, 2012, 335, 813–817 CrossRef CAS PubMed.
- A. Harada, Y. Takashima and H. Yamaguchi, Chem. Soc. Rev., 2009, 38, 875–882 RSC.
- S. S. Babu, V. K. Praveen and A. Ajayaghosh, Chem. Rev., 2014, 114, 1973–2129 CrossRef CAS.
Footnote |
| † Electronic supplementary information (ESI) available. See DOI: 10.1039/c7ra00974g |
|
| This journal is © The Royal Society of Chemistry 2017 |

 Open Access Article
 This Open Access Article is licensed under a
  and
Xinyuan
Zhu
and
Xinyuan
Zhu