Designing hybrid architectures for advanced thermoelectric materials
Yun
Zheng†
a,
Yubo
Luo†
a,
Chengfeng
Du
a,
Beibei
Zhu
a,
Qinghua
Liang
a,
Huey Hoon
Hng
a,
Kedar
Hippalgaonkar
 b,
Jianwei
Xu
 b and
Qingyu
Yan
 *a
*a
aSchool of Materials Science and Engineering, Nanyang Technological University, 50 Nanyang Avenue, 639798, Singapore. E-mail: alexyan@ntu.edu.sg
bInstitute of Materials Research and Engineering, A*STAR (Agency for Science, Technology and Research), 2 Fusionopolis Way, Innovis #08-03, Singapore 138634, Singapore
First published on 14th August 2017
Abstract
In recent decades, thermoelectric materials have garnered extensive interest and shown promising applications in energy conversion. The present review demonstrates the recent progress in the design of advanced hybrid thermoelectric nanocomposites mainly prepared by solution synthesis. Then the state-of-the-art strategies have been discussed for either enhancing the power factor or reducing the thermal conductivity. In some cases, the obtained peak ZT values are comparable to or superior to those of the traditional solid-state synthesized materials. Finally, we highlight the current challenges and future opportunities in the solution-synthesized thermoelectric nanocomposites.
1. Introduction
Thermoelectric (TE) energy conversion is a promising technology to ameliorate the increasing energy crisis and environmental pollution. The performance of thermoelectric materials is quantified by the figure-of-merit ZT = α2σT/κ, where σ is the electrical conductivity, T is the absolute temperature, α is the Seebeck coefficient, and κ is the total thermal conductivity. The value of κ consists of the contributions from the lattice (κL), carriers (κe) and bipolar effect (κbi), i.e. κ = κL + κe + κbi.1,2 In recent decades, there have been great efforts in the investigation of the rational design and development of TE materials1,3–6 as well as TE modules.7–11 The conventional strategies for optimizing the ZT mainly depend on two approaches: (1) enhancing the power factor α2σ by point defect engineering,12–14 texturing15–17 and band engineering;18–20 (2) reducing the independent lattice thermal conductivity κL or bipolar diffusion κbi by heteroatom rattling,21,22 nanostructuring,23–25 interface engineering,26–28 hierarchical architecting,29–32 or developing new TE materials with intrinsically low thermal conductivity.33–38 Consequently, the peak ZT values for bulk thermoelectrics have been boosted to over 2.0 in PbTe and SnSe-based TE materials.34,39 Meanwhile, significant efforts have also been devoted to developing TE devices for energy harvesting from power plants, industrial facilities, vehicles, and wearable generators for body-powered devices.40–42 More importantly, the conversion efficiency of the TE module is approaching 12%,43 showing promising potential in large-scale power generation.Recently, hybrid architectures have attracted extensive attention in their thermoelectric applications. Herein, the term “hybrid” mainly refers to composites that consist of two or more components especially at the nanoscale. Such materials allow the rational design and feasible manipulation of microstructure and band structure to decouple the well-known interrelated relationship of α–σ–κe, which facilitates the simultaneous optimization of electrical and thermal transport properties. Up to now, it has been successfully implemented in both micron-sized bulk materials and nanocomposites prepared via powder metallurgy,44,45 hydrothermal treatment,46,47 and colloidal synthetic methods.48,49 Among all these methods, the conventional powder metallurgy has been extensively employed in the fabrication of state-of-the-art TE materials and related composites, such as group IV chalcogenides,34,50–53 Se-deficient In4Se3−δ crystals,54–56 (Bi,Sb)2(Te,Se)3 alloys,26,57–61 ternary chalcopyrites CuInTe2,13,62–64 superionic Cu2−xSe,65,66 eco-friendly Mg2(Si,Ge,Sn) solid solution,19,67–69 Zintl compounds,70–73 BiCuSeO oxides,74–76etc., owing to its scalable production capability. However, powder metallurgy often involves energy-intensive and prolonged high-temperature or high-energy processing, and provides poor regulation of the nanostructure and architecture of the resulting materials. In contrast, the solution-based chemical approach shows superiority in the following aspects:77 short synthesis period, low reaction temperature, facile regulation of morphology, and potential for scale-up. Solution-based synthesis has attracted increasing attention in the fabrication of zero-dimensional (0D),78 one-dimensional (1D),79,80 and two-dimensional (2D)81,82 inorganic TE materials as well as their hybrids and organic–inorganic composites.6 It opens a new avenue for the independent regulation of electrical and thermal transport properties by introducing quantum confinement, energy filtering, and interface engineering,83 which is difficult to achieve by the conventional powder metallurgy methods. There have been increasing interests and efforts in developing TE nanomaterials with hybrid architectures via a solution-based chemical approach in recent years, such as nanoparticle composites,49 quantum dot sensitized composites,84 dumbbell-shaped nanoparticle/nanowire composites,85 2D misfit nanocomposites,86 and organic–inorganic composites,3,40,87,88 which show tremendous potential in tailoring the electrical and thermal transport properties for the next generation of TE materials. To date, there have been a large sum of valuable reviews discussing the versatile approaches to improve the TE performance of bulk materials or to design high efficiency TE modules.24,29,30,89–93 Interested readers are recommended to refer to some of the comprehensive review papers that focus on TE material development and module design, which can help to better understand the related theories and principles from materials to modules,1,4,5,7,92,94–96 as well as polymer-based TE materials.97–102 However, few reviews have been released to discuss the development of solution-synthesized TE materials or composites.103–105 The only reported ones focus either on the synthetic strategies to improve the morphologies103 or on the comparison of TE performance between the solution-synthesized and traditional solid-state synthesized materials.104 There has been a constant lack of a review discussing the general strategies for the design of advanced TE materials with hybrid architectures, thus achieving considerable ZT values.105 In the current review, we focus on the hybrids between inorganic nanomaterials and a few hybrids between inorganic nanomaterials and organic conducting polymers. We summarize the TE materials advances by hybrid architecturing to enhance the electrical properties or to reduce the thermal conductivity. The strategies involved in these approaches are discussed, e.g. energy filtering, band engineering, minority carrier scattering, modulation doping, porosity manipulation, defect engineering, and nanoheterostructuring. Finally, the current challenges and outlook for the future development in thermoelectric nanocomposites are briefly discussed.
2. Hybrid architecturing to improve thermoelectric performance
Hybrid architecturing is a promising method employed in the TE field to optimize the electrical and thermal transport properties. It aims at either enhancing the power factor or reducing the thermal conductivity of the nanocomposites. In some cases, both benefits can be achieved simultaneously. In the following section, we will discuss the strategies and mechanisms involved to improve the TE performance in solution-synthesized materials.2.1 Enhancement of power factor
Power factor (PF) is a comprehensive parameter in evaluating the TE performance and is usually defined as| PF = α2σ = α2neμ, | (1) |
 | (2) |
J. Martin et al. found that the Ag-doped PbTe nanocrystals exhibit an enhanced Seebeck coefficient as compared to single crystal or polycrystalline PbTe with similar carrier concentrations.115 This is probably due to the dominancy of grain-boundary potential barrier scattering induced by the carrier trapping at the grain boundaries, which acts as an energy barrier to filter low-energy carriers. Moreover, similar results have been verified by B. Paul et al. who experimentally applied the concept of energy filtering in PbTe:Ag nanocomposites prepared by the solution-phase technique. The Ag-rich nanodots are embedded in a PbTe matrix and act as effective barriers at the grain boundaries, resulting in a remarkable increase in the Seebeck coefficient compared with the pristine PbTe sample.124
Dong-Kyun Ko et al. implemented energy filtering in p-type Sb2Te3 materials by the incorporation of platinum nanocrystals, which results in the band-bending potentials and an enhanced scattering of low-energy holes, as shown in Fig. 1a and b.117 The outcome of these effects is that the carrier concentration and the Seebeck coefficient exhibit 47% and 34% improvement, respectively (Fig. 1c). Consequently, an enhanced power factor can be achieved for the Pt–Sb2Te3 nanocomposites. Recently, Ag nanoparticles have been uniformly dispersed in Bi2Te3 materials to form Bi2Te3:Ag nanocomposites, as shown in Fig. 1d. The incorporated interface and defects serve as potential barriers to preferentially scatter low-energy charge carriers, thus giving rise to a significant enhancement in the Seebeck coefficient. Consequently, the Bi2Te3 samples with the addition of 1.5 vol% Ag nanoparticles present 133% increase in the power factor in comparison with the undoped ones (Fig. 1e).120
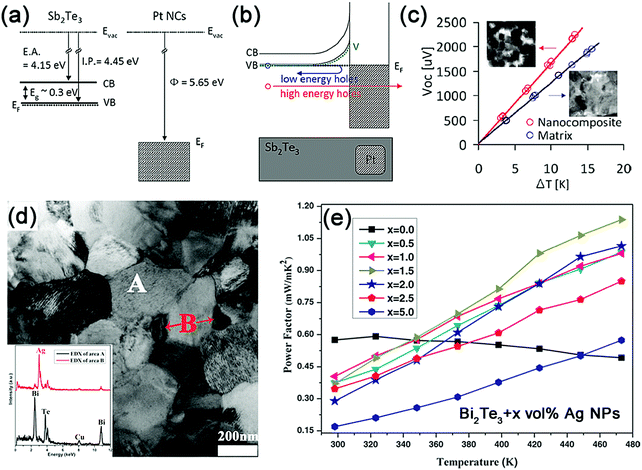 | ||
| Fig. 1 (a) Band diagram of Sb2Te3 and Pt nanocrystals before contact and (b) equilibrium band alignment in Sb2Te3–Pt nanocomposites after contact. (c) Open circuit voltage (Voc) vs. temperature difference (ΔT) for pure Sb2Te3 and nanocomposites measured at room temperature. The slope of the linear fit gives the Seebeck coefficient. Reproduced with permission.117 Copyright 2011, American Chemical Society. (d) TEM image of the bulk Bi2Te3:Ag nanocomposites. The inset shows the EDS composition of the corresponding Bi2Te3 matrix (A) and Ag nanoparticles (B). (e) Temperature dependence of the power factor for Bi2Te3:Ag bulk nanocomposites. Reproduced with permission.120 Copyright 2015, John Wiley & Sons, Inc. | ||
In addition to the extensive applications in conventional bulk inorganic materials embedded with nanoparticles, the energy filtering effect has been successfully applied to organic–inorganic composites, such as P3HT–Bi2Te3 nanocomposites,125 PEDOT:PSS composites,126–128 PANI/carbon nanotube (CNT) composites,129 and ternary graphene/polymer/inorganic nanocrystals.130 In general, when considering the implementation of energy filtering in organic–inorganic materials, the following construction strategies are recommended:125 (1) intimate attachment of nanoinclusions to the polymer matrix, (2) comparable work functions of polymers and nanomaterials to facilitate the carrier transport, and (3) incorporation of 1D nanostructures rather than 0D nanoparticles to establish potential barriers to scatter low-energy carriers more effectively.
M. He et al. incorporated Bi2Te3 nanowires (with the length of ∼5–10 μm and width of ∼50–200 μm) into poly(3-hexylthiophene) (P3HT) to form P3HT–Bi2Te3 nanocomposites. The enhanced scattering of the low-energy carriers at the P3HT–Bi2Te3 interfaces (Fig. 2a) results in a ∼400% improvement in the Seebeck coefficient, which increases from 24 μV K−1 for the pure P3HT matrix to 118 μV K−1 for 20 wt% Bi2Te3 doped P3HT. In contrast, the electrical conductivity of the P3HT–Bi2Te3 nanocomposites exhibits nearly 100% decrease as compared to that of pure P3HT. As a result, a maximum power factor of 13.6 μW m−1 K−2 at room temperature can be achieved for Bi2Te3-doped P3HT films (Fig. 2b), which is ∼250% enhancement over pristine P3HT, indicating their potential applications in flexible electronics.
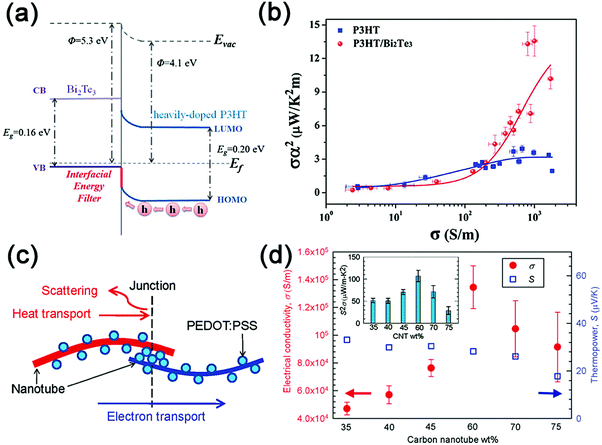 | ||
| Fig. 2 (a) The band diagram of the P3HT–Bi2Te3 interface: the nanocomposite based on the heavily doped P3HT matrix. (b) The relationship between the power factor σα2 and the electrical conductivity σ in the P3HT and P3HT–Bi2Te3 nanocomposites. Reproduced with permission.125 Copyright 2012, Royal Society of Chemistry. (c) Schematic diagram of the CNT-PEDOT:PSS-CNT junctions in the composites. This junction is supposed to facilitate electron transport while suppressing heat transport. (d) The electrical conductivity and Seebeck coefficient vs. the CNT concentration in the composites. The inset shows the power factor as a function of the CNT loading ratio. Reproduced with permission.128 Copyright 2011, American Chemical Society. | ||
As reported by C. Yu et al., the CNT-based organic composites CNT/PEDOT:PSS exhibit a large in-plane power factor of ∼160 μW m−1 K−2 and a high electrical conductivity of ∼105 Sm−1 at room temperature.128 The junctions (as shown in Fig. 2c) between the carbon nanotubes and PEDOT:PSS serve as barriers to filter low-energy electrons, keeping nearly constant thermopower (27–41 μV K−1) even when the electrical conductivity is maintained at a high value (see Fig. 2d). S. K. Yee et al. investigated the TE performance with different dispersion of tellurium nanowires in the PEDOT:PSS conducting polymer. The dispersion can be adjusted by (i) changing the nanowire morphology, (ii) applying ethylene glycol (EG) or dimethyl sulphoxide (DMSO) to modify the matrix performance,131 and (iii) tuning the relative ratio between the Te nanowires and the PEDOT:PSS matrix.127 The results indicate that incorporation of longer Te nanowires and 5 vol% DMSO infused PEDOT:PSS contributes to the highest power factor of 100 μW m−1 K−2, which is approximately five orders of magnitude higher than that of pure PEDOT:PSS. The energy filtering effect introduced by the various interfaces in the composites was believed to account for such an improvement, but further clarification on this issue had been presented later.126
In recent years, SnSe has been rediscovered as a promising TE material with a reported ZT of 2.6 and 2.0 for the n-type and p-type single crystals, respectively.34,39 Owing to its intrinsic layered structure and large Seebeck coefficient (∼520 μV K−1) and low thermal conductivity (∼0.6 W m−1 K−1) at room temperature, SnSe crystals have been exfoliated as nanosheets and integrated into PEDOT:PSS films to enhance the TE performance.132 It is noteworthy that the Seebeck coefficients of the composites deviate from the expected models and exhibit much higher values, whereas the electrical conductivities lie between the two models. This intriguing mismatch can be explained by the energy filtering introduced by the substantial nano-interfaces between SnSe and PEDOT:PSS. Apart from the aforementioned 1D nanowire–organic composites, the construction of hybrid materials by 2D inorganic nanosheets and organic components paves an alternative way to enhance the TE performance.
In addition, the energy filtering effect has been theoretically studied in semiconductor–metal nanocomposites,133,134 and Mg2Si1−xSnx solid solutions.135 Despite the advantages of energy filtering in enhancing TE performance, not all energy barriers can be beneficial to enhance the power factor. Recently, M. Bachmann et al. theoretically revealed that the double Schottky barriers in the realistic systems cannot effectively enhance the power factor.136
 | (3) |
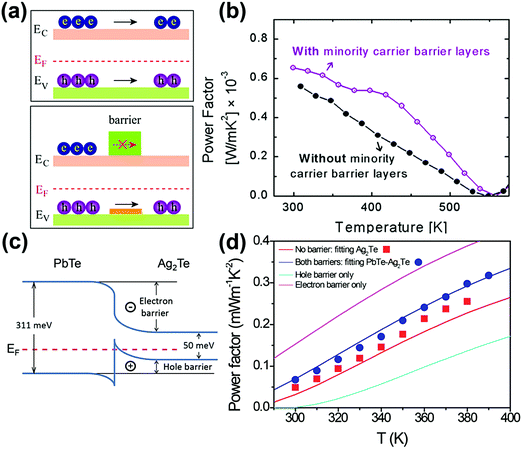 | ||
| Fig. 3 (a) The schematic diagram of the hole and electron transport in the energy band of a p-type semiconductor with and without a minority carrier barrier. Reproduced with permission.64 Copyright 2017, Elsevier Ltd. (b) Power factor comparison of InAs with and without minority carrier barriers (AlSb). Reproduced with permission.138 Copyright 2015, Elsevier Ltd. (c) The band energy difference between PbTe and Ag2Te. (d) The measured Seebeck coefficient of Ag2Te pellets with and without a PbTe barrier. Reproduced with permission.139 Copyright 2015, American Chemical Society. | ||
J. H. Bahk et al. theoretically investigated the effects of minority carrier blocking on the TE performance of Bi2Te3-based alloys, Mg2Si1−xSnx, and Si1−xGex compounds.137 The calculation is based on the near-equilibrium Boltzmann transport equations under the relaxation time approximation. The results show that the ZT values can be enhanced dramatically when the minority carriers are selectively prevented from participating in conduction, whereas the transport of majority carriers is relatively unaffected by one-side heterobarriers. P. G. Burke et al. demonstrated the beneficial effects of the p-type AlSb blocking layers to reduce the bipolar conduction of p-type InAs layers at elevated temperatures.138 This is because AlSb and InAs have similar valence band energy, whereas the conduction band energy of AlSb is much higher than that of InAs. The selected AlSb layers were grown onto InAs by molecular beam epitaxy (MBE). The Seebeck coefficient and electrical conductivity for samples with and without an AlSb barrier are similar at 300 K. But from 350 K to 500 K, the Seebeck coefficient is higher for the sample with the AlSb barrier layers, which results in almost a 100% increase in power factor at 425 K (Fig. 3b).
In addition to the aforementioned prediction and MBE layers, H. Yang et al. synthesized PbTe–Ag2Te nanowire heterostructures in the solution phase.139 As the conduction band offset of Ag2Te and PbTe is about 260 meV, PbTe becomes an effective barrier to prevent the transport of thermally activated electrons from Ag2Te (Fig. 3c). The peak Seebeck coefficient reaches 271 μV K−1 at 380 K for the PbTe–Ag2Te nanocomposite, which is more than 40% enhancement compared to that of the pristine Ag2Te (192 μV K−1) (Fig. 3d). This leads to a 17% to 38% increase in the power factor of the PbTe–Ag2Te sample. And an enhanced ZT of 0.66 at 390 K was obtained for the PbTe–Ag2Te nanocomposite. Recently, Ding et al. successfully realized the minority carrier blocking in the solution-processed PbTe/PbS nanocrystal thin films.27 The Seebeck coefficient of the resulting PbTe thin film is even higher than that of the bulk PbTe solid samples. By mixing with suitable amount of PbS, a further enhancement in the Seebeck coefficient is observed. The Seebeck coefficient of the PbTe–5%PbS sample reaches up to ∼490 μV K−1 at 405 K. In addition, C. Zhang et al. also demonstrated the minority carrier blocking in the solution-processed BixSb2−xTe3 nanocomposites by using excess tellurium-assisted liquid phase sintering.140 It is obvious that minority carrier blocking is helpful in optimizing the power factor of BixSb2−xTe3 materials. However, it is hard to clearly analyze its effect due to the concurrent introduction of the interface between the matrix and the barrier. Thus, further clarification on this issue is still necessary and urgent.
G. Tang et al. realized a high ZT value of 1.7 in phase-separated p-type Sn1−xPbxSe polycrystals prepared by the hydrothermal method.149 Owing to the small electronegativity difference between Pb (2.33)–Se (2.55) and Sn (1.99)–Se (2.55), Pb substitution was supposed to increase the hole concentration. Combined with the separated conductive PbSe phase in the SnSe matrix (Fig. 4a) arising from the solubility limit of Pb in SnSe (below 1 mol%), an enhanced power factor was achieved. Moreover, the all-scale hierarchical structures involved contributed to a significant reduction in lattice thermal conductivity. Thus, the phase-separated SnSe with 1 mol% Pb substitution can deliver a peak ZT of 1.7 parallel to the pressing direction (Fig. 4b). This value is among the highest ZT values reported for polycrystalline SnSe. Recently, the same research group used the hydrothermal method to synthesize undoped p-type SnSe crystals and demonstrated that the presence of cubic SnSe phase inside the orthorhombic SnSe matrix resulted in a high ZT value of 1.3 at 850 K.150 The relative content of cubic phase to orthorhombic phase is nearly 25%. Ascribed to the small band gap (0.22 eV) and large electronic density of states of cubic SnSe, the room-temperature hole concentration has been improved to one order of magnitude higher than that of polycrystalline SnSe prepared by a direct melting and sintering process.151 These findings also highlight that hydrothermal synthesis is a cost-effective way of producing high-performance p-type SnSe materials.
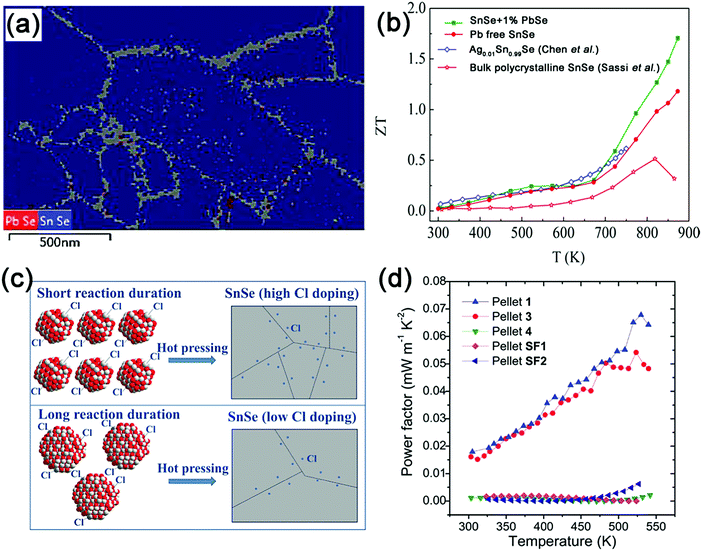 | ||
| Fig. 4 (a) Phase map of SnSe + 1% PbSe with grains identified as the PbSe cubic phase in red and Pnma orthorhombic phases in blue from transmission electron backscatter diffraction (T-EBSD) measurements; (b) temperature dependence of ZT values for the SnSe + 1% PbSe and Pb-free SnSe samples, in comparison with the Ag-doped SnSe204 and bulk polycrystalline SnSe.151 Reproduced with permission.149 Copyright 2016, American Chemical Society. (c) The schematic diagram of controlling Cl-doping concentration and nanoparticle size to synthesize n-type SnSe nanostructured pellets; (d) the power factor as a function of temperature for SnSe pellets. The legend means different Cl concentrations and synthetic conditions, as revealed in ref. 152. Reproduced with permission.152 Copyright 2017, John Wiley & Sons, Inc. | ||
Furthermore, solution-synthesized n-type SnSe has not been reported until recently. Han et al. developed an aqueous solution method to synthesize Cl-incorporated n-type SnSe nanoparticles with an individual size of 15–55 nm and >10 g quantities in one spot.152 Aqueous SnCl2 compounds serve as both the reactant and Cl source. The Cl-doping level in SnSe can be well adjusted by controlling the reaction duration (Fig. 4c). It should be noted that the solution-synthesized pure SnSe nanoparticles tend to be partially oxidized and form the SnSe2 phase in the hot pressing process (2SnSe + O2 → SnO2 + SnSe2). These two impurities will in turn reduce the electrical conductivity of n-type Cl-doped SnSe due to their wide band gap (SnO2: Eg = 3.6 eV, σ ∼ 4 S m−1 at RT,153,154 SnSe2: Eg = 1.62 eV, σ ∼ 27.8 S m−1 at RT155) and inferior conductivities. The optimized samples can achieve power factors as high as 6.8 × 10⁻⁵ W m−1 K−2 at 530 K (Fig. 4d) comparable to those of I-doped SnSe.156 Thus, it is important to minimize the oxidation behavior in the synthesis process in order to further improve the TE performance. The high-temperature oxidation behavior of SnSe has been discussed in detail in ref. 157.
Besides the many research studies focused on SnSe-related materials in recent years, Bi2Te3-based compounds have attracted continuous attention in the TE field. By substitution of Sb or Se into Bi or Te sites, respectively, Bi2−xSbxTe3 and Bi2Te3−xSex alloys have been recognized as the best p-type and n-type materials in the low-temperature range (300–500 K), and have been commercialized for applications in TE refrigeration and power generation. However, the more superior TE performance of p-type Bi2−xSbxTe3 than that of n-type Bi2Te3−xSex has restricted the overall module efficiency.96 Recently, increasing efforts have been devoted to enhancing the maximum ZT values of n-type Bi2Te3−xSex compounds produced by powder metallurgy via defect engineering,59,96 and band engineering approaches.60,158
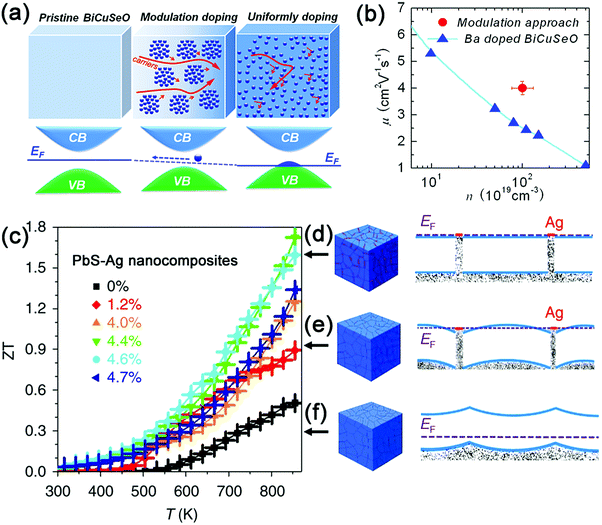 | ||
| Fig. 5 (a) Three-dimensional schematic diagram showing the band structures and Fermi energy levels for the pristine, modulation doped and uniformly doped BiCuSeO-based samples; (b) room-temperature carrier mobility as a function of carrier concentration for the uniformly doped and modulation doped Bi1–xBaxCuSeO samples. Reproduced with permission.74 Copyright 2016, American Chemical Society. (c) The temperature dependence of ZT values for pure PbS and PbS–Ag nanocomposites; (d) band alignment in PbS–Ag nanocomposite with a larger amount of Ag and flat bands across the whole PbS domains; (e) band alignment in the PbS–Ag nanocomposite with a low Ag volume fraction, showing electron energy wells in between PbS domains; (f) band alignment in pristine PbS with an upward band-bending at the PbS intergrains. Reproduced with permission.49 Copyright 2016, Nature Publishing Group. | ||
To the best of our knowledge, modulation doping has not yet been extensively exploited in colloidal nanocrystals. To date, only one publication on this topic is available. M. Ibáñez et al. used a facile bottom-up strategy to assemble colloidal nanocrystals of metallic Ag and a PbS semiconductor.49 The results show that the power factor can reach 1.68 × 10⁻³ W m−1 K−2 at 850 K for PbS nanocomposites with 4.4 mol% Ag nanocrystals. This is a six-fold improvement over pristine PbS nanocrystals and a 23–47% enhancement over PbS-based nanocomposites prepared by traditional powder metallurgy.164,165 The significant increase in the power factor of PbS–Ag nanocomposites can be attributed to the band alignment between the Ag and PbS nanocrystals (Fig. 5d–f), which results in electron injection from the Ag nanoinclusions to the PbS matrix (pristine PbS: 1 × 1016 cm−3, PbS–Ag 4.4 mol%: 3 × 1019 cm−3) as well as the improvement in the carrier mobility (pristine PbS: 20 cm2 V−1 s−1, PbS–Ag 4.4 mol%: 90 cm2 V−1 s−1). Consequently, combined with a relatively low thermal conductivity arising from the enhanced phonon scattering at the nanodomains in the PbS–Ag nanocomposites, the maximum ZT value can reach up to 1.7 at 850 K (Fig. 5c), which is comparable to the reported ZT values for other lead chalcogenides.18,165,166 Therefore, modulation doping provides an alternative and effective way to design diversified nanocomposites with high TE performance. It is noteworthy that the nanocrystal size, volume fraction, and Fermi levels of both the matrix and dopants are critical in determining whether modulation doping can play an effective role in the optimization of TE performance.
2.2 Reduction of lattice thermal conductivity
Thermal conductivity is another significant parameter in determining the TE performance of a given material. TE devices also require low thermal conductivity to reduce the parasitic transfer of heat across each leg. However, reducing thermal conductivity κ while preserving high electrical conductivity σ continues to be a vital goal in thermoelectrics. In solids, κ is mainly contributed by the electronic thermal conductivity κe and the lattice thermal conductivity κL. It can be defined as, κ = κL + κe, in which κe is estimated by the Wiedemann–Franz law, κe = LσT (L is the Lorenz number). It indicates that reducing κe may cause a decrease in σ, thus degrading the power factor and overall ZT values. Therefore, diminishing κL has been extensively attempted to realize a high ZT. It is critical to enhance the phonon scattering to reduce κL. A phonon is known as a quantized lattice vibration and it has a rather wide phonon mean free path (MFP) distribution. Fortunately, the MFP of heat-carrying phonons is mainly distributed in the submicron- and nano-scale. Therefore, nanostructuring has shown attractive power in lowering κL of traditional TE materials prepared by powder metallurgy. In contrast, solution-synthesized TE materials exhibit low κL due to the intensive phonon scattering by nanoscale grains and concomitant high boundary density.167 Despite this, further attempts have been made to reduce κL to enhance the ZT value.Solution-synthesized nanostructured TE materials often demonstrate low κL due to the enhanced phonon scattering at grain boundaries. Further reduction of the lattice thermal conductivity can be realized by the incorporation of mesopores or nanopores. The most common method to introduce nanoscale porosity is to squeeze the nanocrystal powders together by hot-pressing or rapid sintering under high pressure. Mehta et al. employed a microwave-stimulated wet-chemical technique to synthesize both n- and p-type Bi2Te3-based nanoplates.77 Combined with a cold pressing and high-vacuum annealing process, dense pellets (relative density ∼92%) can be obtained with the ZT values approaching ZT >1 at room temperature. It is mainly ascribed to the dramatic decrease in the lattice thermal conductivity induced by nanostructuring (10–100 nm grains) as well as the inter- and intragranular nanopores (5–50 nm).77 Recently, Fang et al. reported an enhanced ZT of 1.2 for PbTe–Bi2Te3 nanocomposites by tuning the composition.177 The relative densities of the hot pressed pellets are in the range of 68–76%. Thus, the noticeable porosity inside leads the reduced κL as manifested by the effective medium approximation (EMA), κL = κL0 × (1 − ϕ)3/2, where ϕ is porosity calculated from the relative density (ϕ = 1 − ρ/ρ0) and κL0 is the lattice thermal conductivity of the ideal material with no porosity.178 The same group synthesized n-type Bi2Te2.5Se0.5 hollow nanostructures by a scalable and low-temperature colloidal approach.48 Highly porous bulk nanocomposites (Fig. 6a, relative density 68–77%) were achieved in the sintering process. Benefiting from the large porosity, the lowest κtot (also refers to total thermal conductivity) and κL are 0.48 W m−1 K−1 (Fig. 6b) and 0.14 W m−1 K−1, respectively. Consequently, a highest ZT of 1.18 can be obtained at 463 K (Fig. 6c).
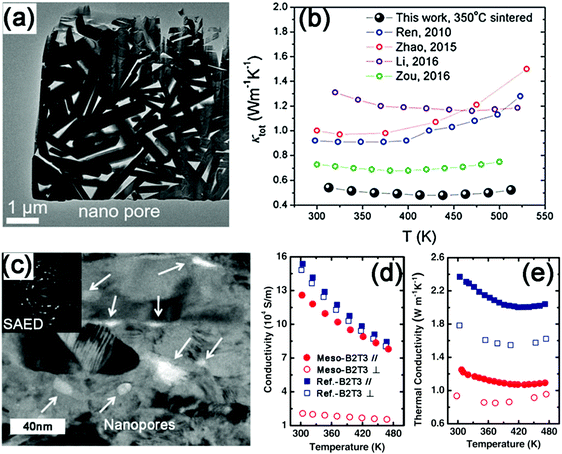 | ||
| Fig. 6 (a) TEM image of the porous Bi2Te3−xSex nanocomposites. (b) Temperature dependence of κtot on the porous nanocomposites compared with previously reported Bi2Te3−xSex materials.16,205–207 Reproduced with permission.48 Copyright 2017, John Wiley & Sons, Inc. (c) Bright field TEM image of a mesoporous Bi2Te3 pellet. The inset is the corresponding selected area electron diffraction (SAED) pattern, which indicates its polycrystalline structure. Temperature dependence of (d) the electrical conductivity and (e) the thermal conductivity of mesoporous Bi2Te3 (meso-B2T3) and fully condensed control sample (ref.-B2T3). The labels ∥ and ⊥ correspond to the direction along and perpendicular to the press, respectively. Reproduced with permission.179 Copyright 2012, John Wiley & Sons, Inc. | ||
Despite the advantages of densification-induced porosity in reducing κL, it is difficult to control the distribution and sizes of pores in the synthesis. Zhang et al. fabricated a mesoporous n-type Bi2Te3 monolith in the solution.179 The as-prepared Bi2Te3 nanocrystals demonstrate uniform mesopores with an average size of 15 nm (Fig. 6d). A portion of the originally generated mesopores can be maintained in the consolidation process (Fig. 6e). This leads to the more effective scattering of phonons than electrons. The substantial reduction in the κL (60% at RT) compensates for the loss of σ (20% at RT), as shown in Fig. 6f and g. As a consequence, a maximum ZT of 0.7 can be achieved at 480 K. Recently, porous SnSe1−xSx nanosheets have been reported for the first time.180 The SnSe1−xSx ingots were subjected to a lithiation process to obtain the exfoliated nanosheets, which were then treated with tartaric acid to achieve porous nanosheets. Combined with the nanosheet microstructure and atomic disorder from the S substitution, the introduced porosity further reduces the κL of the SnSe1−xSx samples.
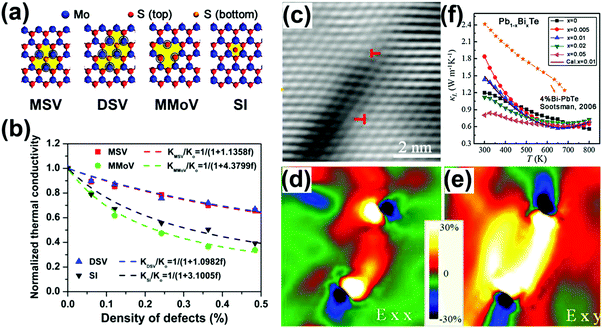 | ||
| Fig. 7 (a) Schematic of three types of defects: mono-S vacancy (MSV), double-S vacancy (DSV), mono-Mo vacancy (MMoV), and S interstitial (SI). (b) Variation of thermal conductivity of monolayer MoS2 with respect to the concentration of defects. Red rectangle: MSV; green circle: MMoV; blue triangle: DSV; black triangle: SI. The dashed lines are the fitting curves. Reproduced with permission.186 Copyright 2015, American Chemical Society. (c) A typical HRTEM image of the dislocation region from the as-sintered Pb0.99Bi0.01Te samples, (d and e) the strain maps of (c), showing strain distribution around dislocation, the color bar indicates 30 to –30% strain. (f) Temperature-dependent κL of Pb1−xBixTe samples in comparison with the 4% Bi-doped PbTe.208 Reproduced with permission.187 Copyright 2017, Elsevier Ltd. | ||
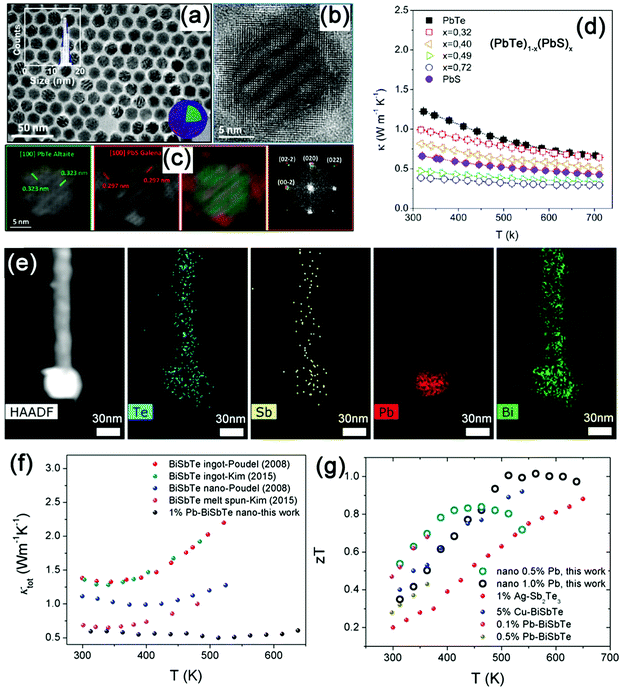 | ||
| Fig. 8 (a) Low magnification TEM images of (PbTe)0.28@(PbS)0.72 core–shell nanoparticles with crystalline PbS shells. The inset displays the histogram of the particle size distribution. (b) HRTEM images of a (PbTe)0.28@(PbS)0.72 coreshell nanoparticle. (c) Power spectrum analysis of the same (PbTe)0.28@(PbS)0.72 nanoparticle and PbTe and PbS crystallographic color maps. (d) Temperature dependence of the thermal conductivity of (PbTe)1−x(PbS)x nanomaterials. Reproduced with permission.192 Copyright 2013, American Chemical Society. (e) High-angle annular dark field-scanning transmission electron microscopy (HAADF-STEM) image and EDS elemental mapping of the 0.04 PbTe–BiSbTe–PbTe nanoheterostructure. (f) A comparison of κtot of nano-1.0% Pb–BiSbTe samples with the literature values of BiSbTe-based materials.23,209 (g) ZT of BiSbTe–PbTe samples as a function of temperature in comparison with literature values of BiSbTe-based materials. (1% Ag–Sb2Te3,210 5% Cu–Bi0.5Sb1.5Te3,211 0.1% and 0.5% Pb–Bi0.4Sb1.6Te3.212) Reproduced with permission.200 Copyright 2017, John Wiley & Sons, Inc. | ||
Yang et al. theoretically presented a generic phonon transport model to study the κL of cylindrical coordinates, i.e. silicon-germanium-based core–shell nanowires by using the phonon Boltzmann equation.194 The results indicate that the composition of the constituents and the radius of the nanowires play significant roles in regulating the κL. M. Hu et al. also predicted a significant reduction of thermal conductivity in the germanium coated silicon nanowires using non-equilibrium molecular dynamics simulations.195 The involved theoretical conclusions were verified by J. Kang et al.196 They detected an obvious reduction in the κL of Bi–Te core–shell nanowires compared with Bi nanowires, and the κL decreases with the decreasing diameter of the core–shell nanowires. Moreover, they concluded that the rough Bi–Te interface also contributes to reduced κL. Similar results have been reported in Te–Bi2Te3 core–shell nanotube heterostructures,197 Si1−xGex core–shell nanowires,198 and InN–GaN core–shell nanowires.199
In addition to the nanoparticle decoration and core–shell heterostructure architecture, barbell-like heterostructures have been designed recently. Xu et al. demonstrated a three-step solution-phase synthesis strategy to construct a barbell-like PbTe–BiSbTe–PbTe heterostructure (Fig. 8e).200 The bulk samples show a low κL of 0.74 W m−1 K−1 at 300 K (Fig. 8f), and a high ZT of ∼1.0 in 513–613 K (Fig. 8g). Likewise, Yang et al. observed a slight reduction of κL in PbTe–Ag2Te–PbTe heterostructured samples.139 This is mainly due to the intrinsically low κL of the bulk Ag2Te (0.1–0.2 W m−1 K−1). In addition, effective reduction in the κL has also been reported in the Bi2Te3–Te micro–nano-heterostructure materials.201
3. Summary and outlook
In the past decade, major advances have been achieved in the design of hybrid TE materials by implementing state-of-the-art principles and techniques. As discussed above, the solution-based chemical approach has been proven as an effective way to control the morphology of TE materials and introducing heterostructures to optimize the TE properties. In some cases, the solution-synthesized TE materials can compete with or even surpass those produced by the traditional powder metallurgy method in the TE properties, such as n-type PbS–Ag nanocomposites (ZTmax = 1.7 @ 850 K),49 n-type Bi2Te2.5Se0.5 porous nanocomposites (ZTmax = 1.18 @ 463 K),48 phase-separated Sn1−xPbxSe polycrystals (ZTmax = 1.7 @ 873 K),149 Bi0.7Sb1.3Te3–PbTe bulk nanocomposites (ZT > 1 @ 513–613 K),200etc.However, limitations still remain for the solution synthesis in terms of the following: (1) most heterostructures are based on single components or structures. A hierarchical heterostructure has been rarely explored in thermoelectrics, which retains large room for the further optimization of TE performance; (2) material diversity is restricted by the solution synthetic methods (most of the popular materials are based on metal chalcogenides); (3) retention of the microstructure is difficult after heat treatment or consolidation process (due to the inevitable crystal growth). Another consideration is to preferentially align the nanocrystals (particularly 2D nanoplates) in the consolidation process to facilitate the carrier transport. (4) Other important factors need to be considered to boost the practical application, such as large-scale production,48 reduction in the synthesis cost and processing time,202 thermal stability,203 and the rarely reported mechanical responses. On the other hand, another significant consideration is to develop organic–inorganic flexible composites for potential application in wearable electronics.97 Future research should be focused on these aspects to accelerate the design and application of solution-synthesized TE materials with high performance.
Conflicts of interest
There are no conflicts to declare.Acknowledgements
This work was financially supported by the Singapore A*STAR Pharos program SERC 1527200022, SERC 1527200018, and SERC 1527200019.References
- G. Tan, L. D. Zhao and M. G. Kanatzidis, Chem. Rev., 2016, 116, 12123–12149 CrossRef CAS PubMed.
- G. J. Snyder and E. S. Toberer, Nat. Mater., 2008, 7, 105–114 CrossRef CAS PubMed.
- J. Yang, H.-L. Yip and A. K. Y. Jen, Adv. Energy Mater., 2013, 3, 549–565 CrossRef CAS.
- W. Liu, X. Yan, G. Chen and Z. Ren, Nano Energy, 2012, 1, 42–56 CrossRef CAS.
- C. Gayner and K. K. Kar, Prog. Mater. Sci., 2016, 83, 330–382 CrossRef CAS.
- N. Toshima, Synth. Met., 2017, 225, 3–21 CrossRef CAS.
- M. Zebarjadi, K. Esfarjani, M. Dresselhaus, Z. Ren and G. Chen, Energy Environ. Sci., 2012, 5, 5147–5162 Search PubMed.
- Q. H. Zhang, X. Y. Huang, S. Q. Bai, X. Shi, C. Uher and L. D. Chen, Adv. Eng. Mater., 2016, 18, 194–213 CrossRef CAS.
- D. K. Aswal, R. Basu and A. Singh, Energy Convers. Manage., 2016, 114, 50–67 CrossRef.
- D. Kraemer, Q. Jie, K. McEnaney, F. Cao, W. Liu, L. A. Weinstein, J. Loomis, Z. Ren and G. Chen, Nat. Energy, 2016, 1, 16153 CrossRef CAS.
- X. Hu, P. Jood, M. Ohta, M. Kunii, K. Nagase, H. Nishiate, M. G. Kanatzidis and A. Yamamoto, Energy Environ. Sci., 2016, 9, 517–529 CAS.
- T. Zhu, L. Hu, X. Zhao and J. He, Adv. Sci., 2016, 3, 1600004 CrossRef PubMed.
- Y. Luo, J. Yang, Q. Jiang, W. Li, Y. Xiao, L. Fu, D. Zhang, Z. Zhou and Y. Cheng, Nano Energy, 2015, 18, 37–46 CrossRef CAS.
- B. R. Ortiz, P. Gorai, V. Stevanović and E. S. Toberer, Chem. Mater., 2017, 29, 4523–4534 CrossRef CAS.
- Y. Fu, J. Xu, G.-Q. Liu, J. Yang, X. Tan, Z. Liu, H. Qin, H. Shao, H. Jiang and B. Liang, J. Mater. Chem. C, 2016, 4, 1201–1207 RSC.
- Y. Pan and J.-F. Li, NPG Asia Mater., 2016, 8, e275 CrossRef CAS.
- Y. Luo, J. Yang, Q. Jiang, L. Fu, Y. Xiao, W. Li, D. Zhang, Z. Zhou and Y. Cheng, Nano Energy, 2015, 15, 709–718 CrossRef CAS.
- Y. Pei, X. Shi, A. LaLonde, H. Wang, L. Chen and G. J. Snyder, Nature, 2011, 473, 66–69 CrossRef CAS PubMed.
- W. Liu, X. Tan, K. Yin, H. Liu, X. Tang, J. Shi, Q. Zhang and C. Uher, Phys. Rev. Lett., 2012, 108, 166601 CrossRef PubMed.
- Y. Pei, H. Wang and G. Snyder, Adv. Mater., 2012, 24, 6125–6135 CrossRef CAS PubMed.
- B. Duan, J. Yang, J. R. Salvador, Y. He, B. Zhao, S. Wang, P. Wei, F. S. Ohuchi, W. Zhang, R. P. Hermann, O. Gourdon, S. X. Mao, Y. Cheng, C. Wang, J. Liu, P. Zhai, X. Tang, Q. Zhang and J. Yang, Energy Environ. Sci., 2016, 9, 2090–2098 CAS.
- D. Zhang, J. Yang, Q. Jiang, Z. Zhou, X. Li, J. Xin, A. Basit, Y. Ren and X. He, Nano Energy, 2017, 36, 156–165 CrossRef CAS.
- B. Poudel, Q. Hao, Y. Ma, Y. Lan, A. Minnich, B. Yu, X. Yan, D. Wang, A. Muto, D. Vashaee, X. Chen, J. Liu, M. S. Dresselhaus, G. Chen and Z. Ren, Science, 2008, 320, 634–638 CrossRef CAS PubMed.
- A. J. Minnich, M. S. Dresselhaus, Z. F. Ren and G. Chen, Energy Environ. Sci., 2009, 2, 466–479 CAS.
- W. Xie, J. He, H. J. Kang, X. Tang, S. Zhu, M. Laver, S. Wang, J. R. D. Copley, C. M. Brown, Q. Zhang and T. M. Tritt, Nano Lett., 2010, 10, 3283–3289 CrossRef CAS PubMed.
- Y. Luo, J. Yang, Q. Jiang, W. Li, D. Zhang, Z. Zhou, Y. Cheng, Y. Ren and X. He, Acta Mater., 2017, 127, 185–191 CrossRef CAS.
- D. Ding, D. Wang, M. Zhao, J. Lv, H. Jiang, C. Lu and Z. Tang, Adv. Mater., 2017, 29, 1603444 CrossRef PubMed.
- Q. Jiang, J. Yang, Y. Liu and H. He, J. Adv. Dielectr., 2016, 6, 1630002 CrossRef CAS.
- J. He, M. G. Kanatzidis and V. P. Dravid, Mater. Today, 2013, 16, 166–176 CrossRef CAS.
- L.-D. Zhao, V. P. Dravid and M. G. Kanatzidis, Energy Environ. Sci., 2014, 7, 251–268 CAS.
- K. Biswas, J. He, I. D. Blum, C.-I. Wu, T. P. Hogan, D. N. Seidman, V. P. Dravid and M. G. Kanatzidis, Nature, 2012, 489, 414–418 CrossRef CAS PubMed.
- X. Su, P. Wei, H. Li, W. Liu, Y. Yan, P. Li, C. Su, C. Xie, W. Zhao, P. Zhai, Q. Zhang, X. Tang and C. Uher, Adv. Mater., 2017, 29, 1602013 CrossRef PubMed.
- D. Morelli, V. Jovovic and J. Heremans, Phys. Rev. Lett., 2008, 101, 035901 CrossRef CAS PubMed.
- L.-D. Zhao, S.-H. Lo, Y. Zhang, H. Sun, G. Tan, C. Uher, C. Wolverton, V. P. Dravid and M. G. Kanatzidis, Nature, 2014, 508, 373–377 CrossRef CAS PubMed.
- B. Du, K. Chen, H. Yan and M. J. Reece, Scr. Mater., 2016, 111, 49–53 CrossRef CAS.
- Y.-L. Pei, J. He, J.-F. Li, F. Li, Q. Liu, W. Pan, C. Barreteau, D. Berardan, N. Dragoe and L.-D. Zhao, NPG Asia Mater., 2013, 5, e47 CrossRef CAS.
- M. K. Jana, K. Pal, A. Warankar, P. Mandal, U. V. Waghmare and K. Biswas, J. Am. Chem. Soc., 2017, 139, 4350–4353 CrossRef CAS PubMed.
- G. Tan, S. Hao, J. Zhao, C. Wolverton and M. G. Kanatzidis, J. Am. Chem. Soc., 2017, 139, 6467–6473 CrossRef CAS PubMed.
- L.-D. Zhao, G. Tan, S. Hao, J. He, Y. Pei, H. Chi, H. Wang, S. Gong, H. Xu and V. P. Dravid, Science, 2016, 351, 141–144 CrossRef CAS PubMed.
- C. Wan, R. Tian, A. B. Azizi, Y. Huang, Q. Wei, R. Sasai, S. Wasusate, T. Ishida and K. Koumoto, Nano Energy, 2016, 30, 840–845 CrossRef CAS.
- J.-H. Bahk, H. Fang, K. Yazawa and A. Shakouri, J. Mater. Chem. C, 2015, 3, 10362–10374 RSC.
- W. Liu, Q. Jie, H. S. Kim and Z. Ren, Acta Mater., 2015, 87, 357–376 CrossRef CAS.
- Q. Zhang, J. Liao, Y. Tang, M. Gu, C. Ming, P. Qiu, S. Bai, X. Shi, C. Uher and L. Chen, Energy Environ. Sci., 2017, 10, 956–963 CAS.
- X. Zhou, G. Wang, L. Guo, H. Chi, G. Wang, Q. Zhang, C. Chen, T. Thompson, J. Sakamoto and V. P. Dravid, J. Mater. Chem. A, 2014, 2, 20629–20635 CAS.
- S. Butt, W. Xu, M. U. Farooq, G. K. Ren, F. Mohmed, Y. Lin and C. W. Nan, J. Am. Ceram. Soc., 2015, 98, 1230–1235 CrossRef CAS.
- C.-J. Liu, H. C. Lai, Y.-L. Liu and L.-R. Chen, J. Mater. Chem., 2012, 22, 4825 RSC.
- X. B. Zhao, X. H. Ji, Y. H. Zhang, T. J. Zhu, J. P. Tu and X. B. Zhang, Appl. Phys. Lett., 2005, 86, 062111 CrossRef.
- B. Xu, T. Feng, M. T. Agne, L. Zhou, X. Ruan, G. J. Snyder and Y. Wu, Angew. Chem., Int. Ed., 2017, 56, 3546–3551 CrossRef CAS PubMed.
- M. Ibáñez, Z. Luo, A. Genç, L. Piveteau, S. Ortega, D. Cadavid, O. Dobrozhan, Y. Liu, M. Nachtegaal, M. Zebarjadi, J. Arbiol, M. V. Kovalenko and A. Cabot, Nat. Commun., 2016, 7, 10766 CrossRef PubMed.
- J. P. Heremans, V. Jovovic, E. S. Toberer, A. Saramat, K. Kurosaki, A. Charoenphakdee, S. Yamanaka and G. J. Snyder, Science, 2008, 321, 554–557 CrossRef CAS PubMed.
- G. Tan, L. D. Zhao, F. Shi, J. W. Doak, S. H. Lo, H. Sun, C. Wolverton, V. P. Dravid, C. Uher and M. G. Kanatzidis, J. Am. Chem. Soc., 2014, 136, 7006–7017 CrossRef CAS PubMed.
- Q. Zhang, E. K. Chere, K. McEnaney, M. Yao, F. Cao, Y. Ni, S. Chen, C. Opeil, G. Chen and Z. Ren, Adv. Energy Mater., 2015, 5, 1401977 CrossRef.
- Y. Zheng, S. Wang, W. Liu, Z. Yin, H. Li, X. Tang and C. Uher, J. Phys. D: Appl. Phys., 2014, 47, 115303 CrossRef.
- J.-S. Rhyee, K. H. Lee, S. M. Lee, E. Cho, S. I. Kim, E. Lee, Y. S. Kwon, J. H. Shim and G. Kotliar, Nature, 2009, 459, 965–968 CrossRef CAS PubMed.
- Y. Luo, J. Yang, G. Li, M. Liu, Y. Xiao, L. Fu, W. Li, P. Zhu, J. Peng, S. Gao and J. Zhang, Adv. Energy Mater., 2014, 4, 1300599 CrossRef.
- Y. Luo, J. Yang, M. Liu, Y. Xiao, L. Fu, W. Li, D. Zhang, M. Zhang and Y. Cheng, J. Mater. Chem. A, 2015, 3, 1251–1257 CAS.
- Y. Zheng, Q. Zhang, X. Su, H. Xie, S. Shu, T. Chen, G. Tan, Y. Yan, X. Tang, C. Uher and G. J. Snyder, Adv. Energy Mater., 2015, 5, 1401391 CrossRef.
- G. Zheng, X. Su, T. Liang, Q. Lu, Y. Yan, C. Uher and X. Tang, J. Mater. Chem. A, 2015, 3, 6603–6613 CAS.
- L. Hu, T. Zhu, X. Liu and X. Zhao, Adv. Funct. Mater., 2014, 24, 5211–5218 CrossRef CAS.
- S. Wang, Y. Sun, J. Yang, B. Duan, L. Wu, W. Zhang and J. Yang, Energy Environ. Sci., 2016, 9, 3436–3447 CAS.
- Y. Luo, J. Yang, Q. Jiang, W. Li, L. Fu, Y. Xiao, D. Zhang, Z. Zhou and Y. Cheng, Intermetallics, 2016, 72, 62–68 CrossRef CAS.
- Y. Luo, J. Yang, Q. Jiang, W. Li, D. Zhang, Z. Zhou, Y. Cheng, Y. Ren and X. He, Adv. Energy Mater., 2016, 6, 1600007 CrossRef.
- R. Liu, L. Xi, H. Liu, X. Shi, W. Zhang and L. Chen, Chem. Commun., 2012, 48, 3818–3820 RSC.
- Y. Luo, Q. Jiang, J. Yang, W. Li, D. Zhang, Z. Zhou, Y. Cheng, Y. Ren, X. He and X. Li, Nano Energy, 2017, 32, 80–87 CrossRef CAS.
- X. Su, F. Fu, Y. Yan, G. Zheng, T. Liang, Q. Zhang, X. Cheng, D. Yang, H. Chi, X. Tang, Q. Zhang and C. Uher, Nat. Commun., 2014, 5, 4908 CrossRef CAS PubMed.
- H. Liu, X. Shi, F. Xu, L. Zhang, W. Zhang, L. Chen, Q. Li, C. Uher, T. Day and G. J. Snyder, Nat. Mater., 2012, 11, 422–425 CrossRef CAS PubMed.
- W. Liu, H. S. Kim, S. Chen, Q. Jie, B. Lv, M. Yao, Z. Ren, C. P. Opeil, S. Wilson and C.-W. Chu, Proc. Natl. Acad. Sci. U. S. A., 2015, 112, 3269–3274 CrossRef CAS PubMed.
- Q. Zhang, X. Su, Y. Yan, H. Xie, T. Liang, Y. You, X. Tang and C. Uher, ACS Appl. Mater. Interfaces, 2016, 8, 3268–3276 CAS.
- W. Liu, K. Yin, Q. Zhang, C. Uher and X. Tang, Natl. Sci. Rev., 2017 DOI:10.1093/nsr/nwx011.
- J. Zhang, L. Song, S. H. Pedersen, H. Yin, L. T. Hung and B. B. Iversen, Nat. Commun., 2017, 8, 13901 CrossRef CAS PubMed.
- H. Tamaki, H. K. Sato and T. Kanno, Adv. Mater., 2016, 28, 10182–10187 CrossRef CAS PubMed.
- E. S. Toberer, A. Zevalkink, N. Crisosto and G. J. Snyder, Adv. Funct. Mater., 2010, 20, 4375–4380 CrossRef CAS.
- E. S. Toberer, A. F. May and G. J. Snyder, Chem. Mater., 2010, 22, 624–634 CrossRef CAS.
- Y. Pei, H. Wu, D. Wu, F. Zheng and J. He, J. Am. Chem. Soc., 2014, 136, 13902–13908 CrossRef CAS PubMed.
- F. Li, J.-F. Li, L.-D. Zhao, K. Xiang, Y. Liu, B.-P. Zhang, Y.-H. Lin, C.-W. Nan and H.-M. Zhu, Energy Environ. Sci., 2012, 5, 7188–7195 CAS.
- G. Ren, S. Wang, Y. Zhu, K. J. Ventura, X. Tan, W. Xu, Y. Lin, J. Yang and C. Nan, Energy Environ. Sci., 2017, 10, 1590–1599 CAS.
- R. J. Mehta, Y. Zhang, C. Karthik, B. Singh, R. W. Siegel, T. Borca-Tasciuc and G. Ramanath, Nat. Mater., 2012, 11, 233–240 CrossRef CAS PubMed.
- W. Zhou, J. Zhu, D. Li, H. H. Hng, F. Y. C. Boey, J. Ma, H. Zhang and Q. Yan, Adv. Mater., 2009, 21, 3196–3200 CrossRef CAS.
- Q. Yan, H. Chen, W. Zhou, H. H. Hng, F. Y. C. Boey and J. Ma, Chem. Mater., 2008, 20, 6298–6300 CrossRef CAS.
- W. Zhao, S. Fan, N. Xiao, D. Liu, Y. Y. Tay, C. Yu, D. Sim, H. H. Hng, Q. Zhang, F. Boey, J. Ma, X. Zhao, H. Zhang and Q. Yan, Energy Environ. Sci., 2012, 5, 5364–5369 CAS.
- Z. Zeng, T. Sun, J. Zhu, X. Huang, Z. Yin, G. Lu, Z. Fan, Q. Yan, H. H. Hng and H. Zhang, Angew. Chem., Int. Ed., 2012, 51, 9052–9056 CrossRef CAS PubMed.
- Y. Zhang, Y. Zheng, K. Rui, H. H. Hng, K. Hippalgaonkar, J. Xu, W. Sun, J. Zhu, Q. Yan and W. Huang, Small, 2017, 13, 1700661 CrossRef PubMed.
- M. S. Dresselhaus, G. Chen, M. Y. Tang, R. G. Yang, H. Lee, D. Z. Wang, Z. F. Ren, J. P. Fleurial and P. Gogna, Adv. Mater., 2007, 19, 1043–1053 CrossRef CAS.
- S. Li, T. Fan, X. Liu, F. Liu, H. Meng, Y. Liu and F. Pan, ACS Appl. Mater. Interfaces, 2017, 9, 3677–3685 CAS.
- Z. He, Y. Yang, J.-W. Liu and S.-H. Yu, Chem. Soc. Rev., 2017, 46, 2732–2753 RSC.
- Z. Lin, A. Yin, J. Mao, Y. Xia, N. Kempf, Q. He, Y. Wang, C.-Y. Chen, Y. Zhang, V. Ozolins, Z. Ren, Y. Huang and X. Duan, Sci. Adv., 2016, 2, e1600993 Search PubMed.
- T. Zhang, K. Li, C. Li, S. Ma, H. H. Hng and L. Wei, Adv. Electron. Mater., 2017, 3, 1600554 CrossRef.
- C. Wan, X. Gu, F. Dang, T. Itoh, Y. Wang, H. Sasaki, M. Kondo, K. Koga, K. Yabuki, G. J. Snyder, R. Yang and K. Koumoto, Nat. Mater., 2015, 14, 622–627 CrossRef CAS PubMed.
- J.-F. Li, W.-S. Liu, L.-D. Zhao and M. Zhou, NPG Asia Mater., 2010, 2, 152–158 CrossRef.
- A. Shakouri, Annu. Rev. Mater. Res., 2011, 41, 399–431 CrossRef CAS.
- J. R. Szczech, J. M. Higgins and S. Jin, J. Mater. Chem., 2011, 21, 4037–4055 RSC.
- T. M. Tritt, Annu. Rev. Mater. Res., 2011, 41, 433–448 CrossRef CAS.
- X. Zhang and L.-D. Zhao, J. Materiomics, 2015, 1, 92–105 CrossRef.
- Z.-G. Chen, G. Han, L. Yang, L. Cheng and J. Zou, Prog. Nat. Sci.: Mater. Int., 2012, 22, 535–549 CrossRef.
- H. Alam and S. Ramakrishna, Nano Energy, 2013, 2, 190–212 CrossRef CAS.
- T. Zhu, Y. Liu, C. Fu, J. P. Heremans, J. G. Snyder and X. Zhao, Adv. Mater., 2017, 29, 1605884 CrossRef PubMed.
- Y. Chen, Y. Zhao and Z. Liang, Energy Environ. Sci., 2015, 8, 401–422 CAS.
- M. He, F. Qiu and Z. Lin, Energy Environ. Sci., 2013, 6, 1352–1361 Search PubMed.
- Y. Du, S. Z. Shen, K. Cai and P. S. Casey, Prog. Polym. Sci., 2012, 37, 820–841 CrossRef CAS.
- O. Bubnova and X. Crispin, Energy Environ. Sci., 2012, 5, 9345–9362 CAS.
- Q. Wei, M. Mukaida, K. Kirihara, Y. Naitoh and T. Ishida, Materials, 2015, 8, 732–750 CrossRef PubMed.
- C. Gao and G. Chen, Compos. Sci. Technol., 2016, 124, 52–70 CrossRef CAS.
- Y. Zhao, J. S. Dyck and C. Burda, J. Mater. Chem., 2011, 21, 17049–17058 RSC.
- S. W. Finefrock, H. Yang, H. Fang and Y. Wu, Annu. Rev. Chem. Biomol. Eng., 2015, 6, 247–266 CrossRef CAS PubMed.
- W. Zheng, B. Xu, L. Zhou, Y. Zhou, H. Zheng, C. Sun, E. Shi, T. D. Fink and Y. Wu, Nano Res., 2017, 10, 1498–1509 CrossRef.
- M. Cutler, J. Leavy and R. Fitzpatrick, Phys. Rev., 1964, 133, A1143 CrossRef.
- Q. Zhang, B. Liao, Y. Lan, K. Lukas, W. Liu, K. Esfarjani, C. Opeil, D. Broido, G. Chen and Z. Ren, Proc. Natl. Acad. Sci. U. S. A., 2013, 110, 13261–13266 CrossRef CAS PubMed.
- D. Zhang, J. Yang, Q. Jiang, L. Fu, Y. Xiao, Y. Luo and Z. Zhou, Mater. Des., 2016, 98, 150–154 CrossRef CAS.
- L. Fu, Q. Jiang, J. Yang, J. Peng, Y. Xiao, Y. Luo, Z. Zhou and D. Zhang, J. Mater. Chem. A, 2016, 4, 16499–16506 CAS.
- C. Xiao, Z. Li, K. Li, P. Huang and Y. Xie, Acc. Chem. Res., 2014, 47, 1287–1295 CrossRef CAS PubMed.
- C. Dun, C. A. Hewitt, H. Huang, J. Xu, C. Zhou, W. Huang, Y. Cui, W. Zhou, Q. Jiang and D. L. Carroll, Nano Energy, 2015, 18, 306–314 CrossRef CAS.
- A. Mehdizadeh Dehkordi, M. Zebarjadi, J. He and T. M. Tritt, Mater. Sci. Eng., 2015, 97, 1–22 Search PubMed.
- J. Heremans, C. Thrush and D. Morelli, Phys. Rev. B: Condens. Matter Mater. Phys., 2004, 70, 115334 CrossRef.
- J. P. Heremans, C. M. Thrush and D. T. Morelli, J. Appl. Phys., 2005, 98, 063703 CrossRef.
- J. Martin, L. Wang, L. Chen and G. S. Nolas, Phys. Rev. B: Condens. Matter Mater. Phys., 2009, 79, 115311 CrossRef.
- G. Joshi, H. Lee, Y. Lan, X. Wang, G. Zhu, D. Wang, R. W. Gould, D. C. Cuff, M. Y. Tang and M. S. Dresselhaus, Nano Lett., 2008, 8, 4670–4674 CrossRef CAS PubMed.
- D. K. Ko, Y. Kang and C. B. Murray, Nano Lett., 2011, 11, 2841–2844 CrossRef CAS PubMed.
- A. Soni, Y. Shen, M. Yin, Y. Zhao, L. Yu, X. Hu, Z. Dong, K. A. Khor, M. S. Dresselhaus and Q. Xiong, Nano Lett., 2012, 12, 4305–4310 CrossRef CAS PubMed.
- Y. C. Dou, X. Y. Qin, D. Li, L. L. Li, T. H. Zou and Q. Q. Wang, J. Appl. Phys., 2013, 114, 044906 CrossRef.
- Q. Zhang, X. Ai, L. Wang, Y. Chang, W. Luo, W. Jiang and L. Chen, Adv. Funct. Mater., 2015, 25, 966–976 CrossRef CAS.
- T. H. Zou, X. Y. Qin, D. Li, B. J. Ren, G. L. Sun, Y. C. Dou, Y. Y. Li, L. L. Li, J. Zhang and H. X. Xin, J. Appl. Phys., 2014, 115, 053710 CrossRef.
- J. M. O. Zide, D. Vashaee, Z. X. Bian, G. Zeng, J. E. Bowers, A. Shakouri and A. C. Gossard, Phys. Rev. B: Condens. Matter Mater. Phys., 2006, 74, 205335 CrossRef.
- L. Wang, Q. Yao, W. Shi, S. Qu and L. Chen, Mater. Chem. Front., 2017, 1, 741–748 RSC.
- B. Paul, A. Kumar V and P. Banerji, J. Appl. Phys., 2010, 108, 064322 CrossRef.
- M. He, J. Ge, Z. Lin, X. Feng, X. Wang, H. Lu, Y. Yang and F. Qiu, Energy Environ. Sci., 2012, 5, 8351–8358 CAS.
- N. E. Coates, S. K. Yee, B. McCulloch, K. C. See, A. Majumdar, R. A. Segalman and J. J. Urban, Adv. Mater., 2013, 25, 1629–1633 CrossRef CAS PubMed.
- S. K. Yee, N. E. Coates, A. Majumdar, J. J. Urban and R. A. Segalman, Phys. Chem. Chem. Phys., 2013, 15, 4024–4032 RSC.
- C. Yu, K. Choi, L. Yin and J. C. Grunlan, ACS Nano, 2011, 5, 7885–7892 CrossRef CAS PubMed.
- C. Meng, C. Liu and S. Fan, Adv. Mater., 2010, 22, 535–539 CrossRef CAS PubMed.
- J. Choi, J. Y. Lee, S.-S. Lee, C. R. Park and H. Kim, Adv. Energy Mater., 2016, 6, 1502181 CrossRef.
- G. H. Kim, L. Shao, K. Zhang and K. P. Pipe, Nat. Mater., 2013, 12, 719–723 CrossRef CAS PubMed.
- H. Ju and J. Kim, ACS Nano, 2016, 10, 5730–5739 CrossRef CAS PubMed.
- M. Liu and X. Y. Qin, Appl. Phys. Lett., 2012, 101, 132103 CrossRef.
- S. V. Faleev and F. Léonard, Phys. Rev. B: Condens. Matter Mater. Phys., 2008, 77, 214304 CrossRef.
- J.-H. Bahk, Z. Bian and A. Shakouri, Phys. Rev. B: Condens. Matter Mater. Phys., 2014, 89, 075204 CrossRef.
- M. Bachmann, M. Czerner and C. Heiliger, Phys. Rev. B: Condens. Matter Mater. Phys., 2012, 86, 115320 CrossRef.
- J.-H. Bahk and A. Shakouri, Phys. Rev. B: Condens. Matter Mater. Phys., 2016, 93, 165209 CrossRef.
- P. G. Burke, B. M. Curtin, J. E. Bowers and A. C. Gossard, Nano Energy, 2015, 12, 735–741 CrossRef CAS.
- H. Yang, J.-H. Bahk, T. Day, A. M. Mohammed, G. J. Snyder, A. Shakouri and Y. Wu, Nano Lett., 2015, 15, 1349–1355 CrossRef CAS PubMed.
- C. Zhang, H. Ng, Z. Li, K. A. Khor and Q. Xiong, ACS Appl. Mater. Interfaces, 2017, 9, 12501–12510 CAS.
- X. Liu, T. Zhu, H. Wang, L. Hu, H. Xie, G. Jiang, G. J. Snyder and X. Zhao, Adv. Energy Mater., 2013, 3, 1238–1244 CrossRef CAS.
- C. Fu, T. Zhu, Y. Liu, H. Xie and X. Zhao, Energy Environ. Sci., 2015, 8, 216–220 CAS.
- C. Fu, S. Bai, Y. Liu, Y. Tang, L. Chen, X. Zhao and T. Zhu, Nat. Commun., 2015, 6, 8144 CrossRef PubMed.
- Y. Tang, Z. M. Gibbs, L. A. Agapito, G. Li, H.-S. Kim, M. B. Nardelli, S. Curtarolo and G. J. Snyder, Nat. Mater., 2015, 14, 1223–1228 CrossRef CAS PubMed.
- L. Xi, J. Yang, L. Wu, J. Yang and W. Zhang, J. Materiomics, 2016, 2, 114–130 CrossRef.
- T. Zhu, C. Fu, H. Xie, Y. Liu and X. Zhao, Adv. Energy Mater., 2015, 5, 1500588 CrossRef.
- M. Nasilowski, B. Mahler, E. Lhuillier, S. Ithurria and B. Dubertret, Chem. Rev., 2016, 116, 10934–10982 CrossRef CAS PubMed.
- M. Ibáñez, R. J. Korkosz, Z. Luo, P. Riba, D. Cadavid, S. Ortega, A. Cabot and M. G. Kanatzidis, J. Am. Chem. Soc., 2015, 137, 4046–4049 CrossRef PubMed.
- G. Tang, W. Wei, J. Zhang, Y. Li, X. Wang, G. Xu, C. Chang, Z. Wang, Y. Du and L. D. Zhao, J. Am. Chem. Soc., 2016, 138, 13647–13654 CrossRef CAS PubMed.
- G. Tang, Q. Wen, T. Yang, Y. Cao, W. Wei, Z. Wang, Z. Zhang and Y. Li, RSC Adv., 2017, 7, 8258–8263 RSC.
- S. Sassi, C. Candolfi, J. B. Vaney, V. Ohorodniichuk, P. Masschelein, A. Dauscher and B. Lenoir, Appl. Phys. Lett., 2014, 104, 212105 CrossRef.
- G. Han, S. R. Popuri, H. F. Greer, L. F. Llin, J.-W. G. Bos, W. Zhou, D. J. Paul, H. Ménard, A. R. Knox, A. Montecucco, J. Siviter, E. A. Man, W.-g. Li, M. C. Paul, M. Gao, T. Sweet, R. Freer, F. Azough, H. Baig, T. K. Mallick and D. H. Gregory, Adv. Energy Mater., 2017, 7, 1602328 CrossRef.
- T. T. X. Vo, T. N. H. Le, Q. N. Pham, C. Byl, D. Dragoe, M.-G. Barthés-Labrousse, D. Bérardan and N. Dragoe, Phys. Status Solidi A, 2015, 212, 2776–2784 CrossRef CAS.
- K. Rubenis, S. Populoh, P. Thiel, S. Yoon, U. Müller and J. Locs, J. Alloys Compd., 2017, 692, 515–521 CrossRef CAS.
- G. Domingo, R. S. Itoga and C. R. Kannewurf, Phys. Rev., 1966, 143, 536–541 CrossRef CAS.
- Q. Zhang, E. K. Chere, J. Sun, F. Cao, K. Dahal, S. Chen, G. Chen and Z. Ren, Adv. Energy Mater., 2015, 5, 1500360 CrossRef.
- Y. Li, B. He, J. P. Heremans and J.-C. Zhao, J. Alloys Compd., 2016, 669, 224–231 CrossRef CAS.
- W.-S. Liu, Q. Zhang, Y. Lan, S. Chen, X. Yan, Q. Zhang, H. Wang, D. Wang, G. Chen and Z. Ren, Adv. Energy Mater., 2011, 1, 577–587 CrossRef CAS.
- M. Zebarjadi, G. Joshi, G. Zhu, B. Yu, A. Minnich, Y. Lan, X. Wang, M. Dresselhaus, Z. Ren and G. Chen, Nano Lett., 2011, 11, 2225–2230 CrossRef CAS PubMed.
- B. Yu, M. Zebarjadi, H. Wang, K. Lukas, H. Wang, D. Wang, C. Opeil, M. Dresselhaus, G. Chen and Z. Ren, Nano Lett., 2012, 12, 2077–2082 CrossRef CAS PubMed.
- D. Wu, Y. Pei, Z. Wang, H. Wu, L. Huang, L.-D. Zhao and J. He, Adv. Funct. Mater., 2014, 24, 7763–7771 CrossRef CAS.
- M. Koirala, H. Zhao, M. Pokharel, S. Chen, T. Dahal, C. Opeil, G. Chen and Z. Ren, Appl. Phys. Lett., 2013, 102, 213111 CrossRef.
- K. Valset, P. H. M. Böttger, J. Taftø and T. G. Finstad, J. Appl. Phys., 2012, 111, 023703 CrossRef.
- L.-D. Zhao, J. He, S. Hao, C.-I. Wu, T. P. Hogan, C. Wolverton, V. P. Dravid and M. G. Kanatzidis, J. Am. Chem. Soc., 2012, 134, 16327–16336 CrossRef CAS PubMed.
- L.-D. Zhao, S.-H. Lo, J. He, H. Li, K. Biswas, J. Androulakis, C.-I. Wu, T. P. Hogan, D.-Y. Chung, V. P. Dravid and M. G. Kanatzidis, J. Am. Chem. Soc., 2011, 133, 20476–20487 CrossRef CAS PubMed.
- H. J. Wu, L. D. Zhao, F. S. Zheng, D. Wu, Y. L. Pei, X. Tong, M. G. Kanatzidis and J. Q. He, Nat. Commun., 2014, 5, 4515 CAS.
- M. Hong, T. C. Chasapis, Z.-G. Chen, L. Yang, M. G. Kanatzidis, G. J. Snyder and J. Zou, ACS Nano, 2016, 10, 4719–4727 CrossRef CAS PubMed.
- H. J. Goldsmid, Materials, 2009, 2, 903–910 CrossRef CAS.
- J.-H. Lee, G. A. Galli and J. C. Grossman, Nano Lett., 2008, 8, 3750–3754 CrossRef CAS PubMed.
- W.-Y. Zhao, Z. Liang, P. Wei, J. Yu, Q.-J. Zhang and G.-S. Shao, Acta Mater., 2012, 60, 1741–1746 CrossRef CAS.
- J. Yu, W.-Y. Zhao, P. Wei, W.-T. Zhu, H.-Y. Zhou, Z.-Y. Liu, D.-G. Tang, B. Lei and Q.-J. Zhang, Appl. Phys. Lett., 2014, 104, 142104 CrossRef.
- G.-K. Ren, J.-l. Lan, S. Butt, K. J. Ventura, Y.-H. Lin and C.-W. Nan, RSC Adv., 2015, 5, 69878–69885 RSC.
- M. Gunes and M. Ozenbas, J. Alloys Compd., 2015, 626, 360–367 CrossRef CAS.
- P. Rauwel, O. M. Løvvik, E. Rauwel and J. Taftø, Acta Mater., 2011, 59, 5266–5275 CrossRef CAS.
- H. Lee, D. Vashaee, D. Z. Wang, M. S. Dresselhaus, Z. F. Ren and G. Chen, J. Appl. Phys., 2010, 107, 094308 CrossRef.
- L. P. Bulat, V. B. Osvenskii and D. A. Pshenay-Severin, Mater. Today Proc., 2015, 2, 532–537 CrossRef.
- H. Fang, T. Feng, H. Yang, X. Ruan and Y. Wu, Nano Lett., 2013, 13, 2058–2063 CrossRef CAS PubMed.
- T. Bauer, Int. J. Heat Mass Transfer, 1993, 36, 4181–4191 CrossRef CAS.
- Y. Zhang, T. Day, M. L. Snedaker, H. Wang, S. Krämer, C. S. Birkel, X. Ji, D. Liu, G. J. Snyder and G. D. Stucky, Adv. Mater., 2012, 24, 5065–5070 CrossRef CAS PubMed.
- H. Ju, M. Kim, D. Park and J. Kim, Chem. Mater., 2017, 29, 3228–3236 CrossRef CAS.
- J. Shuai, H. Geng, Y. Lan, Z. Zhu, C. Wang, Z. Liu, J. Bao, C.-W. Chu, J. Sui and Z. Ren, Proc. Natl. Acad. Sci. U. S. A., 2016, 113, E4125–E4132 CrossRef CAS PubMed.
- Z. Chen, Z. Jian, W. Li, Y. Chang, B. Ge, R. Hanus, J. Yang, Y. Chen, M. Huang, G. J. Snyder and Y. Pei, Adv. Mater., 2017, 29, 1606768 CrossRef PubMed.
- J. Xin, H. Wu, X. Liu, T. Zhu, G. Yu and X. Zhao, Nano Energy, 2017, 34, 428–436 CrossRef CAS.
- K. Biswas, J. He, Q. Zhang, G. Wang, C. Uher, V. P. Dravid and M. G. Kanatzidis, Nat. Chem., 2011, 3, 160–166 CrossRef CAS PubMed.
- B. R. Ortiz, H. Peng, A. Lopez, P. A. Parilla, S. Lany and E. S. Toberer, Phys. Chem. Chem. Phys., 2015, 17, 19410–19423 RSC.
- Z. Ding, Q.-X. Pei, J.-W. Jiang and Y.-W. Zhang, J. Phys. Chem. C, 2015, 119, 16358–16365 CAS.
- L. Yang, Z.-G. Chen, M. Hong, L. Wang, D. Kong, L. Huang, G. Han, Y. Zou, M. Dargusch and J. Zou, Nano Energy, 2017, 31, 105–112 CrossRef CAS.
- N. Wang, H. Chen, H. He, W. Norimatsu, M. Kusunoki and K. Koumoto, Sci. Rep., 2013, 3, 3449 CrossRef PubMed.
- D. Ginting, C.-C. Lin, L. Rathnam, J. H. Yun, B.-K. Yu, S.-J. Kim and J.-S. Rhyee, J. Mater. Chem. A, 2017, 5, 13535–13543 CAS.
- L.-D. Zhao, S. Hao, S.-H. Lo, C.-I. Wu, X. Zhou, Y. Lee, H. Li, K. Biswas, T. P. Hogan, C. Uher, C. Wolverton, V. P. Dravid and M. G. Kanatzidis, J. Am. Chem. Soc., 2013, 135, 7364–7370 CrossRef CAS PubMed.
- K. Zhang, Y. Zhang and S. Wang, Sci. Rep., 2013, 3, 3448 CrossRef PubMed.
- M. Ibáñez, R. Zamani, S. Gorsse, J. Fan, S. Ortega, D. Cadavid, J. R. Morante, J. Arbiol and A. Cabot, ACS Nano, 2013, 7, 2573–2586 CrossRef PubMed.
- M. Scheele, N. Oeschler, I. Veremchuk, S.-O. Peters, A. Littig, A. Kornowski, C. Klinke and H. Weller, ACS Nano, 2011, 5, 8541–8551 CrossRef CAS PubMed.
- R. Yang, G. Chen and M. S. Dresselhaus, Phys. Rev. B: Condens. Matter Mater. Phys., 2005, 72, 125418 CrossRef.
- M. Hu, K. P. Giapis, J. V. Goicochea, X. Zhang and D. Poulikakos, Nano Lett., 2011, 11, 618–623 CrossRef CAS PubMed.
- J. Kang, J. W. Roh, W. Shim, J. Ham, J.-S. Noh and W. Lee, Adv. Mater., 2011, 23, 3414–3419 CrossRef CAS PubMed.
- Z. Li, S. Zheng, T. Huang, Y. Zhang, R. Teng and G. Lu, J. Alloys Compd., 2014, 617, 247–252 CrossRef CAS.
- J. W. Lee, J. Lee, S.-i. Yi, Y. M. Seo, B. L. Choi, C. Yu, C.-W. Yang, S. Hwang, S. Kim, D. Whang and E. K. Lee, J. Mater. Chem. A, 2014, 2, 12153–12157 CAS.
- C.-W. Wu and Y.-R. Wu, J. Appl. Phys., 2014, 116, 103707 CrossRef.
- B. Xu, M. T. Agne, T. Feng, T. C. Chasapis, X. Ruan, Y. Zhou, H. Zheng, J. H. Bahk, M. G. Kanatzidis, G. J. Snyder and Y. Wu, Adv. Mater., 2017, 29, 1605140 CrossRef PubMed.
- Y. Zhang, H. Wang, S. Kraemer, Y. Shi, F. Zhang, M. Snedaker, K. Ding, M. Moskovits, G. J. Snyder and G. D. Stucky, ACS Nano, 2011, 5, 3158–3165 CrossRef CAS PubMed.
- F.-J. Fan, L. Wu and S.-H. Yu, Energy Environ. Sci., 2014, 7, 190–208 CAS.
- Y. Zheng, G. Tan, Y. Luo, X. Su, Y. Yan and X. Tang, Materials, 2017, 10, 617 CrossRef PubMed.
- C.-L. Chen, H. Wang, Y.-Y. Chen, T. Day and G. J. Snyder, J. Mater. Chem. A, 2014, 2, 11171–11176 CAS.
- X. Yan, B. Poudel, Y. Ma, W. S. Liu, G. Joshi, H. Wang, Y. Lan, D. Wang, G. Chen and Z. F. Ren, Nano Lett., 2010, 10, 3373–3378 CrossRef CAS PubMed.
- L. Hu, H. Wu, T. Zhu, C. Fu, J. He, P. Ying and X. Zhao, Adv. Energy Mater., 2015, 5, 1500411 CrossRef.
- M. Hong, T. C. Chasapis, Z.-G. Chen, L. Yang, M. G. Kanatzidis, G. J. Snyder and J. Zou, ACS Nano, 2016, 10, 4719–4727 CrossRef CAS PubMed.
- J. R. Sootsman, R. J. Pcionek, H. Kong, C. Uher and M. G. Kanatzidis, Chem. Mater., 2006, 18, 4993–4995 CrossRef CAS.
- S. I. Kim, K. H. Lee, H. A. Mun, H. S. Kim, S. W. Hwang, J. W. Roh, D. J. Yang, W. H. Shin, X. S. Li, Y. H. Lee, G. J. Snyder and S. W. Kim, Science, 2015, 348, 109–114 CrossRef CAS PubMed.
- L. Hu, T. Zhu, X. Yue, X. Liu, Y. Wang, Z. Xu and X. Zhao, Acta Mater., 2015, 85, 270–278 CrossRef CAS.
- J. Cui, W. Xiu and H. Xue, J. Appl. Phys., 2007, 101, 123713 CrossRef.
- S. Ganguly, C. Zhou, D. Morelli, J. Sakamoto, C. Uher and S. L. Brock, J. Solid State Chem., 2011, 184, 3195–3201 CrossRef CAS.
Footnote |
| † These authors contributed equally to this work. |
| This journal is © the Partner Organisations 2017 |

