 Open Access Article
Creative Commons Attribution 3.0 Unported Licence
P-type NaxNi0.22Co0.11Mn0.66O2 materials: linking synthesis with structure and electrochemical performance†
L. G.
Chagas
abc,
D.
Buchholz
*abc,
C.
Vaalma
abc,
L.
Wu
abc and
S.
Passerini
*ac
aHelmholtz Institute Ulm (HIU) Electrochemistry Ic, Helmholtzstrasse 11, 89081 Ulm, Germany
bInstitute of Physical Chemistry, University of Muenster, Corrensstrasse 28/30, 48149, Muenster, Germany
cKarlsruhe Institute of Technology (KIT), PO Box 3640, 76021 Karlsruhe, Germany. E-mail: daniel.buchholz@kit.edu; stefano.passerini@kit.edu
First published on 31st October 2014
Abstract
P-type layered oxides are promising cathode materials for sodium-ion batteries and a wide variety of compounds have been investigated so far. Nevertheless, detailed studies on how to link synthesis temperature, structure and electrochemistry are still rare. Herein, we present a study on P-type NaxNi0.22Co0.11Mn0.66O2 materials, investigating the influence of synthesis temperature on their structure and electrochemical performance. The change of annealing temperature leads to various materials of different morphologies and either P3-type (700 °C), P3/P2-type (750 °C) or P2-type (800–900 °C) structure. Galvanostatic cycling of P3-type materials revealed high initial capacities but also a high capacity fade per cycle leading to a poor long-term cycling performance. In contrast, pure P2-type NaxNi0.22Co0.11Mn0.66O2, synthesized at 800 °C, exhibits lower initial capacities but a stable cycling performance, underlined by a good rate capability, high coulombic efficiencies and high average discharge capacity (117 mA h g−1) and discharge voltage (3.30 V vs. Na/Na+) for 200 cycles.
Introduction
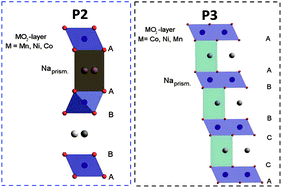
The interest in layered sodium-transition metal oxides, NaxMO2 (M = transition metal, Ni, Co, Mn, Fe, Cr and others) is increasing significantly in recent years.1–8 In fact, Na-based batteries appear to be a promising alternative when energy density is not a critical issue, e.g. for large scale energy storage and low-cost applications.9 Additionally, sodium is highly abundant and homogeneously distributed in the Earth's crust and sea water and, consequently, cheap.8,10,11 However, one great advantage of Na batteries is certainly the feasible replacement of copper with aluminium current collectors since Na does not alloy with this metal.12 This could represent substantial cost and weight savings for batteries.11,13In layered NaxMO2, Na cations can be accommodated in trigonal prismatic (P), tetrahedral (T) or octahedral (O) sites between the MO6 octahedra. P-type materials nowadays are attracting interest due to their promising performance in sodium-ion batteries. Additionally, they were intensively investigated in the past due to the facile preparation of layered lithium oxides via ion-exchange.4,14–17 P2-type materials, characterized by the ABBA oxygen stacking including two MO6 octahedra per unit cell, offer two different sites for Na cations either sharing faces with two MO6 octahedra of adjacent slabs or sharing edges with six MO6 octahedra. P3-type materials (ABBCCA oxygen stacking, three MO2 sheets per unit cell) have prisms sharing one face with one MO6 octahedron and three edges with MO6 octahedra of the next layer, resulting in only one sodium site.4,14–18 A schematic illustration of the structure of the here investigated P-type NaxNi0.22Co0.11Mn0.66O2 (NaNCM) is shown in Fig. 1.
Previously, we have reported the electrochemical performance of layered P2-NaxNi0.22Co0.11Mn0.66O2 synthesized in air at 800 °C as a positive electrode material for lithium and sodium batteries.19,20 Very recently, we have presented the electrochemical performance of P3/P2-Na0.45Ni0.22Co0.11Mn0.66O2 obtained at lower temperature (750 °C) in ionic liquid based electrolytes.21 In the voltage range between 4.6 and 1.5 V (vs. Na/Na+), this material displayed a very high reversible capacity of about 200 mA h g−1 with an average voltage of 2.7 V (vs. Na/Na+). The promising electrochemical performance of a P3/P2-type based material encouraged us to perform a systematic study on P-type NaxNi0.22Co0.11Mn0.66O2 materials in general. The target of this work is to interconnect the influence of synthesis temperature with the structural and electrochemical properties of different NaNCM materials.
Experimental
The material was synthesized by a solid-state method from sodium hydroxide (NaOH, Aldrich, >98%) and a manganese–nickel–cobalt hydroxide precursor. The latter was prepared by co-precipitating an aqueous solution of the three metal acetate salts (Mn, Ni, and Co; Aldrich, >98%, stoichiometric ratio of 66![[thin space (1/6-em)]](https://www.rsc.org/images/entities/char_2009.gif) :
:![[thin space (1/6-em)]](https://www.rsc.org/images/entities/char_2009.gif) 22
22![[thin space (1/6-em)]](https://www.rsc.org/images/entities/char_2009.gif) :
:![[thin space (1/6-em)]](https://www.rsc.org/images/entities/char_2009.gif) 11) with sodium hydroxide (50% excess). After extensive rinsing with distilled water, the precipitate was dried at 120 °C overnight. The dried material was then dispersed in an aqueous solution of sodium hydroxide (0.76 eq. of NaOH per mole of Ni0.22Co0.11Mn0.66(OH)2). The water was slowly removed by a rotary evaporator. After drying and grinding, the mixture was annealed in air at 500 °C for 5 h. The high temperature annealing was performed in an open-air muffle oven under a wide range of conditions, varying from 700 to 900 °C and 6 and 24 h. The influence of the high-temperature annealing step was further investigated by annealing the precursor material at 700, 750, 800, 850 or 900 °C for 6 h. After the high temperature annealing, a water treatment was performed on all materials. For the water treatment, about 1 g of the as-prepared material was stirred in 20 mL of distilled water (at 25 °C) for five minutes. The suspension was then filtered and washed with 80 mL of distilled water, dried at 120 °C in air for 24 hours. Afterwards, the material was ground and screened over a 45 μm sieve and finally stored under an inert atmosphere.
11) with sodium hydroxide (50% excess). After extensive rinsing with distilled water, the precipitate was dried at 120 °C overnight. The dried material was then dispersed in an aqueous solution of sodium hydroxide (0.76 eq. of NaOH per mole of Ni0.22Co0.11Mn0.66(OH)2). The water was slowly removed by a rotary evaporator. After drying and grinding, the mixture was annealed in air at 500 °C for 5 h. The high temperature annealing was performed in an open-air muffle oven under a wide range of conditions, varying from 700 to 900 °C and 6 and 24 h. The influence of the high-temperature annealing step was further investigated by annealing the precursor material at 700, 750, 800, 850 or 900 °C for 6 h. After the high temperature annealing, a water treatment was performed on all materials. For the water treatment, about 1 g of the as-prepared material was stirred in 20 mL of distilled water (at 25 °C) for five minutes. The suspension was then filtered and washed with 80 mL of distilled water, dried at 120 °C in air for 24 hours. Afterwards, the material was ground and screened over a 45 μm sieve and finally stored under an inert atmosphere.
The crystalline structure was characterized by X-ray diffraction (XRD) using the Cu Kα radiation on a Bruker D8 Advance diffractometer (Germany) in the 2θ range of 10° to 90°. Lattice parameters were determined by Rietveld refinement with TOPAS software. The particle morphology was evaluated via a high resolution scanning electron microscope (FE-SEM, Zeiss Auriga). The stoichiometry was checked via Inductively Coupled Plasma-Optical Emission Spectrometry (ICP-OES) with a Spectro ARCOS ICP-OES (Spectro Analytical Instruments, Kleve, Germany) instrument with axial plasma viewing. Energy Dispersive X-ray analyses (EDX) were performed with an EDS detector INCAPentaFETx3 (Oxford Instruments) within a Zeiss Auriga scanning electron microscope. The measurements were performed using an electron beam of 10 kV acceleration voltage. The area analysed in EDX measurements was about 2 × 2 μm2 in size while the penetration depth accounted for a few micrometers.
Electrodes were made from slurries containing 85 wt% of active material, 10 wt% carbon black Super C65 (TIMCAL) and 5 wt% polyvinylidene fluoride (PVDF 6020 Solef®, Arkema Group) binder, the latter was dissolved in N-methyl-2-pyrrolidone (NMP). The slurries were homogenized via ball milling and, afterwards, casted on aluminium foil and dried at 80 °C overnight. Disc electrodes with 12 mm diameter were cut, pressed (6.67 tons per cm2 for 10 seconds), and finally dried at 120 °C under vacuum for 24 h. The active material mass loading in the electrodes was about 2.7 mg cm−2. Electrodes were assembled into three-electrode cells with a glass fiber separator (Whatman) and sodium metal (99.8%, Acros Organics) as counter and reference electrodes in an argon filled glove box. As an electrolyte a 1 M solution of NaPF6 (sodium hexafluorophosphate, 98% Aldrich) in PC (propylene carbonate, UBE) was used. The cells were galvanostatically cycled at a current rate of 0.1 C (nominal capacity = 123 mA h g−1, 1 C = 123 mA g−1). The C-rate test was performed at 0.2 C (24 mA g−1), 0.5 C (61 mA g−1), 1 C (123 mA g−1), 2 C (246 mA g−1) and 5 C (615 mA g−1) within the voltage cut-offs of 4.3 V and 2.1 V (vs. Na/Na+). All tests were performed at 20 ± 2 °C using a Maccor series 4000 battery tester (USA).
Results and discussion
The effect of the annealing temperature synthesis parameter (700, 750, 800, 850 and 900 °C) has been investigated for NaxNi0.22Co0.11Mn0.66O2 (NaNCM). Afterwards, its impact on the structural, morphological and electrochemical properties has been evaluated for the as-obtained NaNCM samples. The stoichiometry of all materials was exemplarily verified by ICP-OES for the NaNCM sample annealed at 800 °C and a ratio of 0.40![[thin space (1/6-em)]](https://www.rsc.org/images/entities/char_2009.gif) :
:![[thin space (1/6-em)]](https://www.rsc.org/images/entities/char_2009.gif) 0.21
0.21![[thin space (1/6-em)]](https://www.rsc.org/images/entities/char_2009.gif) :
:![[thin space (1/6-em)]](https://www.rsc.org/images/entities/char_2009.gif) 0.11
0.11![[thin space (1/6-em)]](https://www.rsc.org/images/entities/char_2009.gif) :
:![[thin space (1/6-em)]](https://www.rsc.org/images/entities/char_2009.gif) 0.66 = Na
0.66 = Na![[thin space (1/6-em)]](https://www.rsc.org/images/entities/char_2009.gif) :
:![[thin space (1/6-em)]](https://www.rsc.org/images/entities/char_2009.gif) Ni
Ni![[thin space (1/6-em)]](https://www.rsc.org/images/entities/char_2009.gif) :
:![[thin space (1/6-em)]](https://www.rsc.org/images/entities/char_2009.gif) Co
Co![[thin space (1/6-em)]](https://www.rsc.org/images/entities/char_2009.gif) :
:![[thin space (1/6-em)]](https://www.rsc.org/images/entities/char_2009.gif) Mn was found, which is in good agreement with the results obtained in our previous studies.19,20 The formula was further confirmed by Energy Dispersive X-ray spectroscopy (EDX) revealing the stoichiometry of Na0.46Ni0.21Co0.11Mn0.66O2 (see ESI-1†). The different sodium contents can be associated with the surface sensitivity of the EDX technique, which may preferentially detect sodium carbonates on the material surface.
Mn was found, which is in good agreement with the results obtained in our previous studies.19,20 The formula was further confirmed by Energy Dispersive X-ray spectroscopy (EDX) revealing the stoichiometry of Na0.46Ni0.21Co0.11Mn0.66O2 (see ESI-1†). The different sodium contents can be associated with the surface sensitivity of the EDX technique, which may preferentially detect sodium carbonates on the material surface.
Impact of synthesis temperature on the structural properties of P-type NaNCM
Initially, X-ray diffractograms were recorded for each sample annealed at a different temperature (700, 750, 800, 850 and 900 °C) for 6 h. The corresponding XRD patterns and Rietveld refinements are shown in Fig. 2, while the calculated lattice parameters are summarized in Table 1 (detailed information about the Rietveld refinement can be found in ESI-2†). The material synthesized at 700 °C (Fig. 2a) is clearly indexable as a P3-type structure with space group R3m. Particularly interesting is the diffractogram in Fig. 2b for NaNCM annealed at 750 °C, which can be attributed to a mixture of the P2-type (space group P63/mmc) and P3-type (space group R3m) structures.14 For both phases an overlapping of the (00l) reflections can be observed. This mixture is sensitive to small changes and even slight temperature differences, for example performing the annealing in different ovens, resulted in materials with very different proportions of P2 and P3 phases. The diffractograms of the samples synthesized at 800, 850 and 900 °C are shown in Fig. 2c–e. Each pattern reveals a phase pure P2-type structure (space group P63/mmc). The sample annealed at 900 °C exhibits the highest crystallinity and a strong preferred orientation, also indicated by the inverted intensities for the (004) and (100) reflections. The lattice parameters (Table 1) are very similar for all the P2-type materials, however, a slight increase of the lattice parameter a and a decrease of the lattice parameter c with increasing annealing temperature are observed. It is worth mentioning that these variations originate from slight differences in the sodium content present in the layered structure and the c-axis parameter, especially, is very sensitive towards changes. As a matter of fact, the amount of sodium in the material, as detected at the end of the first charge, is seen to decrease from 0.52 to 0.483 eq. per mole of the P2-type NaNCM (see ESI-2†) with increasing synthesis temperatures.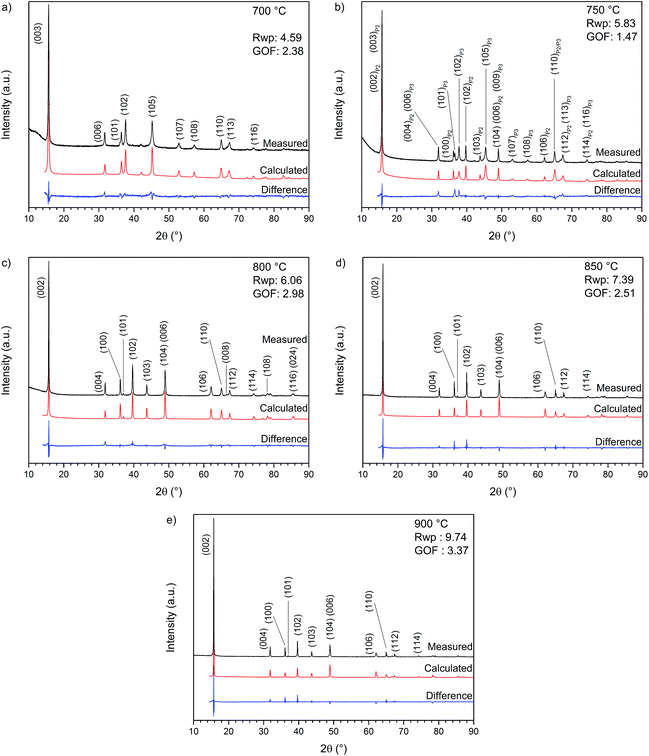 | ||
| Fig. 2 X-ray diffraction pattern and Rietveld refinement of NaxNi0.22Co0.11Mn0.66O2 annealed for 6 hours at (a) 700, (b) 750, (c) 800, (d) 850 and (e) 900 °C. | ||
| 700 °C | |||
| Phase | P3 | Space group | R3m |
| a (Å) | 2.86618(12) | c (Å) | 16.8478(20) |
![[thin space (1/6-em)]](https://www.rsc.org/images/entities/char_2009.gif) |
|||
| 750 °C | |||
| Phase | P3 | Space group | R3m |
| a (Å) | 2.86040(21) | c (Å) | 16.8030(31) |
| Phase | P2 | Space group | P63/mmc |
| a (Å) | 2.85936(18) | c (Å) | 11.1869(13) |
![[thin space (1/6-em)]](https://www.rsc.org/images/entities/char_2009.gif) |
|||
| 800 °C | |||
| Phase | P2 | Space group | P63/mmc |
| a (Å) | 2.86289(03) | c (Å) | 11.21708(93) |
![[thin space (1/6-em)]](https://www.rsc.org/images/entities/char_2009.gif) |
|||
| 850 °C | |||
| Phase | P2 | Space group | P63/mmc |
| a (Å) | 2.863151(62) | c (Å) | 11.21386(54) |
![[thin space (1/6-em)]](https://www.rsc.org/images/entities/char_2009.gif) |
|||
| 900 °C | |||
| Phase | P2 | Space group | P63/mmc |
| a (Å) | 2.864012(74) | c (Å) | 11.20766(51) |
In addition, also the impact of annealing time has been examined for samples synthesized at 700 °C (P3-type) or 800 °C (P2-type) (see ESI-3, Fig. SI-1†). At each of these temperatures, materials were annealed for 6 h or 24 h but no major changes could be detected via X-ray diffractometry.
Impact of synthesis parameters on the morphological properties of P-type NaNCM
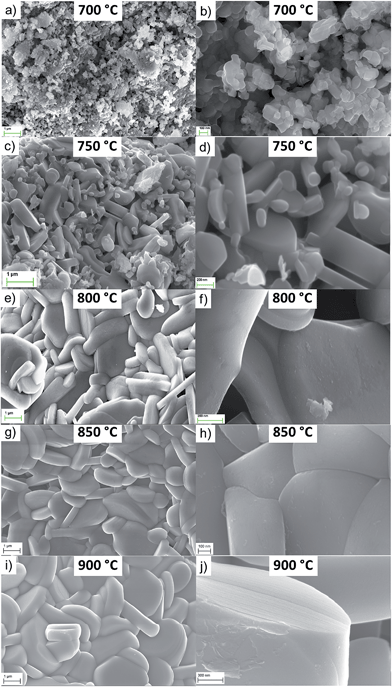
The SEM images of NaNCM samples, annealed at different temperatures, are shown in Fig. 3. At first glance, the annealing temperature clearly has a strong influence on the particle size. Thereby, the 700 °C sample is composed of nano-sized particles with an average particle size of about 50–150 nm and a quite homogeneous particle size distribution. The sample annealed at 750 °C is characterized by the co-existence of smaller nano-particles surrounding the larger micro-sized, flake-like particles, the latter exhibiting an average particle size of about 1 μm. Based on the size, it is suggested that the nano-sized particles are the P3-type material, and the micro-sized particles are the P2-type material. NaNCM synthesized at 800 °C has a rather inhomogeneous particle size distribution ranging from 500 nm to 3 μm (Fig. 3e–f). In fact, although the particles have, in general, a flake-like morphology, some of them show a well-defined shape whereas others appear to be more fragmented.7,19The NaNCM samples annealed at 850 and 900 °C are composed of highly crystalline and well defined flake-like particles. In more detail, the material synthesized at 850 °C has particle sizes from 1–3 μm, while that at 900 °C shows larger particles, from 1 up to 4 μm (Fig. 3i–j). These results demonstrate the importance of the annealing temperature as a parameter to tune also the morphology and particle size. In fact, increasing the temperature increases the particle size. SEM images of the P3- and P2-type materials synthesized at 700 or 800 °C for 6 or 24 hours are found in the ESI-4 (Fig. SI-2 and SI-3†). Again only a minor influence on the particle properties could be detected due to the different annealing times.
Impact of synthesis temperature and structure on the electrochemical properties of P-type NaNCM
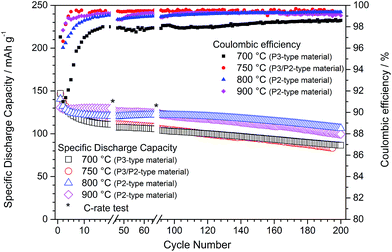
After linking the effect of synthesis temperature with the structural and morphological properties of P-type NaNCM materials, the impact on the electrochemical properties was also evaluated. The influence of annealing time (6 or 24 h) was investigated for the NaNCM sample annealed at 700 °C (P3-type structure) but again only a negligible influence on the electrochemical behaviour was detected (see ESI-5, Fig. SI-4 and SI-5†). Fig. 4 depicts the galvanostatic cycling of the P-type NaNCM materials synthesized at temperatures of 700, 750, 800 and 900 °C. The most relevant values are summarized in Table 2.| NaxNi0.22Co0.11Mn0.66O2 | 700 °C | 750 °C | 800 °C | 900 °C | |
|---|---|---|---|---|---|
| Discharge capacity (mA h g−1) | 1st cycle | 147.2 | 146.8 | 140.5 | 130.4 |
| 50th cycle | 107.6 | 111.0 | 120.6 | 125.5 | |
| 100th cycle | 102.7 | 104.0 | 121.5 | 121.0 | |
| 150th cycle | 95.2 | 94.5 | 116.0 | 111.6 | |
| 200th cycle | 86.5 | 83.3* | 106.4 | 99.6 | |
| Average | 100.2 | 101.2 | 117.0 | 115.5 | |
| Average discharge potential (V vs. Na/Na+) | 3.03 | 3.17 | 3.30 | 3.30 | |
| Capacity retention (%) | 1st cycle–200th cycle | 58.8 | 56.7 | 75.7 | 76.4 |
| 10th cycle–200th cycle | 74.7 | 69.2 | 86.9 | 76.7 | |
| Coulombic efficiency (%) | 2nd cycle | 91.0 | 96.6 | 96.0 | 97.7 |
| 10th cycle | 97.0 | 99.5 | 98.6 | 99.0 | |
| 50th cycle | 97.8 | 99.4 | 98.7 | 98.8 | |
| 100th cycle | 98.0 | 99.4 | 99.0 | 99.2 | |
| 150th cycle | 98.4 | 99.5 | 99.3 | 99.3 | |
| 200th cycle | 98.6 | 99.5* | 99.4 | 99.0 | |
At first glance all synthesized P-type NaNCM materials enable a reversible sodium (de-)intercalation and the long-term cycling performance might be best described by a slightly higher initial capacity fading until the 10th cycle followed by a more stable long term cycling. The first discharge reveals that with increasing synthesis temperature the initial delivered capacity decreases. In consequence, P3-type materials, which are obtained at lower temperatures (700 °C), reveal higher discharge capacities (147 mA h g−1) compared to the P2-type materials obtained at higher temperatures (130 mA h g−1 for P2-type NaNCM, synthesized at 900 °C). Unfortunately, the higher the initial capacity the higher is also the initial capacity fade, which vanishes this advantage of the materials featuring the P3 structure (700 °C and 750 °C). Consequently, strategies to decrease the initial capacity fade are necessary in order to make use of the higher capacity delivered by P3 based materials.
Compared to the P2-based analogues the P3-type and P3/P2-type NaNCM also revealed a higher continuous capacity fade per cycle, leading to a low discharge capacity of around 85 mA h g−1 at the 200th cycle for both materials, corresponding to a capacity retention of only 58.8% and 56.7%, respectively, related to the first cycle. Most probably, the poor electrochemical performance is interconnected with the lower crystallinity and smaller particle size of P3-type and P3/P2-type NaNCM leading to a faster and more pronounced material degradation, e.g., by manganese dissolution.21 The assumption of a material degradation process is further underlined by the cycling performance of the P3/P2-NaNCM, revealing a strong capacity fading, although simultaneously very high coulombic efficiencies are obtained.
The comparison of these electrochemical properties with the P2-type NaNCM materials confirms the latter to exhibit a superior electrochemical performance in terms of initial capacity fade, capacity retention, cycling stability and average discharge capacities. Comparing just the P2-type materials reveals that the first discharge capacity is slightly affected by changing the annealing temperature. In fact, about 140 and 130 mA h g−1 were obtained for the materials annealed at 800 and 900 °C, respectively. Following, the prominent capacity fading during the first 20 cycles for the 800 °C material is most likely due to the higher surface area of this material, which favours initial irreversible reactions. In contrast, NaNCM annealed at 900 °C exhibits an exceptional capacity retention (99%) during the initial 20 cycles. However, in the following cycles, the 800 °C material exhibits a very stable performance in terms of long term cycling, with a high discharge capacity of about 106 mA h g−1 at the 200th cycle compared to a discharge capacity of about 100 mA h g−1 for the NaNCM material annealed at 900 °C. This results in a capacity retention of about 76% for each material, related to their first cycle.
Summarizing, the materials with a P2-type structure revealed a much better electrochemical performance than the P3-type or P3/P2-type analogues which probably relates to a different extent of active material degradation. The best overall electrochemical performance was found for P2-type NaNCM synthesized at 800 °C.
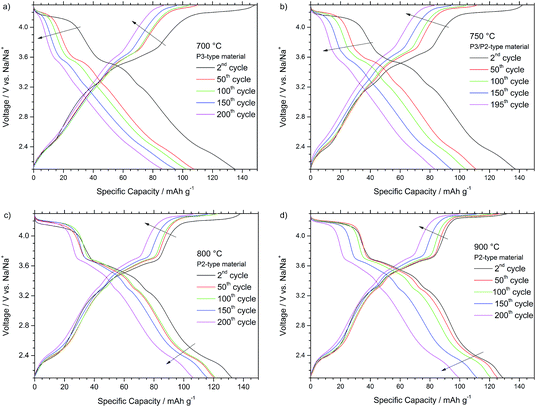
Fig. 5 depicts the voltage profiles recorded during the 2nd, 50th, 100th, 150th and 200th cycle at 0.1 C for the different P-type materials. As all materials share the P-type structure, also all profiles generally depict similar characteristics. The several voltage plateaus and features below 3.5 V vs. Na/Na+ are results of the sodium vacancy ordering within the sodium layers and correlate with various sodium contents, sometimes only stable in very narrow sodium content ranges.4 Thereby, the voltage features are more pronounced for the P2-type NaNCM materials, synthesized at higher temperatures. The voltage plateau at about 4.2 V is associated with the beginning of the mostly reversible P to O phase transition occurring at low sodium contents and higher voltages.1,14,17,22 The driving force for the phase transition is the higher coulombic repulsion of adjacent oxygen layers in the prismatic sites compared to the close- packed octahedral configuration. In addition, recent findings indicate the existence of a stacked-fault OP4-type structure as an intermediate in layered Na-based compounds before the final phase transition to the corresponding O-type occurs, which might be correlated with the voltage plateau located around 3.6 V.5,23 At low voltages of about 2.1–2.4 V vs. Na/Na+ the Mn3+/4+ redox reaction occurs, while at higher potentials the Ni2+/4+ redox process has to be considered accountable for the reversible shuttling of 0.44 eq. of Na+ in NaxNi0.22Co0.11Mn0.66O2. In analogy to similar lithium based materials, the Co3+/4+ redox reaction might only take place to a minor extent at very high voltages as already the nickel and manganese redox reaction can account for the shuttling of the sodium cations and the observed discharge capacity of maximum 147 mA h g−1 (0.54 eq. of Na+).20,24−26
The potential profiles for the P3-type NaNCM (Fig. 5a) and P3/P2-type NaNCM (Fig. 5b) are affected by a strong shortening and sloping of the voltage plateaus at 3.6 V and 4.2 V. A decrease of the delivered capacity is observed from the 2nd to the 50th cycle, and both plateaus strongly shorten to disappear leading to the observed capacity fade. Thereby, the P3-type material reveals the strongest fade and the worst potential profile in terms of average discharge voltage (3.03 V) and energy efficiency as well.
The comparison of the charge–discharge curves reveals that the P2-type material, synthesized at 800 °C (Fig. 5c), is only affected by a very moderate shortening and sloping of the voltage plateaus at 3.6 V and 4.2 V within the galvanostatic cycling for 200 cycles. A decrease of the delivered capacity is observed from the 2nd to the 50th cycle, however, until 150 cycles only a minor decrease is observed and a high capacity is retained (116 mA h g−1). The features occurring below 3.4 V are practically unaffected until the 150th cycle. The potential profile of the 200th cycle confirms the plateaus at 4.2 V and 3.6 V to shorten and to be, thus, interconnected with a more irreversible (de-)sodiation process. Nevertheless, still a very high average discharge voltage of 3.3 V and a capacity of 106 mA h g−1 are obtained in this cycle.
The cycling curves of the P2-type material synthesized at 900 °C are depicted in Fig. 5d. Between the 1st and 50th cycle a very stable cycling performance is observed, underlined by the excellent capacity retention of 99% after 20 cycles. Nevertheless, the high voltage plateaus (V > 3.4 V) start to fade from the 100th to the 200th cycle, leading to a strongly shortened plateau at about 4.0 V after 150 cycles. In consequence, also the decrease in discharge capacity delivered is more evident, leading to a relatively low discharge capacity of 100 mA h g−1 after 200 cycles but still a high average discharge voltage of about 3.3 V.
In general, the P2-type materials, obtained at a higher synthesis temperature, revealed less plateau shortening and shifting compared to the P3/P2-type and P3-type NaNCM materials, obtained at lower synthesis temperatures. In all cases the major capacity fade can be attributed to the shortening of the plateaus at 4.2 V and 3.6 V, which can be correlated with the phase transition mechanism from the P-type host structure to the relevant O-type.1,14,17
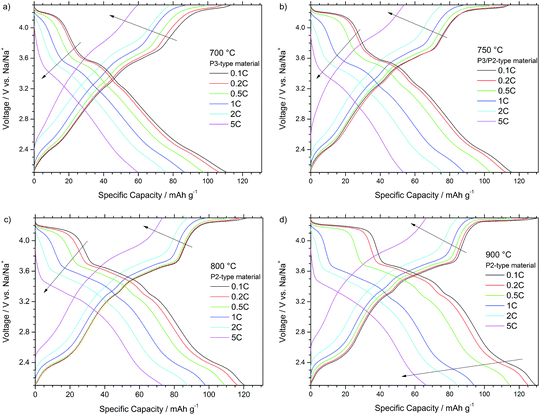
Fig. 6 also presents the voltage profiles of the different P-type NaNCM materials but here at different currents ranging from 0.1 C to 5 C. The profiles of all materials are again very comparable and reveal similar trends at increased current rates. For all materials the plateau located at higher voltages of about 4.2 V starts to shorten and shift above the upper cut-off voltage, during charge, as higher current rates are applied, proving the P to O phase transition to be the rate determining step in the (de-)sodiation process.
In more detail Fig. 6a and b depict the voltage profiles of the P3-type NaNCM material and P3/P2-type NaNCM, respectively. The latter material shows a slight improvement compared with the P3 material especially at lower current rates due to the presence of the P2-phase. Only at low rates (0.1 C and 0.2 C) the P3-type material shows initially a reasonable electrochemical performance (Fig. 6a). However, at 0.5 C the voltage plateaus begin to change, which is, e.g., clearly apparent for the plateau at about 4.2 V during charge, shortening and shifting above the upper cut-off voltage. Therefore, the P3 material only delivers about 60 mA h g−1 at 5 C.
In a comparison between both P2-type materials, the shortening of the higher voltage plateau at 4.2 V for the material, synthesized at 900 °C, leads to worse electrochemical performance at 0.5 C. At higher currents (1 C) this voltage plateau shifts above the upper voltage cut-off during charge and shortens to almost disappear during discharge. At 5 C the performance is slightly different for both cells, especially during charge. This difference is associated with the larger particle size of the material annealed at the highest temperature, which results in longer Na+ ion diffusion paths in the material bulk and, thus, stronger species diffusion limitations. The P2-type material (800 °C), thereby, reveals the best rate capability, delivering the highest capacities of all materials at 1 C (98 mA h g−1), 2 C (88 mA h g−1) and 5 C (73 mA h g−1) rates.
Conclusions
In this work various P-type layered NaxNi0.22Co0.11Mn0.66O2 materials have been successfully synthesized in a temperature range of 700 °C to 900 °C. In the next step the synthesis temperature was linked with the structural and morphological properties of the materials. X-ray diffraction revealed the materials to have either a P3-type (700 °C), a mixture of P2 and P3-type (750 °C) or a P2-type structure (800, 850, 900 °C). SEM analysis revealed that the average particle size increased from the nano- to microsize scale. Finally, the structural properties have been related to the electrochemical properties via a long-term cycling procedure at constant current and various current rates. It was found that higher initial capacities can be obtained when the materials are synthesized at lower temperature. Following, the P3-type NaNCM material revealed the highest capacity but, in addition, also the highest initial and continuous capacity fade, leading to a poor long-term cycling performance. The low electrochemical performance can be related to a continuous active material degradation process, probably originating from the smaller particle size. The higher the synthesis temperature the lower the initial capacity fade and, following, a high discharge capacity retention of 99% after 20 cycles could be obtained for P2-type NaNCM, synthesized at 900 °C. The best trade-off between high initial capacity (140 mA h g−1) and high cycling stability (76% of capacity retention after 200 cycles) was found for the P2-type NaNCM, synthesized at 800 °C, which in addition also revealed a better rate capability than the P2-type analogue. The superior electrochemical performance of this material results from an appropriate combination of crystallinity and particle size, which are important for the reversible Na (de-)intercalation and the prevention of continuous active material degradation.Acknowledgements
The research leading to these results has received funding from the European Union Seventh Framework Programme (FP7/2007–2013) under grant agreement no. 608621. L.G.C. acknowledges the Conselho Nacional de Desenvolvimento Científico e Tecnológico (CsF-CNPq, Brazil) for the financial support. L. Wu would like to acknowledge the funding from Chinese Scholarship Council (CSC). TIMCAL is acknowledged for kindly supplying SuperC 65.Notes and references
- Z. Lu and J. R. Dahn, J. Electrochem. Soc., 2001, 148(11), A1225 CrossRef CAS.
- A. Caballero, L. Hernán, J. Morales, L. Sánchez, J. S. Peña and M. A. G. Aranda, J. Mater. Chem., 2002, 12, 1142 RSC.
- S. Komaba, C. Takei, T. Nakayama, A. Ogata and N. Yabuuchi, Electrochem. Commun., 2010, 12, 355 CrossRef CAS.
- R. Berthelot, D. Carlier and C. Delmas, Nat. Mater., 2011, 10, 74 CrossRef CAS PubMed.
- N. Yabuuchi, M. Kajiyama, J. Iwatate, H. Nishikawa, S. Hitomi, R. Okuyama, R. Usui, Y. Yamada and S. Komaba, Nat. Mater., 2012, 11, 512 CrossRef CAS PubMed.
- S. Komaba, N. Yabuuchi, T. Nakayama, A. Ogata, T. Ishikawa and I. Nakai, Inorg. Chem., 2012, 51, 6211 CrossRef CAS PubMed.
- M. Sathiya, K. Hemalatha, K. Ramesha, J. M. Tarascon and A. S. Prakas, Chem. Mater., 2012, 24, 1846 CrossRef CAS.
- D. Kim, E. Lee, M. Slater, W. Lu, S. Rood and C. S. Johnson, Electrochem. Commun., 2012, 18, 66 CrossRef CAS.
- B. Dunn, H. Kamath and J. M. Tarascon, Science, 2011, 334, 928 CrossRef CAS PubMed.
- B. L. Ellis and L. F. Nazar, Curr. Opin. Solid State Mater. Sci., 2012, 16, 168 CrossRef CAS.
- M. D. Slater, D. Kim, E. Lee and C. S. Johnson, Adv. Funct. Mater., 2013, 23, 947 CrossRef CAS.
- J. L. Murray, Bull. Alloy Phase Diagrams, 1983, 4–4, 407 CrossRef.
- M. Valvo, F. Lindgren, U. Lafont, F. Björefors and K. Edström, J. Power Sources, 2014, 245, 967 CrossRef CAS.
- J. M. Paulsen and J. R. Dahn, Solid State Ionics, 1999, 126, 3 CrossRef CAS.
- A. Caballero, L. Hernán, J. Morales, L. Sánchez and J. Santos, J. Solid State Chem., 2003, 174, 365 CrossRef CAS.
- A. R. Armstrong, A. J. Paterson, A. D. Robertson and P. G. Bruce, Chem. Mater., 2002, 14, 710 CrossRef CAS.
- M. Dollé, S. Patoux and M. M. Doeff, Chem. Mater., 2005, 17, 1036 CrossRef.
- C. Delmas, C. Fouassier and P. Hagenmuller, Physica B+C, 1980, 99(1–4), 81 CrossRef CAS.
- D. Buchholz, A. Moretti, R. Kloepsch, S. Nowak, V. Siozios, M. Winter and S. Passerini, Chem. Mater., 2013, 25, 142 CrossRef CAS.
- D. Buchholz, L. G. Chagas, M. Winter and S. Passerini, Electrochim. Acta, 2013, 110, 208–213 CrossRef CAS.
- L. G. Chagas, D. Buchholz, L. Wu, B. Vortmann and S. Passerini, J. Power Sources, 2014, 247, 377 CrossRef CAS.
- Y. N. Zhou, J. J. Ding, K. W. Nam, X. Yu, S. M. Bak, E. Hu, J. Liu, J. Bai, H. Li, Z. W. Fu and X. Q. Yang, J. Mater. Chem. A, 2013, 1, 11130 CAS.
- J. Billaud, G. Singh, A. R. Armstrong, E. Gonzalo, V. Roddatis, M. Armand, T. Rojo and P. G. Bruce, Energy Environ. Sci., 2014, 7, 1387 CAS.
- Z. Lu, R. A. Donaberger, C. L. Thomas and J. R. Dahn, J. Electrochem. Soc., 2002, 149, A1083 CrossRef CAS.
- J. Li, Z. R. Zhang, X. J. Guo and Y. Yang, Solid State Ionics, 2006, 177, 1509 CrossRef CAS.
- D. Yuan, W. He, F. Pei, F. Wu, Y. Wu, J. Qian, Y. Cao, X. Ai and H. Yang, J. Mater. Chem. A, 2013, 1, 3895 CAS.
Footnote |
| † Electronic supplementary information (ESI) available: Results of the chemical characterization via EDX. Details of the Rietveld refinement of crystalline structures. Additional SEM images and electrochemical performance of NaNCM annealed under different conditions. See DOI: 10.1039/c4ta03946g |
| This journal is © The Royal Society of Chemistry 2014 |

