 Open Access Article
Creative Commons Attribution 3.0 Unported Licence
Engineering mesophase stability and structure via incorporation of cyclic terminal groups†
Richard J.
Mandle
 *ab,
Laurence C.
Abbott
 a,
Luma
Fritsch
 ac,
Rachel R.
Parker
 a,
Sam
Hart
a,
Adrian C.
Whitwood
a,
Sam
Hart
a,
Adrian C.
Whitwood
 a,
Stephen J.
Cowling
 a,
John N.
Moore
 a and
John W.
Goodby
a
aDepartment of Chemistry, University of York, York, YO10 5DD, UK. E-mail: r.mandle@leeds.ac.uk
bSchool of Physics and Astronomy, University of Leeds, Leeds, LS2 9JT, UK
cInstituto de Química, Universidade Federal do Rio Grande do Sul, Porto Alegre, RS, Brazil
First published on 21st March 2022
Abstract
We report on the characterisation of a number of liquid–crystalline materials featuring cyclic terminal groups, which lead to significant enhancements in the temperature range of the mesomorphic state. Materials with only short terminal chains are able to support lamellar mesophase formation by appending a large terminal cyclic unit at the end of a short spacer composed of methylene units. X-ray scattering experiments reveal that the layer spacings of the lamellar smectic phase are significantly larger when a cyclic end-group is present than for equivalent linear unsubstituted materials, but there is no effect on orientational order. Fully atomistic molecular dynamics simulations faithfully reproduce experimental layer spacings and orientational order parameters, and indicate that the cyclic terminal units spontaneously segregate into diffuse sub-layers and thus cause the increased layer spacing. This shape segregation predicted by molecular dynamics simulations is observed in the crystalline solid state by X-ray diffraction.
Introduction
Liquid crystals for display applications typically comprise a rigid ‘core’ unit flanked with a terminal chain and a polar terminal group. The need to engineer the properties of nematic liquid–crystals has led to an understanding of how changes to molecular structure impact the bulk properties of these materials. Positioning a bulky group at the end of the terminal chain can lead to reductions in melting points with only minimal change in the clearing point;1–7 electron-withdrawing end groups (–Cl, –Br, –ArFn) can suppress the SmA mesophase of cyanobiphenyl derived LCs8 although in phenylpyrimidine-derived materials these halogen terminated end groups can actually stabilise the SmA state.9 Apolar or weakly polar bulky terminal groups (–C(CH3)3etc.) suppress the nematic phase and lead to smectogenic materials, albeit with reductions in the clearing point relative to the parent material.4,5 The smectic layer spacing of materials incorporating apolar bulky terminal groups is inversely dependent on temperature.5Some archaea incorporate cyclic units in their lipids10 which confers, inter alia, the ability to withstand greater extremes of temperature than eukaryotes11 by either raising the temperature at which the liquid crystalline lipid-bilayers undergo isotropisation,12,13 or lowering the temperature at which they undergo crystallisation.14,15 Inspired by this, we considered that incorporating cyclic units into the terminal regions of liquid crystalline materials could perhaps offer a similar thermal advantage. Cyclic end groups have previously been studied in the context of the tilted smectic C phase for use in display devices,16,17 but not for nematic or SmA type materials (Fig. 1) which is the focus of this present article. Furthermore, in prior examples16,17 the bulky cyclic group is attached to the terminal chain via polar groups (esters, ethers), and thus it is difficult to determine to what extent steric and electronic effects are responsible for the resulting behaviour.
Using the 4-cyanobiphenyl mesogenic core unit, in this work we have studied different combinations of ring size, alkyl chain length and linking-unit and their impact on the mesomorphic behaviour of the resulting materials. In our materials the cyclic unit is installed at the terminus of the chain, which is in contrast to archaeal lipids which typically have the cyclic units within the chains. In all cases the cyclic group was directly attached to the alkyl chain and can be described as non-polar; we can therefore attribute any changes in behaviour solely to steric factors. Some cyclic terminal groups were found to give significant enhancements to the transition temperatures relative to the linear unsubstituted parent compounds, to induce smectic phases for relatively short terminal chain lengths, as well as leading to anomalously large smectic layer spacings and strong odd–even effects.
Experimental
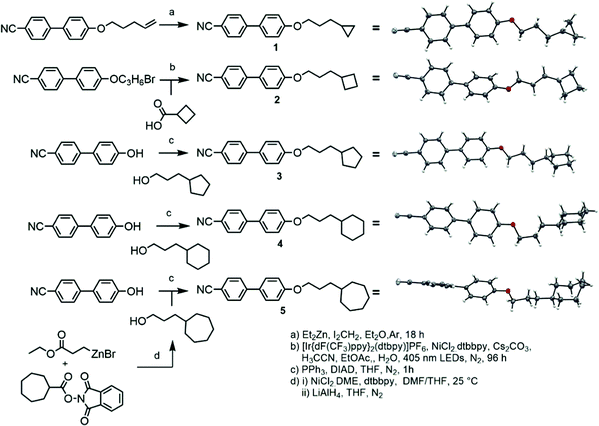
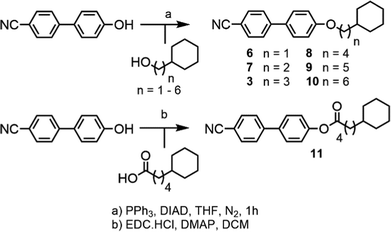
Compound 1 was prepared via the Furukawa modification of the Simmons–Smith cyclopropanation18 of 4-(pent-4-eneyloxy)-4′-cyanobiphenyl. Compound 2 was obtained via the metallophotoredox C–C coupling19 of 4-(3-bromopropoxy)-4′-cyanobiphenyl with cyclobutanecarboxylic acid. Compounds 3–5 were prepared via Mitsunobu etherification20 of 4-hydroxy-4′-cyanobiphenyl with an appropriate cycloalkyl-terminated alcohol; 3-cyclopentylpropan-1-ol and 3-cyclohexylpropan-1-ol were sourced commercially and used to synthesise 3 and 4, respectively. For 5, alkyl–alkyl cross coupling21 of the redox active N-hydroxyphthalamide ester of cycloheptanoic acid with (3-ethoxy-3-oxypropyl)zinc bromide, followed by reduction with LAH, to afford 3-cycloheptylpropan-1-ol. The structures of compounds 1–5 were confirmed by single crystal X-ray diffraction and are show in Scheme 1 as thermal ellipsoid models (50% probability). Single crystal X-ray diffraction data were collected at 110 K on an Oxford Diffraction SuperNova diffractometer with Cu-Kα radiation (λ = 1.54184 Å) using an EOS CCD camera; further information is given in the ESI† to this article.Compounds 6–10 (Scheme 2) were prepared via Mitsunobu etherification of 4-hydroxy-4′-cyanobiphenyl with an appropriate cyclohexyl-terminated alcohol; these were sourced commercially with the exceptions of cyclohexylpentan-1-ol (prepared according to ref. 22) and 6-cyclohexylhexan-1-ol (prepared according ref. 23). Compound 11 (Scheme 2) was prepared via esterification of commercially available 5-cyclohexylpentanoic acid with 4-hydroxy-4′-cyanobiphenyl using EDC/DMAP. Full synthetic details for all transformations are given in the ESI.†
Transition temperatures were determined by polarised optical microscopy (POM, photomicrographs in ESI†) and differential scanning calorimetry (DSC) with additional small angle X-ray scattering (SAXS) studies on selected compounds. Numerical integration of X-ray scattering data was performed in Matlab. Electronic structure calculations were performed in Gaussian G09 rev E01,24 individual conformers were aligned using the VMD software package25 and rendered using Qutemol.26 Details of the molecular dynamics (MD) simulation methods are given in the ESI.†
Results
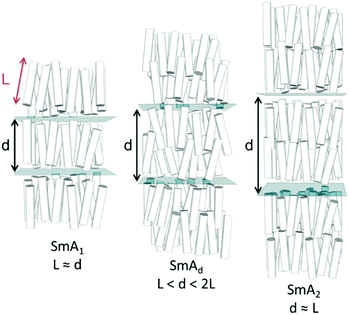
The transition temperatures and associated enthalpies of transition of 1–5, in which the spacer is held at three methylene units while the size of the terminal ring is varied, are presented along with the analogous linear material (5OCB) in Table 1.Whereas compounds 1 and 2 exhibit reductions in clearing points relative to 5OCB we observe that materials with larger cyclic end groups (3–5) exhibit clearing points notably higher than those of 5OCB. To a first approximation, the clearing points correlate with the ring strain of the cyclic end-group; cyclopropane has the lowest clearing point and highest ring strain, whereas cyclohexane has the highest clearing point and lowest ring strain. However, as we will show, conformational and size-exclusion effects are the underlying cause of this enhancement, rather than ring strain. This enhancement in clearing point is accompanied by an increase in melting point – compounds 1–5 exhibit higher melting points than the linear parent (5OCB). All five novel materials exhibit nematic phases; however it is surprising to observe a smectic A phase in 5 given the short terminal chain employed. The end-to-end length of all-trans5 is only slightly larger than 5OCB (18.8 Å versus 17.0 Å, both at the B3LYP/6-31G(d,p) level of DFT). The layer spacing of the SmA phase of 5 was measured to be 31.0 Å and temperature independent when studied by SAXS. The d/l ratio (layer spacing over all-trans molecular length) is therefore 1.65 for 5, this being significantly larger than would be expected for a material with a linear alkoxy chain; for example 8OCB (4-octyloxy-4′-cyanobiphenyl) has a d/l ratio of 1.43.27 The SmA phase of 5 is therefore interdigitated and thus of the subtype ‘SmAd’, This interdigitation is common for cyanobiphenyls and results from having molecules form dynamic antiparallel associated pairs through dipole–dipole interactions.28
The constituent molecules of the antiparallel cyanobiphenyl pairs rotate about their long axis in the SmA phase – both independently and cooperatively29 – meaning that the time averaged shape of the individual molecules is rod like. To estimate the gross shape of 4 and 5 we obtained optimized geometries at the B3LYP/6-31G(d) level of DFT for both materials before optimizing the geometries of conformers that arise from ring flips or twist-boat states. Geometries not within 20 kJ mol−1 of the global minima were discarded, and those within this limit were overlaid (Fig. 2a for 4 and Fig. 2b for 5). This gives a more realistic picture of the likely gross shape of the terminal group than afforded by a single conformer, and the volume occupied by the terminal group is larger than that of the biphenyl core unit; hence, the molecules are more conical than rod like (Fig. 2b). The layer spacing of 5 is significantly larger than materials with linear terminal chains; we propose that the steric bulk of the cyclic group suppresses the interpenetration of the terminal alkyl chains into adjacent layers and leads to the enhanced layer spacing (Fig. 2c, d). The observed increases in transition temperatures in compounds 1–5 can be considered as resulting from the better filling of free volume by materials with bulky end groups than linear chains due to the conical, rather than rod-like, shape.30,31 Indeed, in the crystalline state (Fig. 2e) the bulky cyclic groups of 5 are clearly segregated from the 4-cyanobiphenyl regions, giving alternating planes of aromatic and alicyclic regions. The XRD crystal structure of compounds 1, 2 and 4 exhibit similar segregation into cycloalkyl rich planes and biphenyl rich planes (Fig. S8, S9, S11 in ESI†). This segregation is also present for 3, albeit less pronounced than for compounds 2, 4 and 5 (Fig. S10 in ESI†).
We next studied the effect of the length of the methylene spacer between the cyanobiphenyl ‘core’ and the cyclic end-group upon the liquid crystalline properties (Table 2). We employed a cyclohexyl terminal group as this not only gave the highest clearing points (Table 1), simplifying study of smectic phases by SAXS, but also has zero ring strain.
Compounds 6 and 7 are non-mesogenic due to the short spacer between the end group and the core unit. Unlike 4, which exhibits only a nematic phase, 8 and 9 both exhibit nematic and SmA phases. The enthalpy (and therefore entropy) associated with the N-SmAd transition is much larger for 9 than 8 and we will return to this point shortly. Compound 10 exhibits a direct Iso-SmA transition. All three phase transitions in Table 2 display a strong odd–even effect; transition temperatures are notably higher for odd parity materials. The smectic layer spacing of 9 was determined by SAXS, and presented as a d/l ratio using calculated molecular lengths (B3LYP/6-31G(d) level, 21.2 Å) as a function of reduced temperature in Fig. 3a. We also measured the layer spacings of two comparator materials, these were selected as they have approximately the same molecular length as compound 9 – 8OCB (L = 21.8 Å) and 2Si4OCB (L = 21.9 Å) – data are presented in Fig. 3a along with molecular structures (Fig. 3d, e).
Lastly, comparison of the diffuse wide-angle scattering peak of 9 and 8OCB reveals evidence for segregation into cycloalkyl rich sub-layers. Both 9 and 8OCB show a diffuse wide-angle peak at ∼5 Å which results from the average lateral molecular separation. In the case of 9 an additional feature is present (Fig. 3f, Q ≈ 0.95 Å−1, d ≈ 6.6 Å); comparable features have been reported in siloxane liquid crystalline materials, and are interpreted as resulting from nanophase segregation.32
Typically the layer spacing of the SmAd phase is almost invariant with temperature,28 however some materials with an acyclic ‘bulky’ group display temperature dependent layer spacing in the SmAd phase.5 In the present study we observe the layer spacing of 9 to vary only slightly with temperature, however the d/l ratio is far larger than that of 8OCB (1.60 vs 1.43, respectively). The siloxane terminated material 2Si4OCB33 exhibits a short range smectic A phase whose d/l ratio is intermediate between 9 and 8OCB. Study of compounds 8 and 10 by SAXS was complicated by crystallisation, however we were able to collect a single SAXS frame at a temperatures of 44 °C and 65 °C, respectively. For 8 and 10 we measure layer spacings of 31.7 Å and 35.4 Å, respectively; this corresponds to d/l ratios of 1.61 for both materials. Of the materials studied by SAXS (5, 8, 9, 10) we find the d/l ratios to be effectively identical.
It is known that cyanobiphenyl leads to antiparallel pairing through dipole–dipole interactions, increasing the effective length-to-breadth ratio (i.e. aspect ratio) and leading to interdigitated smectic phases.27,28 To determine if this is a steric effect we devised compound 11, a structural homologue of 9 however with an increased dipole moment (at the DFT(B3LYP/6-31G(d)) level: 9 = 7.2 Debye, 11 = 7.6 Debye) that might be expected to alter the degree of antiparallel pairing and so lead to a change in layer spacing. If the effect is purely steric then the layer spacings should be unchanged. The transition temperatures and associated enthalpies of transition of 9 and 11 are given in Table 3.
The layer spacing of the SmAd phase of 11 was measured by SAXS (Fig. S1, ESI†)and was found to be temperature independent at 34.3 Å, corresponding to a d/l ratio of 1.60 using the molecular length of 21.4 Å (from geometry optimised at the B3LYP/6-31G(d) level). This result, which is the same as for compound 9, supports the hypothesis that the enhancements to layer spacing and transition temperatures result from segregation of the bulky end group via reducing the interpenetration of alkyl chains between adjacent smectic layers. In this scenario the antiparallel pairing of cyanobiphenyls is unperturbed by the cyclic end groups, with the increased layer spacing resulting from reduced layer interpenetration. Previously we have obtained values of the semi-empirical Kirkwood factor (g, effectively a measure of the degree of pairing in an anisotropic liquid) from measurement of the dielectric anisotropy coupled with calculated dipole moments and polarisabilities.27,34 While this information would clearly be desirable for the present materials, the short nematic range of 9 and 11 leads to an unsaturated value of Δε and therefore of the Kirkwood factor.
We considered that the increase in smectic layer spacing when a bulky group is present could be caused by an increase in the orientational and/or translational order parameters. If we consider the change in layer spacing to be a consequence of size-exclusion effects similar to that observed in the solid state (Fig. 3), then we would expect no change in the orientational order parameters. We used the well-known method35–37 to determine the orientational order parameters of 9 and 8OCB from the WAXS data, and they are presented in Fig. 4. The comparison of orientational order parameters in the nematic phase is complicated by the large difference in the temperature range of the nematic phase (ΔT8OCB ≫ ΔT9), however immediately prior to the SmA-N transition we find values of 〈P2〉 and of 〈P4〉 to be effectively the same for both materials. In the SmA phase we observe that at a given reduced temperature (TSmA-N/T) both materials have comparable values of 〈P2〉 and 〈P4〉. The presence of a cyclic terminal group does not appear to affect the orientational order of the resulting mesophase, only the degree of positional order via segregation of the bulky cyclic terminal units. This effect can be considered as a steric pressure that results from the terminal group at the layer interface, reducing the interpenetration of aliphatic chains in adjacent layers and therefore giving increased layer spacing.
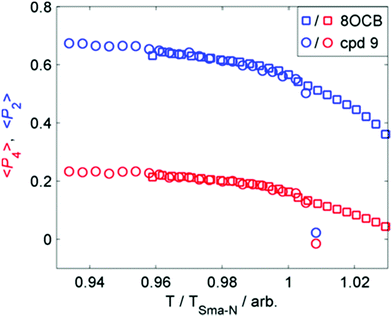 | ||
| Fig. 4 Plot of the first two even 〈Pn〉 order parameters as a function of reduced temperature (T/TSmA-N) for compound 9 (circles) and 8OCB (squares). | ||
Fully atomistic molecular dynamics simulations were run on 8OCB and 9 to provide a comparison with the experimental data, and using a similar approach to that reported for 11OCB and t-Bu–11OCB (11OCB appended with a bulky tertiary butyl end-group).38 The simulations were run from isotropic liquid-phase starting geometries of 1440 molecules and at a reduced temperature of T/Tc = 0.934 for both systems, where Tc is the estimated clearing point of the respective simulated system; the corresponding experimental temperatures are 56.7 and 61.6 °C (T/TSma-N = 0.970 and 0.941) for 8OCB and 9, respectively. Details of the methods are given in the ESI.†
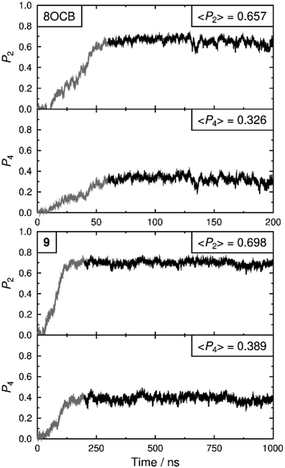
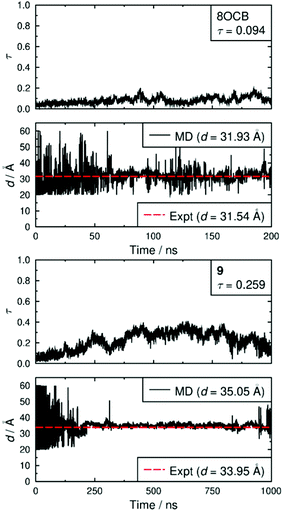
Both simulated systems evolved to form a smectic A phase. The evolution of the orientational order parameters P2 and P4, obtained using the N–O vector as the principal axis, are shown in Fig. 5. The evolution of the translational order parameter τ and associated layer spacing d, obtained using the C4′ biphenyl carbon atom to define the molecular position, are shown in Fig. 6. An analysis of the angle between the director and the layer normal, presented in the ESI,† confirmed that both simulated systems formed a smectic A phase. The simulated smectic A phase of 8OCB formed relatively quickly (ca. 60 ns) but was typically not stable (beyond ca. 200 ns), whereas that of 9 formed more slowly (ca. 200 ns) and was more stable (to at least 1000 ns). We attribute the behaviour of 8OCB to the ready formation of diffuse layers in a simulation that lacks long-term stability due to the use of anisotropic pressure coupling, which allows the simulation box aspect ratios to vary and avoids bias from a constrained box shape but which results in an unstable simulation box and phase for this system. By contrast, we attribute the behaviour of 9 to the bulky end-group leading to the slower formation of more ordered layers that give a more stable simulation once formed.
In comparison with the respective experimental data at the relevant temperature, these simulated phases give average P2 values that are closely similar, average P4 values that are slightly higher, and average d values that are closely similar. We do not have experimental data for a comparison with the average τ values, but together the available comparisons suggest that the simulations may reasonably be used as an aid to interpret the experimental data.
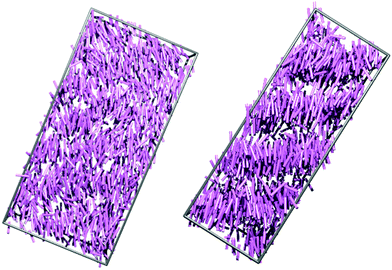
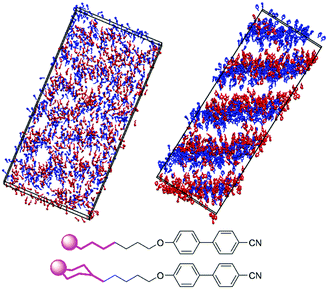
Fig. 7 shows snapshots from the simulations of 8OCB and 9 at times when the layers are relatively well-defined, with each molecule represented by a cylinder that corresponds to the N–O molecular vector, i.e. the relatively rigid aromatic moiety, used to determine the orientational order parameters. For 8OCB, the layers are not very well defined, as indicated also by the relatively low value of τ, and some of the layers show large ripples. By contrast, the layers of 9 are more clearly defined and flatter, with the empty regions between the layers of cylinders in this snapshot containing the cyclohexyl-C5 chains (not shown in this snapshot for clarity). Moreover, an examination of the density of layered atoms along the layer normal vector (comparable to the director) over time showed that the layers of 8OCB often formed for short periods of ca. 10–20 ns before breaking up and then reforming at other locations along the layer normal vector at later times, whereas the layers of 9 remained comparatively stable in location once formed.
The structures of the phases were also assessed using pair-wise correlation functions39 of vectors between the C4 and C4′ biphenyl atoms on all of the molecules, as shown in Fig. 8. The radial distribution function g(r) used the centres of the biphenyl vectors, and shows liquid-like distributions with peaks at ca. 5.1 and 9.9 Å for both 8OCB and 9, corresponding to “shells” of surrounding molecules, and tending towards 1 at longer distances indicating long-range disorder; the slightly higher g(r) values for 9 than 8OCB are consistent with a slightly more ordered phase. The first-order orientational correlation functions G1(r) of the biphenyl vectors in 8OCB and 9 both show a negative peak at ca. 3–4 Å corresponding to antiparallel molecular orientations of the biphenyl units being favoured in the first shell, and a weaker positive peak at ca. 7 Å corresponding to parallel molecular orientations being favoured more weakly in the next shell (as illustrated schematically in Fig. 2 c and d); this observation is consistent with those reported from simulations of other related nCB and nOCB systems.39,40 The second-order orientational correlation function G2(r) used the same biphenyl reference vector, and shows a peak at ca. 5 Å indicating a very high P2 orientational order in the first shell that decreases towards values of 〈P2〉2 at longer distances, as expected.39 Taken together, the distribution functions in Fig. 8 show that the ordering behaviour of the biphenyl groups of 8OCB and 9 are similar, which suggests that the differences in smectic layer formation and stability are strongly influenced by the nature of the alkyl chains at the other ends of these molecules.
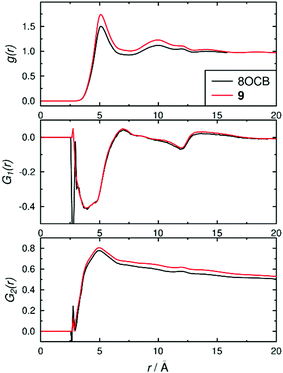 | ||
| Fig. 8 Pair-wise correlation functions determined over the time ranges 60–200 ns for 8OCB and 200–1000 ns for 9. | ||
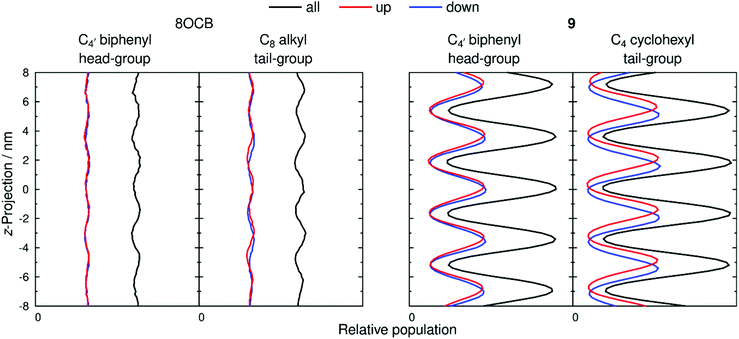
The extent of layering and interdigitation of the molecules was assessed using a similar approach to that reported for 11OCB and t-Bu–11OCB.38Fig. 9 shows the relative populations along the layer normal vector, z, of a selected head-group atom (C4′ biphenyl for both 8OCB and 9, as used to determine τ values) and a selected tail-group atom (the terminal carbon atom; C8 alkyl for 8OCB, and C4 cyclohexyl for 9) during a 50 ns window when the layer positions were relatively stable in each simulation box. All of the relative populations have an approximately sinusoidal form, as shown by the black lines in Fig. 9, with the populations of the head-group and tail-group atoms being out of phase, which indicates the presence of distinct aromatic and aliphatic regions along the layer normal. The amplitude of the oscillations is low for 8OCB, illustrating the diffuse nature of the layers, and much higher for 9, showing the greater degree of nanosegregation between its aromatic and aliphatic moieties.
Fig. 9 also shows the relative populations for molecules with the C–N vector pointing “up” (red) or “down” (blue) along the z-axis, which corresponds to molecules having their alkyl chains below or above the aromatic moiety, respectively, along this axis (as illustrated schematically in Fig. 2 c and d). In Fig. 9, the head-group atoms of 8OCB and 9, and the tail-group atoms of 8OCB, show only a small difference in the relative populations of the “up” and “down” molecules along the z-axis, which indicates a significant degree of interdigitation of the aromatic head-groups of 8OCB and 9, and of the linear alkyl tail groups of 8OCB. By contrast, the cyclic tail-group atoms of 9 show relative populations of “up” and “down” molecules that are distinctly offset along the z-axis, with the “up” molecules (cyclohexyl group at the bottom) being higher on the z-axis than that of the “down” molecules (cyclohexyl group at the top), which indicates a relatively low degree of interdigitation for the cyclic tail groups of 9.
The distributions shown in Fig. 9 were used to quantify the extent of interdigitation.38 The C4′ biphenyl head group atoms of 8OCB and 9 showed 50% and 53% interdigitation, respectively, corresponding to approximately half of these head-group atoms being located in the adjacent layer. The C8 alkyl tail group atoms of 8OCB showed 50% interdigitation, similar to the head groups, whereas the C4 cyclohexyl tail group atoms of 9 showed a much lower interdigitation of 39%. Hence, 8OCB shows a similar extent of interdigitation at both ends of the molecule, whereas 9 shows much less interdigitation of the bulky cyclohexyl tail group than the biphenyl head group. This behaviour is similar to that reported previously for 11OCB and t-Bu–11OCB,38 where the bulky t-Bu tail group displayed less interdigitation than the other terminal groups in either system.
The difference in the extent of interdigitation between 8OCB and 9 suggests that the inter-layer boundary at the tail end of these molecules is more clearly defined for 9 than 8OCB. This effect is shown clearly by the snapshots in Fig. 10, which show the positions and orientations of the five terminal carbon atoms of the alkyl chain of 8OCB and the equivalent carbon atoms of 9. For 8OCB, there is clear interdigitation between the alkyl chains of the molecules pointing up and down, and the associated alkyl layers are diffuse. For 9, not only are the alkyl layers more defined, but the inter-layer boundary shows two almost distinct sub-layers arising from the separation of cyclohexyl groups in molecules pointing up and down.
Conclusions
We have expanded on our previous work using bulky terminal groups to promote the SmA phase in cyanobiphenyl mesogens by using terminal cyclic groups separated from the core using relatively short aliphatic chains. The enhancement to smectic layer spacing observed in cyanobiphenyl materials with bulky terminal groups is a steric effect, and occurs without change in orientational order parameter. Provided a bulky group is present, the layer spacing is ∼1.6 times the molecular length regardless of terminal ring size (5), alkyl chain length (8, 9 and 10) and linking group (9 and 11). This effect can be exploited to give significant increases to the onset transition temperature of both nematic and smectic mesophases, as demonstrated by comparing compound 9 to its linear analogue. Results from fully atomistic MD simulations support the overall interpretation from experiment that a cyclic end-group on the alkyl chain reduces the interpenetration of molecules between smectic layers in these systems. This phenomenon points to a potentially new method for stabilising both nematic and smectic liquid–crystalline states should the accompanying increase in melting points be countered.Data availability
Raw data pertinent to this work is available on request from the University of York data catalogue. Crystal structure data for compounds 1–5 is deposited with the CCDC (deposition numbers 2128187, 2128188, 2128189, 2128190 and 2128191, respectively).Conflicts of interest
There are no conflicts to declare.Acknowledgements
The authors wish to thank the EPSRC for funding through grants EP/M020584/1 and EP/K039660/1. LF acknowledges funding by the Coordenação de Aperfeiçoamento de Pessoal de Nível Superior, Brazil (CAPES), finance code 001. We thank Dr Chris Rhodes of the University of York for designing and constructing the LED photoreactor used in the synthesis of compound 2. We thank the referees for suggestions regarding the detection of segregation effects in X-ray scattering data.References
- T. V. Clapp, W. A. Crossland, A. B. Davey, M. Grasmann, J. P. Hannington, R. K. King, M. Pivnenko, S. Robson and H. Xu, US Pat, 8956548, 2015 Search PubMed.
- D. J. Gardiner and H. J. Coles, J. Phys. D: Appl. Phys., 2006, 39, 4948–4955 CrossRef CAS.
- J. P. Hannington, T. V. Clapp, F. Nishida, R. K. King, O. Farooq, M. Grasmann, W. A. Crossland, H. J. Coles, A. B. Davey, H. Xu, O. Hadeler and M. Pivnenko, United States Patent No. 8821992, 2014 Search PubMed.
- R. J. Mandle, E. J. Davis, J. P. Sarju, N. Stock, M. S. Cooke, S. A. Lobato, S. J. Cowling and J. W. Goodby, J. Mater. Chem. C, 2015, 3, 4333–4344 RSC.
- R. J. Mandle, E. J. Davis, C. C. A. Voll, D. J. Lewis, S. J. Cowling and J. W. Goodby, J. Mater. Chem. C, 2015, 3, 2380–2388 RSC.
- K. M. Mulligan, A. Bogner, Q. X. Song, C. P. J. Schubert, F. Giesselmann and R. P. Lemieux, J. Mater. Chem. C, 2014, 2, 8270–8276 RSC.
- C. P. J. Schubert, A. Bogner, J. H. Porada, K. Ayub, T. Andrea, F. Giesselmann and R. P. Lemieux, J. Mater. Chem. C, 2014, 2, 4581–4589 RSC.
- E. J. Davis, R. J. Mandle, B. K. Russell, P. Y. Foeller, M. S. Cook, S. J. Cowling and J. W. Goodby, Liq. Cryst., 2014, 41, 1635–1646 CrossRef CAS.
- I. Rupar, K. M. Mulligan, J. C. Roberts, D. Nonnenmacher, F. Giesselmann and R. P. Lemieux, J. Mater. Chem. C, 2013, 1, 3729–3735 RSC.
- D. L. Valentine, Nat. Rev. Microbiol., 2007, 5, 316–323 CrossRef CAS PubMed.
- K. O. Stetter, Philos. Trans. R. Soc., B, 2006, 361, 1837–1842 CrossRef CAS PubMed.
- A. Gliozzi, G. Paoli, M. Derosa and A. Gambacorta, Biochim. Biophys. Acta, Biomembr., 1983, 735, 234–242 CrossRef CAS.
- Y. Koga, Archaea, 2012, 789652, DOI:10.1155/2012/789652.
- J. S. S. Damste, S. Schouten, E. C. Hopmans, A. C. T. van Duin and J. A. J. Geenevasen, J. Lipid Res., 2002, 43, 1641–1651 CrossRef PubMed.
- G. Lecollinet, A. Gulik, G. Mackenzie, J. W. Goodby, T. Benvegnu and D. Plusquellec, Chem. – Eur. J., 2002, 8, 585–593 CrossRef CAS.
- S. J. Cowling, A. W. Hall and J. W. Goodby, Liq. Cryst., 2005, 32, 1483–1498 CrossRef CAS.
- S. J. Cowling and J. W. Goodby, Chem. Commun., 2006, 4107–4109, 10.1039/b610154b.
- J. Furukawa, N. Kawabata and J. Nishimura, Tetrahedron, 1968, 24, 53–58 CrossRef CAS.
- C. P. Johnston, R. T. Smith, S. Allmendinger and D. W. C. MacMillan, Nature, 2016, 536, 322–325 CrossRef CAS PubMed.
- O. Mitsunobu and M. Yamada, Bull. Chem. Soc. Jpn., 1967, 40, 2380–2382 CrossRef CAS.
- T. Qin, J. Cornella, C. Li, L. R. Malins, J. T. Edwards, S. Kawamura, B. D. Maxwell, M. D. Eastgate and P. S. Baran, Science, 2016, 352, 801–805 CrossRef CAS PubMed.
- L. J. Perez, W. L. Ng, P. Marano, K. Brook, B. L. Bassler and M. F. Semmelhack, J. Med. Chem., 2012, 55, 9669–9681 CrossRef CAS PubMed.
- Y. F. Tian, A. B. Ling, R. Fang, R. X. Tan and Z. Q. Liu, Green Chem., 2018, 20, 3432–3435 RSC.
- M. J. Frisch, G. W. Trucks, H. B. Schlegel, G. E. Scuseria, M. A. Robb, J. R. Cheeseman, G. Scalmani, V. Barone, B. Mennucci, G. A. Petersson, H. Nakatsuji, M. Caricato, X. Li, H. P. Hratchian, A. F. Izmaylov, J. Bloino, G. Zheng, J. L. Sonnenberg, M. Hada, M. Ehara, K. Toyota, R. Fukuda, J. Hasegawa, M. Ishida, T. Nakajima, Y. Honda, O. Kitao, H. Nakai, T. Vreven, J. A. Montgomery Jr., J. E. Peralta, F. Ogliaro, M. J. Bearpark, J. Heyd, E. N. Brothers, K. N. Kudin, V. N. Staroverov, R. Kobayashi, J. Normand, K. Raghavachari, A. P. Rendell, J. C. Burant, S. S. Iyengar, J. Tomasi, M. Cossi, N. Rega, N. J. Millam, M. Klene, J. E. Knox, J. B. Cross, V. Bakken, C. Adamo, J. Jaramillo, R. Gomperts, R. E. Stratmann, O. Yazyev, A. J. Austin, R. Cammi, C. Pomelli, J. W. Ochterski, R. L. Martin, K. Morokuma, V. G. Zakrzewski, G. A. Voth, P. Salvador, J. J. Dannenberg, S. Dapprich, A. D. Daniels, Ö. Farkas, J. B. Foresman, J. V. Ortiz, J. Cioslowski and D. J. Fox, Gaussian 09 rev E.01, 2009 Search PubMed.
- W. Humphrey, A. Dalke and K. Schulten, J. Mol. Graphics Modell., 1996, 14, 33–38 CrossRef CAS.
- M. Tarini, P. Cignoni and C. Montani, IEEE Trans. Vis. Comput. Graph., 2006, 12, 1237–1244 Search PubMed.
- R. J. Mandle, S. J. Cowling, I. Sage, M. E. Colclough and J. W. Goodby, J. Phys. Chem. B, 2015, 119, 3273–3280 CrossRef CAS PubMed.
- A. J. Leadbetter, J. C. Frost, J. P. Gaughan, G. W. Gray and A. Mosley, J. Phys., 1979, 40, 375–380 CrossRef CAS.
- A. LeCalvez, S. Montant, E. Freysz, A. Ducasse, X. W. Zhuang and Y. R. Shen, Chem. Phys. Lett., 1996, 258, 620–625 CrossRef CAS.
- S. Maisch, A.-M. Krause, D. Schmidt and M. Lehmann, Liq. Cryst., 2017, 1–16, DOI:10.1080/02678292.2017.1369595,.
- J. W. Goodby, R. J. Mandle, E. J. Davis, T. Zhong and S. J. Cowling, Liq. Cryst., 2015, 42, 593–622 CrossRef CAS.
- D. M. Agra-Kooijman, H. Yoon, S. Dey and S. Kumar, Phys. Rev. E: Stat., Nonlinear, Soft Matter Phys., 2014, 89, 032506 CrossRef PubMed.
- R. J. Mandle and J. W. Goodby, React. Chem. Eng., 2018, 3, 515–519 RSC.
- R. J. Mandle and J. W. Goodby, Liq. Cryst., 2017, 44, 656–665 CrossRef CAS.
- P. Davidson, D. Petermann and A. M. Levelut, J. Phys. II, 1995, 5, 113–131 CrossRef CAS.
- M. T. Sims, L. C. Abbott, R. M. Richardson, J. W. Goodby and J. N. Moore, Liq. Cryst., 2018, 46, 11–24 CrossRef.
- D. M. Agra-Kooijman, M. R. Fisch and S. Kumar, Liq. Cryst., 2018, 45, 680–686 CrossRef CAS.
- M. T. Sims, L. C. Abbott, J. W. Goodby and J. N. Moore, Soft Matter, 2019, 15, 7722–7732 RSC.
- M. F. Palermo, A. Pizzirusso, L. Muccioli and C. Zannoni, J. Chem. Phys., 2013, 138, 204901 CrossRef PubMed.
- R. Pecheanu and N. M. Cann, Phys. Rev. E: Stat., Nonlinear, Soft Matter Phys., 2010, 81, 041704 CrossRef CAS PubMed.
Footnote |
| † Electronic supplementary information (ESI) available. CCDC 2128187–2128191. For ESI and crystallographic data in CIF or other electronic format see DOI: 10.1039/d1tc05954h |
| This journal is © The Royal Society of Chemistry 2022 |


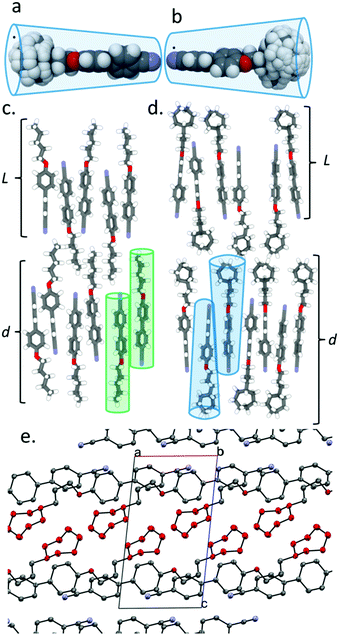
![[1 with combining macron]](https://www.rsc.org/images/entities/char_0031_0304.gif) ), hydrogen atoms are excluded and the carbon atoms of the cycloheptyl ring are coloured red, both for clarity.
), hydrogen atoms are excluded and the carbon atoms of the cycloheptyl ring are coloured red, both for clarity.
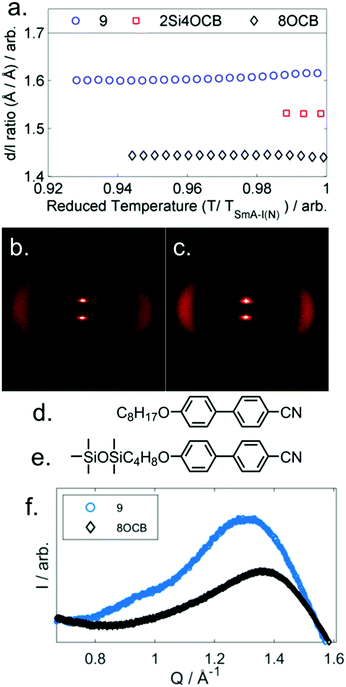

![[double bond, length as m-dash]](https://www.rsc.org/images/entities/char_e001.gif) CH2)
CH2)