
Ultrasensitive detection of multiple Alzheimer's disease biomarkers by SERS-LFA†
Yuanbao
Zhan
abc,
Ruihua
Fei
abc,
Yu
Lu
abc,
Yu
Wan
ad,
Xuming
Wu
e,
Jian
Dong
 ac,
Dianhuai
Meng
f,
Qinyu
Ge
*ac and
Xiangwei
Zhao
*abc
ac,
Dianhuai
Meng
f,
Qinyu
Ge
*ac and
Xiangwei
Zhao
*abc
aState Key Laboratory of Bioelectronics, School of Biological Science and Medical Engineering, Southeast University, Nanjing 210096, China. E-mail: xwzhao@seu.edu.cn
bInstitute of Biomaterials and Medical Devices, Southeast University, Suzhou 215163, China
cSoutheast University Shenzhen Research Institute, Shenzhen 518000, China
dJiangsu Simcere Pharmaceutical Co., Ltd, Nanjing 210042, China
eNantong Fourth People's Hospital, Jiangsu 226005, China
fRehabilitation Medical Center, The First Affiliated Hospital of Nanjing Medical University, Nanjing, 210029, China
First published on 2nd August 2022
Abstract
Alzheimer's disease (AD) is one of the top public health crises in the 21st century, especially in an aging society. Early diagnosis, prevention, and intervention can significantly reduce the risk of AD. Detection of multiple AD biomarkers in blood is an effective strategy and has drawn more and more attention in recent years. However, the concentration of AD biomarkers is very low, therefore, point-of-care testing (POCT) techniques are needed for sensitive detection. Herein, a lateral flow assay, based on Surface-enhanced Raman scattering nanotags (SERS-LFA), is proposed for the simultaneous quantification of multiple AD biomarkers including Amyloid-beta 42, Amyloid-beta 40, tau proteins, and neurofilament light chain. The limit of detection for four AD biomarkers is 138.1, 191.2, 257.1, and 309.1 fg mL−1, respectively, which are two orders of magnitude lower than their concentrations in blood. Compared with the existing detection technology, SERS-LFA has the advantages of high specificity, high sensitivity, low cost, multiple detection, and rapid detection. Therefore, SERS-LFA has a broad application prospect in the early diagnosis and monitoring of AD in the future.
Introduction
Alzheimer's disease (AD) is a neurodegenerative disease, with clinical manifestations of progressive dementia, memory loss, and cognitive decline. AD seriously endangers the physical and mental health and the quality of life of the elderly, bringing a heavy burden to the family and society. Currently, there are at least 50 million dementia patients in the world and this number is expected to reach 152 million by 2050, of which about 60–70% are AD patients.1 AD has become an increasingly serious public health and social problem, especially in today's aging society.At present, there is no radical cure for the treatment of AD. Available drugs can only delay the deterioration of symptoms, without stopping or reversing the disease development. It is generally believed that the treatment of AD is most effective at the early stages. According to recent reports, early diagnosis and intervention can significantly reduce the risk.2 The existing methods for AD diagnosis mainly include cognitive function assessment, imaging examination, cerebrospinal fluid examination, and blood examination. However, the accuracy of cognitive function assessment is low. The equipment required for imaging examination is extremely expensive, and may cause harm to the human body. The cerebrospinal fluid examination requires a lumbar puncture to collect samples, which is highly invasive. Therefore, blood examination is the most suitable method for early screening in asymptomatic populations.
The blood examination can detect changes in the AD biomarker concentration. In 2018, Nakamura et al. found that the concentration of β-amyloid (Aβ) in the blood changes about 10–15 years before the appearance of AD symptoms.3 They also found that AD patients can be identified by detecting the concentration of Aβ in plasma, with more than 90% accuracy. Subsequently, researchers also found that tau protein (tau),4,5 and neurofilament light chain protein (NFL)6 in the blood can predict the development of AD. However, their concentration in the blood is lower than that in the cerebrospinal fluid. In addition, due to the heterogeneity of dementia pathology and the complexity of the pathogenesis of AD, a single biomarker is not sufficient for accurate diagnosis, especially at an early stage.3,7,8 Therefore, it is necessary to detect multiple biomarkers in blood with high sensitivity for the accurate diagnosis of AD.
Several attempts have been made for the detection of AD biomarkers with various detection methods.9–14 For example, Pi et al. used a quantum dot based sandwich immunoassay and magnetic separation to detect Aβ42, with a detection limit up to 0.2 nmol L−1.10 Kim et al. developed a nano-plasmonic biosensor using the local surface plasmon resonance effect of gold nanorods in combination with chaotropic agents to detect tau protein in the plasma, with a detection limit up to the femtomolar level.11 Recently, a densely arranged single-walled carbon nanotube film based sensor was reported for the simultaneous detection of a different AD core biomarkers (t-tau, p-tau181, Aβ42, and Aβ40) in the plasma. By measuring the levels of t-tau/Aβ42, p-tau181/Aβ42, and Aβ42/Aβ40, AD patients were successfully separated from healthy controls.14 However, these detection methods usually have limitations such as only single biomarkers can be detected at one time, insufficient sensitivity, complex sample preparation, and high cost. In addition, there is still a long way from the practical applications of these methods in terms of robustness and ease of operation.
Lateral flow assay (LFA) is a widely used low-cost rapid blood analysis platform with point-of-care testing (POCT) technology, giving results in less than 30 minutes without professional operation, and is the most widely used.15,16 Compared with fluorescent nanoparticles, magnetic nanoparticles and other commonly used tags in biological analysis, surface-enhanced Raman scattering (SERS) nanotags have the advantages of high photostability, multi-target detection, and ultra-high sensitivity.17 Therefore, SERS nanotag-based LFA (SERS-LFA) is a common POCT technology that can realize multiplex and ultrasensitive detection. Our research group has previously realized the simultaneous detection of three acute myocardial infarction biomarkers by this approach with a detection limit at the femtomolar level.18 Currently, SERS-LFA is widely used in chemical and biomolecular analysis research.19,20
Herein, we constructed gold core silica shell (Au@SiO2) SERS nanotag-based LFA for the rapid and quantitative detection of four AD biomarkers (Aβ42, Aβ40, tau, and NFL). Compared to other SERS nanotags such as gold nanoparticles (AuNPs), the Au@SiO2 SERS nanotags exhibit higher stability. The silica shell effectively prevents the dissociation of Raman dyes. Therefore, it is more conducive to practical applications. To achieve the simultaneous detection of four AD biomarkers by a single test strip, two SERS nanotags (Au4-MBA@SiO2 and AuDNTB@SiO2) are selected with two test lines (T1 line and T2 line). The detection schematic is shown in Scheme 1. When the sample solution is dropped onto the sample pad, it flows forward to the conjugate pad by capillary force, and biomarkers in the sample solution react with the antibody on the surface of the corresponding SERS nanotags, forming an antigen–antibody hybrid complex. The formed complex flows forward with the liquid. When the complex reaches the T1 line and T2 line, the complex is captured by the immobilized antibody on the T1 line and T2 line, forming a sandwich hybrid complex. The remaining solution continues to flow forward and is captured by the goat anti-mouse IgG antibody on the control line (C line). After adding the sample solution for 20 minutes, the color of SERS nanotags on the T and C lines changes. No color change on the C line indicates an invalid detection result of SERS-LFA, and retesting is required. When the red band appears on the C line, the concentration of Aβ42 and Aβ40 is obtained by detecting Raman signals of SERS nanotags on the T1 line, and the concentration of tau and NFL is obtained by detecting the Raman signals of SERS nanotags on the T2 line. This is the first time that SERS-LFA is proposed for the simultaneous detection of four AD biomarkers on a test strip.
 | ||
| Scheme 1 Schematic illustration of multiple AD biomarkers detected by SERS-LFA. | ||
Experimental section
Materials and chemicals
Silver nitrate (AgNO3), tetrachloroaurate(III) trihydrate (HAuCl4·3H2O), trisodium citrate (Na3C6H5O7), bovine serum albumin (BSA), ascorbic acid (AA), tetraethyl orthosilicate (TEOS), polyvinylpyrrolidone K30 (PVP-K30), ammonia solution, ethanol, and mannitol were purchased from Sinopharm Chemical Reagent Co., Ltd. 4-Mercaptobenzoic acid (4-MBA) and 5,5′-dithio bis-(2-nitrobenzoic acid) (DNTB) were obtained from Alfa Aesar. 3-Glycidyloxypropyltrimethoxysilane (GPTMES), 2-hydroxy-1-ethanethiol, and N,N-dimethylformamide (DMF) were supplied by Tianjin C&S Biochemical Technology Co., Ltd. Phosphate buffered saline (PBS, 0.01 M, pH 7.4) and tri(hydroxymethyl)aminomethane hydrochloride (Tris-HCl, 0.1 M, pH 8.5) were provided by Sangon Biotech (Shanghai) Co., Ltd. All glassware was soaked in a freshly prepared aqua regia solution (HCl/HNO3, v/v, 3![[thin space (1/6-em)]](https://www.rsc.org/images/entities/char_2009.gif) :1) overnight and then rinsed thoroughly with deionized water before use.
:1) overnight and then rinsed thoroughly with deionized water before use.
Human Aβ42 peptide, human Aβ40 peptide, human tau441 protein, a pair of anti-Aβ42 monoclonal antibodies, anti-Aβ40 monoclonal antibodies, and anti-tau monoclonal antibodies were purchased from BioLegend, Inc. Human NFL peptide and a pair of anti-NFL monoclonal antibodies were provided by Abcam, Inc. Goat anti-mouse IgG antibody was purchased from Beijing Key-Bio Biotech Co., Ltd. The conjugate pad and sample pad were obtained from PALL Corporation (USA). The backing pad and absorption pad were received from Shanghai Goldbio Tech Co., Ltd (China). Nitrocellulose membrane (NC membrane) was bought from Whatman-GE Healthcare Company (UK).
Preparation of Au@SiO2 SERS nanotags
Au@SiO2 SERS nanotags were synthesized by the hydrolysis and condensation of TEOS and coating the silica shell on the surface of gold core silver shell nanoparticles. In this process, the silver shell was corroded away, forming Au@SiO2 SERS nanotags.Gold core silver shell nanoparticles were prepared by a previously reported seed-growth method.21,22 Specifically, 1 mL of 1% HAuCl4 was first added to 100 mL of water, stirred, and heated at 140 °C, followed by the addition of 0.75 mL 1% Na3C6H5O7. After 15 min of reaction, the heating was stopped and a mixture of 100 μL of 20 mM Raman dye (4-MBA or DNTB) and 100 μL of 20 mM 2-hydroxy-1-ethanethiol was added. The mixture was continuously stirred and cooled to room temperature. Then 100 mL of the above-synthesized nanoparticles were centrifuged and resuspended to the same volume of water. Next, 0.1 mL of 200 mM ascorbic acid was added, followed by adding 0.1 mL of 200 mM AgNO3 drop by drop under continuous stirring for 40 minutes.
Finally, the silica shell was synthesized by hydrolysis and condensation of TEOS. Briefly, 100 mL of the above-synthesized nanoparticles were added to 900 mL of ethanol and magnetically stirred for 30 min. Then 5 mL of 1% TEOS was added, and 100 mL of ammonia solution (added 1 mL of 20 mM Raman dye to ammonia solution) was added 10 min later. After stirring for 24 h, the mixture was heat-cured at 90 °C for 100 min. Finally, it was cooled to room temperature, centrifuged, and the precipitate was collected and resuspended in 20 mL of ethanol.
Preparation of bio-functioned SERS nanotags
For the successful conjugation of Au@SiO2 SERS nanotags to antibodies, GPTMES was attached to the Au@SiO2 SERS nanotags’ surface. Briefly, 20 mL of Au4-MBA@SiO2 or AuDNTB@SiO2 SERS nanotags were added to 200 mL of ethanol. Then 5 mL 0.1% GPTMES were added under magnetic stirring for 10 min. The mixture was stirred for 24 hours and heat-cured at 90 °C for 100 min. Finally, it was cooled to room temperature, centrifuged three times, and the precipitate was collected and resuspended in 20 mL of DMF.The conjugation of SERS nanotags and antibodies was done as follows: first, the above 1 mL GPTMES functionalized Au4-MBA@SiO2, AuDNTB@SiO2, Au4-MBA@SiO2, and AuDNTB@SiO2 SERS nanotags were mixed with 50 μL of 0.5 mg mL−1 Aβ42, Aβ40, tau, and NFL antibodies, respectively, and incubated at room temperature for 3 h. The unbound antibodies were removed by centrifugation. Next, the antibody-conjugated SERS nanotags were redispersed in 1 mL of 5% BSA solution and incubated for another 1.5 h at room temperature. Finally, the blocking solution was removed by centrifugation, and bio-functioned Au@SiO2 SERS nanotags were redissolved in 100 μL of re-suspending solution (2 wt% PVP-K30, 1 wt% mannitol, 2 wt% BSA, and 7 wt% sucrose dissolved in 0.1 M Tris-HCl buffer) and stored at 4 °C.
Preparation of lateral flow assay
First, Aβ42 capturing antibody solution (1 mg mL−1) and Aβ40 capturing antibody solution (1 mg mL−1) were mixed. Similarly, NFL capturing antibody (1 mg mL−1) and tau capturing antibody (1 mg mL−1) were also mixed. Then two mixed antibodies and a goat anti-mouse IgG antibody (1 mg mL−1) were fixed on the T1 line, T2 line, and C line of the NC membrane, respectively. The application volume was 1 μL cm−1 and the distance between the lines was 3 mm. Next, the NC membrane was dried at 37 °C for 1 h and stored under dry conditions.To assemble the lateral flow assay, first, the NC membrane was fixed in the middle of the backing. The absorbent pad was then fixed at the end of the backing. Next, the sample and the conjugate pads were fixed at the head end. During the fixing process, the ends of each part overlapped each other to ensure the continuous flow of sample solution along each part through capillary action. Finally, the assembled card was cut to the test strips with 3 mm width and stored in a desiccant for later use.
Detection of multiple AD biomarkers
Before the test, an equal molar mixture of biomarker detection antibody-connected Au4-MBA@SiO2, AuDNTB@SiO2, Au4-MBA@SiO2, and AuDNTB@SiO2 SERS nanotags was put in a conjugate pad. Then mixed solutions of Aβ42, Aβ40, tau and NFL (1:1:1:1, v/v/v/v) with different concentrations (100 fg mL−1 to 10 μg mL−1) were prepared. 100 μL of mixed solutions of different concentrations were added to the sample pad of the test strip and after 20 minutes the color change on the C line was observed. Finally, the Raman microscopy system was used to detect the mixed SERS spectra on the T line for the quantitative detection of multiple AD biomarkers, and each concentration gradient was tested three times.
Instruments
AuNPs and SERS nanotags were characterized by scanning electron microscopy (SEM, Carl Zeiss), and transmission electron microscopy (TEM, JEOL Ltd). UV-vis absorption spectra were recorded on a UV/Vis/NR spectrophotometer (Hitachi, Japan). The hydrodynamic diameter and zeta potential were measured using a nanozeta sizer (Malvern, UK). The Invia Raman microRaman spectroscopy system (British Renishaw Company) was used to obtain the SERS spectra of SERS nanotags and the SERS-LFA T line. Renishaw Wire 4.2 software was used to calibrate the baseline of the SERS spectra. The wavelength of the 785 nm laser was selected. The objective lens with a magnification of 20× was selected, and the integration time was 10 s.Results and discussion
Characterization and optimization of SERS nanotags
The synthesis process for the Au@SiO2 SERS nanotag was as follows: AuNPs were prepared by the citrate thermal reduction method. The Raman dye (4-MBA or DNTB) was attached to the surface of AuNPs by an Au–S bond. Silver shells were formed on the AuNPs’ surface. Finally, the silica shell was formed by the hydrolysis and condensation of TEOS. The formed silica shell was modified with epoxy groups for the immobilization of the detection antibody. Au@SiO2 SERS nanotags were synthesized by the hydrolysis and condensation of TEOS to coat a silica shell on the surface of gold core silver shell nanoparticles. In this process, the silver shell corroded away, thereby, forming Au@SiO2 SERS nanotags. We found that this synthetic method has a higher success rate.To verify the successful synthesis of Au@SiO2 SERS nanotags, we obtained TEM images of Au and Au@SiO2 SERS nanotags. Fig. 1 shows that the particles are successfully synthesized with a particle size of 80 nm and a shell thickness of 10 nm. In addition, TEM images also reveal that the particles are well-dispersed.
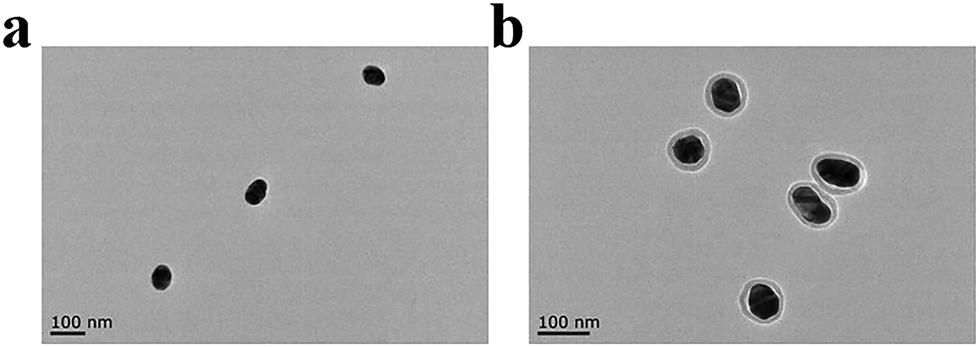 | ||
| Fig. 1 TEM images of AuNPs and Au@SiO2 SERS nanotags. (a) AuNPs. (b) Au@SiO2 SERS nanotags. | ||
Furthermore, we optimized the thickness of the silica shell. Although the existence of the silica shell can effectively prevent the dissociation of Raman dyes, the Raman signals are weakened when the shell is too thick. Therefore, it is crucial to choose the appropriate thickness of the silica shell. Thickness can be controlled by adding a different dosage of TEOS. To determine the optimal dosage of TEOS, 8 mL, 5 mL, and 2 mL of TEOS were added to obtain Au@SiO2 SERS nanotags. SEM images and Raman signals of the obtained particles are shown in Fig. S1, S2,† and Fig. 2. Although the synthesized SERS nanotags by adding 8 mL of TEOS exhibit a good core–shell structure, the shell thickness is 20 nm, which will greatly reduce for the Raman signals. The synthesized SERS nanotags by 2 mL of TEOS can obtain very high Raman signals, however, its silica shell is not complete and does not cover the entire AuNP surface, therefore, it cannot prevent the dissociation of Raman dye from the surface of AuNPs. Only the SERS nanotags synthesized by adding 5 mL of TEOS yield a complete core–shell structure and obtain relatively high Raman signals. Therefore, Au@SiO2 SERS nanotags synthesized by 5 mL of TEOS are selected for subsequent experiments.
 | ||
| Fig. 2 Optimization results of Au@SiO2 SERS nanotags. (a) Silica shell thickness of the Au@SiO2 SERS nanotags synthesized with different TEOS dosages. (b) Raman signals of the Au@SiO2 SERS nanotags synthesized with different TEOS dosages. The error bar represents the average result of three measurements. | ||
Raman signals of Au@SiO2 SERS nanotags
SERS nanotags encoded by different Raman dyes are required to realize the simultaneous detection of multiple AD biomarkers with SERS-LFA. Based on previous studies,23,24 4-MBA and DNTB encoded SERS nanotags are selected. The SERS spectra of two SERS nanotags are shown in Fig. 3a. It can be seen from the figure that their characteristic Raman peak positions are 1079 cm−1 and 1330 cm−1, respectively, preventing the overlap of Raman characteristic peaks. In addition, Raman intensities before and after mixing the two SERS nanotags are also compared. As shown in Fig. 3b, the Raman intensities of the corresponding Raman characteristic peaks hardly change, further indicating that the Raman peaks of two SERS nanotags did not overlap. Moreover, the intensities of the corresponding characteristic peaks of two Raman dye-encoded SERS nanotags are similar. All these results suggest that two Au@SiO2 SERS nanotags can be used for the subsequent multiplex quantitative detection.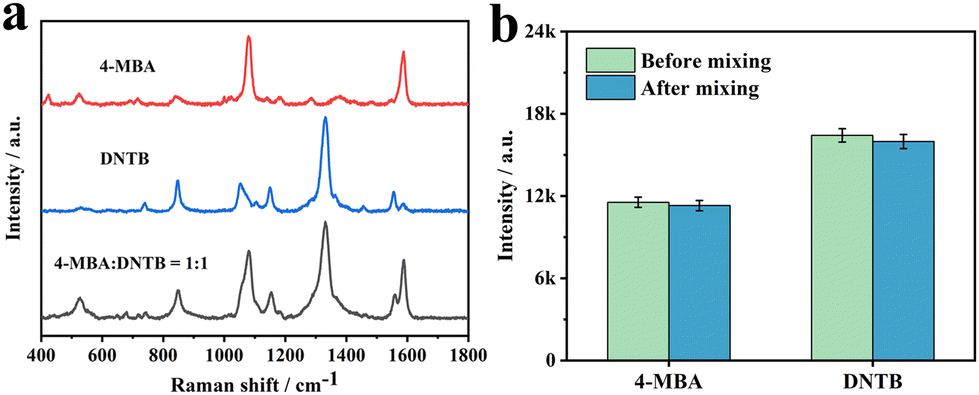 | ||
| Fig. 3 Raman signals of Au4-MBA@SiO2 SERS nanotags, AuDNTB@SiO2 SERS nanotags, and equimolar mixing of the two SERS nanotags. (a) SERS spectra. (b) Raman intensities at 1079 cm−1 and 1330 cm−1 in the SERS spectra. The error bar represents the average result of three measurements. | ||
Stability of Au@SiO2 SERS nanotags
For freshly prepared AuNPs and Au@SiO2 SERS nanotags, the Raman signal of AuNPs is slightly higher than that of Au@SiO2 SERS nanotags (Fig. 4). This is mainly attributed to the silica shell on the Au@SiO2 SERS nanotag, which interferes with the excitation light reaching the surface of AuNPs, resulting in a slight decrease in the Raman signal. | ||
| Fig. 4 Raman signals of Au and Au@SiO2 SERS nanotags. (a) SERS spectra. (b) Raman intensities at 1079 cm−1 and 1330 cm−1 of the SERS spectra. The error bar represents the average result of three measurements. | ||
However, in terms of long-term stability, the Raman signals of AuNPs drop significantly after storing at room temperature for one month, and their Raman signals are only 30% of the original signal, as shown in Fig. 5a and b. Whereas, the Raman signals of two Au@SiO2 SERS nanotags are almost unchanged even after 4 months (Fig. 5c and d). These results indicate the excellent stabilities of Au@SiO2 SERS nanotags, conducive to subsequent quantitative detection and practical applications. Therefore, Au@SiO2 SERS nanotags are selected for further quantitative detection.
 | ||
| Fig. 5 Stability experiments of AuNPs and Au@SiO2 SERS nanotags. (a) Raman intensities of Au4-MBA at 1079 cm−1 at different times. (b) Raman intensities of AuDNTB at 1330 cm−1 at different times. (c) Raman intensities of Au4-MBA@SiO2 at 1079 cm−1 at different times. (d) Raman intensities of Audntb@SiO2 at 1330 cm−1 at different times. The error bar represents the average result of three measurements. | ||
Characterization of bio-functioned SERS nanotags
When Au@SiO2 SERS nanotags are used for AD biomarker detection, they are conjugated with antibodies. To verify the successful conjugation of antibodies on Au@SiO2 SERS nanotags, they are characterized by immobilizing antibodies. Taking the antibody functionalization of Au4-MBA@SiO2 SERS nanotags as an example, the hydrodynamic diameter and zeta potential of nanoparticles at different synthesis steps are measured by dynamic light scattering (DLS). Fig. 6a and c show that the hydrodynamic diameter of SERS nanotags gradually increased, and the zeta potential also changed, suggesting the successful modification of SERS nanotags. In addition, the UV-vis absorption analysis is also carried out to further verify the successful attachment of the antibody on the SERS nanotags, and the absorption peak shifts are consistent with those of DLS (Fig. 6b). Finally, to study the effect of antibody functionalization on Raman signals of Au@SiO2 SERS nanotags, Raman signals of SERS nanotags during the antibody functionalization process are measured. The coupling of SERS nanotags with the antibody does not weaken the Raman signals, as shown in Fig. 6d. Therefore, the above results indicate that the successful coupling of SERS nanotags to the antibody without weakening the Raman signals, further laying the foundation for the following detection application. | ||
| Fig. 6 Characterization results of SERS nanotags with immobilized antibodies. (a) Hydrodynamic diameter. (b) UV-vis absorption spectra. (c) Zeta potential. (d) SERS spectra. The error bar represents the average result of three measurements. | ||
Detection of multiple AD biomarkers by SERS-LFA
Cross-reaction is a common phenomenon in multiple immunoassay reactions, and can seriously affect the detection accuracy of results. Therefore, SERS-LFA is first evaluated for cross-reactivity. 10 μg mL−1 Aβ42, Aβ40, tau, NFL, Aβ42 and Aβ40 mixed solution, tau and NFL mixed solution, four AD biomarkers (Aβ42, Aβ40, tau, and NFL) mixed solution, and PBS are used to study the cross-reaction of SERS-LFA. The photographs of test strips after detection and changes in Raman intensities on T lines are shown in Fig. 7a. Only the solution containing the corresponding AD biomarker changes the color of the corresponding T line to red. Furthermore, the Raman signals on T lines of all test strips are also measured, and the Raman signals at the corresponding characteristic peak are detected only when the solution contains the corresponding AD biomarker (Fig. 7b). These results indicate that SERS-LFA has high specificity and selectivity, and we can use the characteristic peaks to accurately and quantitatively detect the corresponding AD biomarkers. | ||
| Fig. 7 Specificity evaluation of the SERS-LFA detection method. (a) Photographs of test strips for detecting different ad biomarkers at 10 μg ml−1. (b) Raman intensities at 1079 cm−1 and 1330 cm−1 on the T line of the test strip. The error bars represent the average results of three measurements. | ||
The performance of SERS-LFA for the quantitative detection of multiple AD biomarkers is evaluated to detect mixed solutions of four AD biomarkers (Aβ42, Aβ40, tau, and NFL) at different concentrations. When the mixed solutions are added to the sample pad for 20 minutes, the SERS spectra of two T-lines are measured. Fig. 8a shows photographs of test strips after detection. With decreasing concentration, the color of two T lines becomes lighter and lighter. The lowest concentration of AD biomarkers is approximately 1 ng mL−1 which can be seen with the naked eye. Furthermore, the Raman signals on T lines are also measured. Fig. 8(b and c) indicate that the Raman intensities of characteristic peaks on each T line also increase with the increase in corresponding biomarker concentration. When the concentration of AD biomarkers is lower than 1 ng mL−1, the change in Raman signals is still detected on the T line of the test strip.
 | ||
| Fig. 8 Detection of four ad biomarkers at different concentrations by SERS-LFA. (a) Photographs of test strips. (b) SERS spectra on T1 line. (c) SERS spectra on T2 line. (d) The linear fitting diagram of Raman intensities at 1079 cm−1 on the T1 line with the Aβ42 concentration. (e) The linear fitting diagram of Raman intensities at 1330 cm−1 on the T1 line with the Aβ40 concentration. (f) The linear fitting diagram of Raman intensities at 1079 cm−1 on the T2 line with the tau concentration. (g) The linear fitting diagram of Raman intensities at 1330 cm−1 on the T2 line with the NFL concentration. The error bars represent the average of three measurements result. | ||
According to the Raman intensities at 1079 cm−1 and 1330 cm−1 on the T line, the linear fitting diagram of Raman intensities on the T line with AD biomarkers concentration is plotted. Fig. 8(d–g) reveal that the linear dynamic ranges (LDR) of Aβ42, Aβ40, tau, and NFL are 0.001–1000 ng mL−1, covering 6 orders of magnitude. The R2 values of Aβ42, Aβ40, tau, and NFL are 0.980, 0.947, 0.958, and 0.963, respectively, demonstrating a very high linear correlation.
In addition, the limit of detection (LOD) of the SERS-LFA for the simultaneous detection of four AD biomarkers is calculated by the following equation:24
| LOD = γblank + 3 × SDblank. |
Where γblank is the average signal intensity when the concentration is zero, and the SDblank represents the standard deviation. According to the dose–response curves (Fig. S3†), the LODs for Aβ42, Aβ40, tau, and NFL are 138.1, 191.2, 257.1, and 309.1 fg mL−1, respectively, which are equivalent to or lower than the currently reported detection methods (Table 1). However, these reported detection methods usually have disadvantages of single biomarker detection at one time, insufficient sensitivity, complex sample preparation, and high cost. Our proposed detection method achieves high sensitivity with the advantages of simple sample preparation and low cost. More importantly, it can simultaneously detect four AD biomarkers with high sensitivity. As far as we know, this is the first time that SERS-LFA is reported to simultaneously detect four AD biomarkers on a test strip, and the LOD is about two orders of magnitude lower than the concentration of the relevant AD biomarkers in the blood. Therefore, SERS-LFA can be used to detect AD biomarkers in the blood in the future.
| Method | Aβ42 | Aβ40 | Tau | NFL | Ref. |
|---|---|---|---|---|---|
| Abbreviations: ECL, electrochemiluminescence; SPR, Surface Plasmon Resonance; SERS, Surface-Enhanced Raman Scattering; EB, Electrochemical Biosensor; LFA, Lateral Flow Assay. | |||||
| Colorimetry | 2.3 nM | 0.6 nM | — | — | 9 and 25 |
| Fluorescence | 0.2 nM | 1.00 nM | 9.3 pM | — | 10, 26 and 27 |
| ECL | 2.6 fg mL−1 | — | — | 0.6 pg mL−1 | 28 and 29 |
| SPR | 26 fM | 34.9 fM | 100 fM | — | 11 and 30 |
| SERS | 0.33 pg mL−1 | 0.25 pg mL−1 | 0.42 fM | — | 31 and 32 |
| EB | 2.13 fM | 2.20 fM | 2.45 fM | 3.0 pg mL−1 | 14 and 33 |
| SERS-LFA | 138.1 fg mL −1 | 191.2 fg mL −1 | 257.1 fg mL −1 | 309.1 fg mL −1 | This work |
Conclusions
In this study, we constructed Au@SiO2 SERS nanotag-based LFA (SERS-LFA) for the rapid and quantitative detection of four AD biomarkers (Aβ42, Aβ40, tau, and NFL). The prepared Au@SiO2 SERS nanotags exhibited excellent stabilities, suitable for their practical applications in the future. To simultaneously detect four AD biomarkers on a single test strip, two SERS nanotags (Au4-MBA@SiO2 and AuDNTB@SiO2) were selected, and two T lines were setup. The obtained results showed that the LDR was 0.001–1000 ng mL−1, covering six orders of magnitude and the LOD of Aβ42, Aβ40, tau, and NFL was 138.1, 191.2, 257.1, and 309.1 fg mL−1, respectively, which were about two orders of magnitude lower than their concentrations in blood. This is the first time that SERS-LFA is proposed to simultaneously detect four AD biomarkers. In addition, the detection method shows high specificity with a detection time of less than 30 minutes. Compared with the existing detection technology, SERS-LFA is ultrasensitive, fast, low-cost, and easy to use. More importantly, SERS-LFA is combined with a portable Raman spectrometer, for the detection of AD biomarkers at home. Therefore, this detection method can be used for large-scale early screening of AD and has a broad application prospect in the early diagnosis and monitoring of AD in the future.Conflicts of interest
The authors declare no conflicts of interest.Acknowledgements
This work was financially supported by Central Funds Guiding the Local Science and Technology Development of Shenzhen (2021Szvup024) and Jiangsu Provincial Key Research and Development Program (BE2021664).References
- C. Patterson, World Alzheimer Report 2018: The State of the Art of Dementia Research, New Frontiers, London, UK, 2018 Search PubMed.
- S. Norton, F. E. Matthews, D. E. Barnes, K. Yaffe and C. Brayne, Lancet Neurol., 2014, 13, 788–794 CrossRef PubMed.
- A. Nakamura, N. Kaneko, V. L. Villemagne, T. Kato, J. Doecke, V. Doré, C. Fowler, Q. X. Li, R. Martins, C. Rowe, T. Tomita, K. Matsuzaki, K. Ishii, K. Ishii, Y. Arahata, S. Iwamoto, K. Ito, K. Tanaka, C. L. Masters and K. Yanagisawa, Nature, 2018, 554, 249–254 CrossRef CAS PubMed.
- E. H. Thijssen, R. La Joie, A. Wolf, A. Strom, P. Wang, L. Iaccarino, V. Bourakova, Y. Cobigo, H. Heuer, S. Spina, L. VandeVrede, X. Chai, N. K. Proctor, D. C. Airey, S. Shcherbinin, C. D. Evans, J. R. Sims, H. Zetterberg, K. Blennow, A. M. Karydas, C. E. Teunissen, J. H. Kramer, L. T. Grinberg, W. W. Seeley, H. Rosen, B. F. Boeve, B. L. Miller, G. D. Rabinovici, J. L. Dage, J. C. Rojas, A. L. Boxer, L. Forsberg, D. S. Knopman, N. Graff-Radford, M. Grossman, E. H. Huey, C. Onyike, D. Kaufer, E. Roberson, N. Ghoshal, S. Weintraub, B. Appleby, I. Litvan, D. Kerwin, M. Mendez, Y. Bordelon, G. Coppola, E. M. Ramos, M. C. Tartaglia, G. Y. Hsiung, I. MacKenzie, K. Domoto-Reilly, T. Foroud and B. C. Dickerson, Nat. Med., 2020, 26, 387–397 CrossRef CAS PubMed.
- S. Palmqvist, P. Tideman, N. Cullen, H. Zetterberg, K. Blennow, J. L. Dage, E. Stomrud, S. Janelidze, N. Mattsson-Carlgren and O. Hansson, Nat. Med., 2021, 27, 1034–1042 CrossRef CAS PubMed.
- O. Preische, S. A. Schultz, A. Apel, J. Kuhle, S. A. Kaeser, C. Barro, S. Gräber, E. Kuder-Buletta, C. LaFougere, C. Laske, J. Vöglein, J. Levin, C. Masters, R. Martins, P. Schofield, M. N. Rossor, N. Graff-Radford, S. Salloway, B. Ghetti, J. Ringman, J. Noble, J. Chhatwal, A. Goate, T. Benzinger, J. Morris, R. Bateman, G. Wang, A. Fagan, E. McDade, B. Gordon, M. Jucker, R. Allegri, F. Amtashar, S. Berman, C. Bodge, S. Brandon, W. Brooks, J. Buck, V. Buckles, S. Chea, P. Chrem, H. Chui, J. Cinco, J. Clifford, C. Cruchaga, M. D'Mello, T. Donahue, J. Douglas, N. Edigo, N. Erekin-Taner, M. Farlow, A. Farrar, H. Feldman, G. Flynn, N. Fox, E. Franklin, H. Fujii, C. Gant, S. Gardener, J. Goldman, J. Gray, J. Gurney, J. Hassenstab, M. Hirohara, D. Holtzman, R. Hornbeck, S. H. DiBari, T. Ikeuchi, S. Ikonomovic, G. Jerome, C. Karch, K. Kasuga, T. Kawarabayashi, W. Klunk, R. Koeppe, J. H. Lee, D. Marcus, N. S. Mason, D. Maue-Dreyfus, L. Montoya, H. Mori, A. Nagamatsu, K. Neimeyer, J. Norton, R. Perrin, M. Raichle, J. H. Roh, H. Shimada, T. Shiroto, M. Shoji, W. Sigurdson, H. Sohrabi, P. Sparks, K. Suzuki, L. Swisher, K. Taddei, J. Wang, P. Wang, M. Weiner, M. Wolfsberger, C. Xiong and X. Xu, Nat. Med., 2019, 25, 277–283 CrossRef CAS PubMed.
- T. Skillbäck, B. Y. Farahmand, C. Rosén, N. Mattsson, K. Nägga, L. Kilander, D. Religa, A. Wimo, B. Winblad, J. M. Schott, K. Blennow, M. Eriksdotter and H. Zetterberg, Brain, 2015, 138, 2716–2731 CrossRef PubMed.
- S. Janelidze, H. Zetterberg, N. Mattsson, S. Palmqvist, H. Vanderstichele, O. Lindberg, D. van Westen, E. Stomrud, L. Minthon, K. Blennow and O. Hansson, Ann. Clin. Transl. Neurol., 2016, 3, 154–165 CrossRef CAS PubMed.
- T. Hu, S. Lu, C. Chen, J. Sun and X. Yang, Sens. Actuators, B, 2017, 243, 792–799 CrossRef CAS.
- J. Pi, Y. Long, N. Huang, Y. Cheng and H. Zheng, Talanta, 2016, 146, 10–15 CrossRef CAS PubMed.
- H. Kim, J. U. Lee, S. Kim, S. Song and S. J. Sim, ACS Sens., 2019, 4, 595–602 CrossRef CAS PubMed.
- H. Gao, M. Liu, Z. Zhao, C. Yang, L. Zhu, Y. Cai, Y. Yang and Z. Hu, ACS Appl. Mater. Interfaces, 2020, 12, 9693–9700 CrossRef CAS PubMed.
- Y. Yu, X. Sun, D. Tang, C. Li, L. Zhang, D. Nie, X. Yin and G. Shi, Biosens. Bioelectron., 2015, 68, 115–121 CrossRef CAS PubMed.
- K. Kim, M. J. Kim, D. W. Kim, S. Y. Kim, S. Park and C. B. Park, Nat. Commun., 2020, 11, 1–9 CrossRef PubMed.
- V. T. Nguyen, S. Song, S. Park and C. Joo, Biosens. Bioelectron., 2020, 152, 112015 CrossRef CAS PubMed.
- Q. Zhang, L. Fang, B. Jia, N. Long, L. Shi, L. Zhou, H. Zhao and W. Kong, TrAC, Trends Anal. Chem., 2021, 144, 116427 CrossRef CAS.
- J. F. Li, Y. J. Zhang, S. Y. Ding, R. Panneerselvam and Z. Q. Tian, Chem. Rev., 2017, 117, 5002–5069 CrossRef CAS PubMed.
- D. Zhang, L. Huang, B. Liu, H. Ni, L. Sun, E. Su, H. Chen, Z. Gu and X. Zhao, Biosens. Bioelectron., 2018, 106, 204–211 CrossRef CAS PubMed.
- K. Kim, L. Kashefi-Kheyrabadi, Y. Joung, K. Kim, H. Dang, S. G. Chavan, M. H. Lee and J. Choo, Sens. Actuators, B, 2021, 329, 129214 CrossRef CAS.
- L. Wang, X. Wang, L. Cheng, S. Ding, G. Wang, J. Choo and L. Chen, Biosens. Bioelectron., 2021, 189, 113360 CrossRef CAS PubMed.
- Y. Huang, Y. Yang, Z. Chen, X. Li and M. Nogami, J. Mater. Sci., 2008, 43, 5390–5393 CrossRef CAS.
- Y. Xie, H. Chang, K. Zhao, J. Li, H. Yang, L. Mei, S. Xu and A. Deng, Anal. Methods, 2015, 7, 513–520 RSC.
- R. Chen, B. Liu, H. Ni, N. Chang, C. Luan, Q. Ge, J. Dong and X. Zhao, Analyst, 2019, 144, 4051–4059 RSC.
- R. Chen, X. Du, Y. Cui, X. Zhang, Q. Ge, J. Dong and X. Zhao, Small, 2020, 16, 2002801 CrossRef CAS PubMed.
- Y. Zhou, H. Dong, L. Liu and M. Xu, Small, 2015, 11, 2144–2149 CrossRef CAS PubMed.
- L. Chen, J. Lin, J. Yi, Q. Weng, Y. Zhou, Z. Han, C. Li, J. Chen and Q. Zhang, Anal. Bioanal. Chem., 2019, 411, 5277–5285 CrossRef CAS PubMed.
- W. Chen, G. Gao, Y. Jin and C. Deng, Talanta, 2020, 216, 120930 CrossRef CAS PubMed.
- D. Qin, S. Meng, Y. Wu, G. Mo, X. Jiang and B. Deng, ACS Sustainable Chem. Eng., 2021, 9, 7541–7549 CrossRef CAS.
- J. Kuhle, A. Regeniter, D. Leppert, M. Mehling, L. Kappos, R. L. P. Lindberg and A. Petzold, J. Neuroimmunol., 2010, 220, 114–119 CrossRef CAS PubMed.
- H. Kim, J. U. Lee, S. Song, S. Kim and S. J. Sim, Biosens. Bioelectron., 2018, 101, 96–102 CrossRef CAS PubMed.
- X. Zhang, S. Liu, X. Song, H. Wang, J. Wang, Y. Wang, J. Huang and J. Yu, ACS Sens., 2019, 4, 2140–2149 CrossRef CAS PubMed.
- J. K. Yang, I. J. Hwang, M. G. Cha, H. I. Kim, D. B. Yim, D. H. Jeong, Y. S. Lee and J. H. Kim, Small, 2019, 15, 1–12 Search PubMed.
- A. Valverde, A. Montero-Calle, R. Barderas, M. Calero, P. Yáñez-Sedeño, S. Campuzano and J. M. Pingarrón, Electrochim. Acta, 2021, 371, 137815 CrossRef CAS.
Footnote |
| † Electronic supplementary information (ESI) available. See DOI: https://doi.org/10.1039/d2an00717g |
| This journal is © The Royal Society of Chemistry 2022 |