
 Open Access Article
 This Open Access Article is licensed under a Creative Commons Attribution-Non Commercial 3.0 Unported Licence
Versatile naphthalimide tetrazines for fluorogenic bioorthogonal labelling†
Marcus E.
Graziotto
 ab,
Liam D.
Adair
ab,
Amandeep
Kaur
cd,
Pauline
Vérité
e,
Sarah R.
Ball
c,
Margaret
Sunde
cd,
Denis
Jacquemin
e and
Elizabeth J.
New
*abd
ab,
Liam D.
Adair
ab,
Amandeep
Kaur
cd,
Pauline
Vérité
e,
Sarah R.
Ball
c,
Margaret
Sunde
cd,
Denis
Jacquemin
e and
Elizabeth J.
New
*abd
aThe University of Sydney, School of Chemistry, NSW 2006, Australia. E-mail: elizabeth.new@sydney.edu.au
bAustralian Research Council Centre of Excellence for Innovations in Peptide and Protein Science, The University of Sydney, NSW 2006, Australia
cThe University of Sydney, School of Medical Sciences, Faculty of Medicine and Health, NSW 2006, Australia
dThe University of Sydney Nano Institute (Sydney Nano), The University of Sydney, NSW 2006, Australia
eCEISAM Lab, CNRS, Université de Nantes, Nantes, France
First published on 5th July 2021
Abstract
Fluorescent probes for biological imaging have revealed much about the functions of biomolecules in health and disease. Fluorogenic probes, which are fluorescent only upon a bioorthogonal reaction with a specific partner, are particularly advantageous as they ensure that fluorescent signals observed in biological imaging arise solely from the intended target. In this work, we report the first series of naphthalimide tetrazines for bioorthogonal fluorogenic labelling. We establish that all of these compounds can be used for imaging through photophysical, analytical and biological studies. The best candidate was Np6mTz, where the tetrazine ring is appended to the naphthalimide at its 6-position via a phenyl linker in a meta configuration. Taking our synthetic scaffold, we generated two targeted variants, LysoNpTz and MitoNpTz, which successfully localized within the lysosomes and mitochondria respectively, without the requirement of genetic modification. In addition, the naphthalimide tetrazine system was used for the no-wash imaging of insulin amyloid fibrils in vitro, providing a new method that can monitor their growth kinetics and morphology. Since our synthetic approach is simple and modular, these new naphthalimide tetrazines provide a novel scaffold for a range of bioorthogonal tetrazine-based imaging agents for selective staining and sensing of biomolecules.
Introduction
Fluorescent probes are a mainstay of molecular imaging, providing previously inaccessible information about the complex chemistry of biomolecules, cells and organisms.1–3 Recent advances in bioorthogonal chemistry have allowed for the development of fluorogenic probes, for which fluorescence intensities dramatically increase upon a click reaction with a bioorthogonal partner.4,5 These fluorogenic probes have been extensively used to image biological structures, revealing their significance during health and disease.6Of the suite of bioorthogonal reactions developed for studies of biological processes, the tetrazine ligation has been extensively utilized for fluorogenic probes.7,8 The 1,2,4,5-tetrazines have attracted much attention due to their ability to quench fluorescence via both through-space Förster resonance energy transfer (FRET)9 and through-bond energy transfer (TBET) processes.10–12 They have been shown to react rapidly (second-order rate constants up to 106 M−1 s−1)4 in inverse electron demand Diels Alder (IEDDA) reactions with a range of strained dienophiles such as trans-cyclooctenes8 and bicyclononynes.13 The IEDDA reaction of a tetrazine with a strained cycloalkyne produces a pyridazine with only N2 as a by-product (Fig. 1A). Fluorescence is restored to the fluorophore as pyridazines do not quench fluorescence through energy transfer and hence the tetrazine-BCN ligation is an excellent strategy for fluorogenic labelling.14
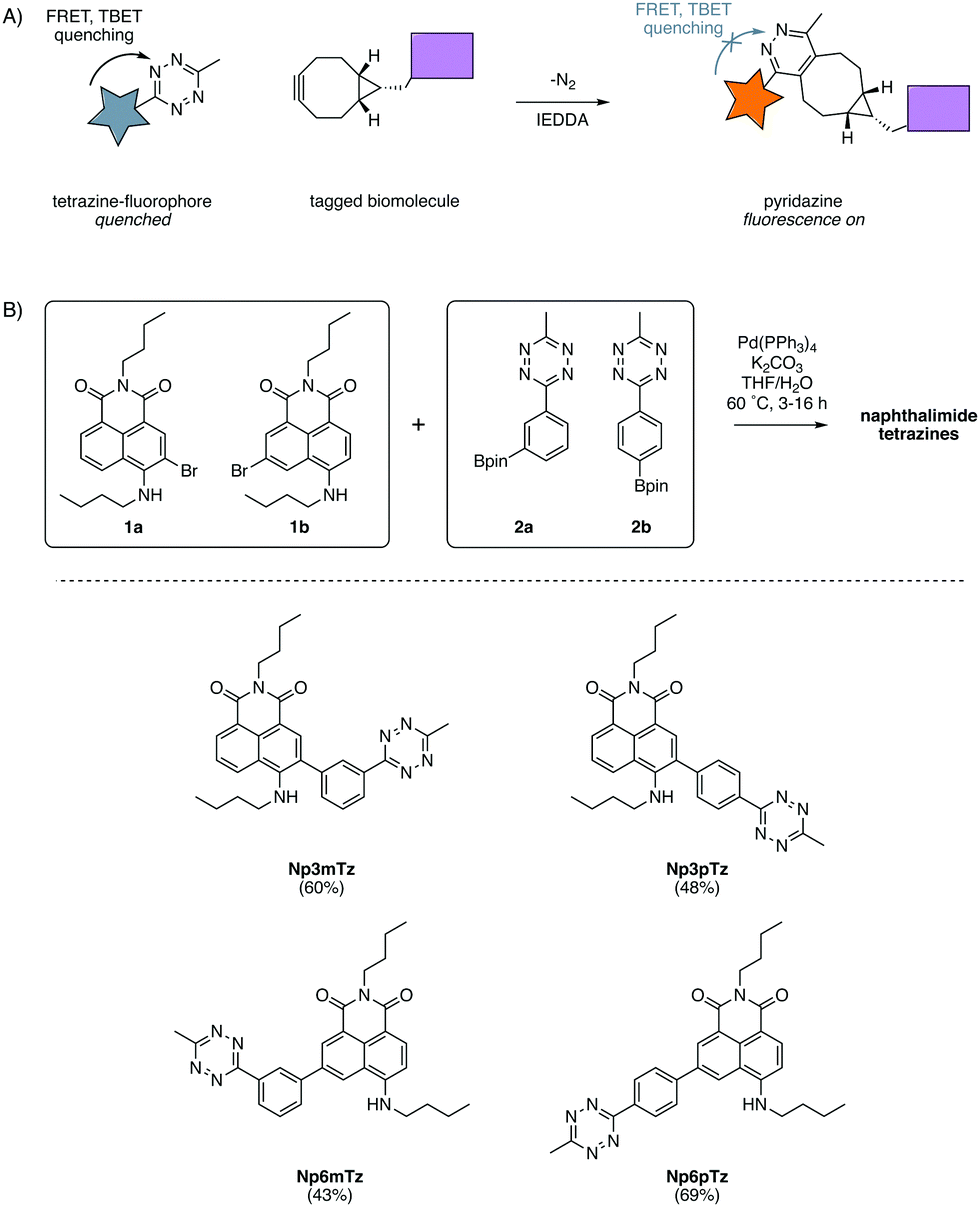 | ||
| Fig. 1 (A) Fluorescent tagging of biomolecules using the tetrazine ligation. Tetrazines quench appended fluorophores via FRET and TBET and after reaction with a cycloalkyne, form a pyridazine which does not quench fluorescence. (B) Synthesis of the four desired naphthalimide tetrazines through the coupling of 1a or 1b with 2a or 2b. | ||
Many tetrazine-containing fluorogenic probes have been synthesized with emission wavelengths spanning the visible and infrared spectrum, commonly employing coumarin,15 fluorescein,16 rhodamine,17 cyanine,18 BODIPY12 and other commercial and novel scaffolds.19–25 All of these have been utilized in confocal microscopy, and some for super resolution imaging.26–28 Typically, these reports require the genetic modification of a native protein to incorporate a bioorthogonal reactive group and this method only provides information on the localization of that macromolecule. The few notable exceptions, where fluorogenic tetrazines have been used for targeted or analyte sensing, include: a Mg2+ fluorescent sensor with a tetrazine for organelle-localized Mg2+ detection;29 a fluorogenic reaction to quantify endocytosis of antibody conjugates;30 and using tetrazines as a phototrigger to activate organelle-targeted stains.31 We ascribe the lack of development in this area due to the challenge of finding fluorescent moieties which have synthetic handles that can be readily decorated with sensing or targeting groups.
The 4-amino-1,8-naphthalimides are a class of fluorophores for which tetrazine conjugates for bioimaging applications have not been reported to date. These fluorophores have great potential for bioimaging due to their brightness, large Stokes shifts and good photostability.32 In addition, they can be readily synthetically modified at the imide, 4-amino-position and 3-, 5- or 6-positions of the naphthalene core.32,33 There are some reports of fluorogenic naphthalimides for biological imaging and protein labelling, with the fluorogenic changes arising from click reactions involving azides and alkynes,34 SNAP tags,35 sydnones,36 and oximes.37 However, there are no reports of fluorogenic 4-amino-naphthalimides incorporating tetrazines for biological imaging. To the best of our knowledge, the only two naphthalimide tetrazines reported to date were developed for electrochemical applications and not applied to biological imaging. They were unsuitable for biological application as these reports used a 1,8-naphthalimide that has significantly shorter excitation and emission wavelengths compared to 4-amino-substituted naphthalimides.38–41
In this work, we describe the efficient synthesis and photophysical properties of the first series of naphthalimide tetrazines that can be used for biological imaging. Using the optimized scaffold from these studies, we developed live cell fluorogenic organelle-targeted probes that do not require genetic modification or antibody-based stains. In addition, the naphthalimide tetrazines were used to label insulin amyloid fibrils in vitro, without washing and without affecting their growth kinetics.
Results and discussion
Design and synthesis
In our previous work with substituted naphthalimides, we identified that derivatives with substituents installed at the 3- and 6-position on the naphthalene core exhibited the best photophysical properties for imaging.32 We chose to conjugate the tetrazine at the 3- and 6-positions with a phenyl ring to ensure TBET quenching.12 FRET quenching is also expected to occur in this molecule as the naphthalimide and tetrazine are in close proximity. As FRET is directional, it was anticipated that the configuration across the phenyl ring would cause different degrees of quenching.15 Hence, we investigated molecules in which the tetrazine was installed in meta and para configurations on the phenyl ring, relative to the naphthalimide. Four compounds were designed to explore the relative degree of quenching and subsequent fluorescence turn-ons of naphthalimide tetrazines.A convergent synthetic route was envisaged, employing a convergent cross-coupling between bromo-naphthalimides and tetrazine-aryl-boronate esters as the final step. 3-Bromo-naphthalimide (1a) and 6-bromo-naphthalimide (1b) were obtained from anhydride intermediates in moderate yields using previously reported conditions (Scheme S1, ESI†).42 The tetrazine-aryl-boronate esters were synthesized using conditions recently reported by Mao et al. for the thiol-catalyzed formation of tetrazines from aryl nitriles.43 Hence, bromophenyltetrazines were then prepared from 3-bromobenzonitrile and 4-bromobenzonitrile respectively. Miyaura borylation of these bromide intermediates afforded the boronate esters 2a and 2b in good yields (Scheme S1, ESI†). The two boronate esters were then coupled to the two bromo-naphthalimides in all combinations using standard Suzuki cross-coupling conditions, affording the four desired naphthalimide tetrazines in moderate yields (Fig. 1B).
Photophysical properties
With the four candidates in hand, we first established that none of the unreacted tetrazine products was significantly fluorescent. While all compounds showed significantly quenched fluorescence, a weak emission band was observed around 530 nm in ethanol for all compounds (Table 1). To quantify the weak fluorescence, we attempted to measure the absolute quantum yields of the tetrazines in ethanol. All dyes, with the exception of Np3pTz, had a fluorescence quantum yield below the detection limit of the instrument. The estimated brightness for each tetrazine was less than 260 M−1 cm−1, in contrast to dyes used for molecular imaging that typically exhibit much greater brightness in the range 103–106 M−1 cm−1.1 Fluorescence emission was not observed in HEPES buffer (Table S1, ESI†), which indicates that these probes would not fluoresce in aqueous cellular media and are therefore suitable for no-wash imaging protocols. Satisfied that all of our tetrazine candidates exhibited sufficiently quenched fluorescence, particularly in aqueous media, we then sought to determine whether each naphthalimide tetrazine produced a fluorogenic response after click reaction.| λ ex (nm) | λ em (nm) | ε (M−1 cm−1) | ϕ f | B (M−1 cm−1) | |
|---|---|---|---|---|---|
| a Brightness (ε × ϕf) could not be accurately calculated. | |||||
| Np3mTz | 445 | 528 | 9500 | <0.01 | |
| Np3mPz | 449 | 539 | 8800 | 0.24 | 2100 |
| Np3pTz | 451 | 533 | 9700 | 0.027 | 260 |
| Np3pPz | 449 | 545 | 11![[thin space (1/6-em)]](https://www.rsc.org/images/entities/char_2009.gif) 000 000 |
0.25 | 2700 |
| Np6mTz | 460 | 530 | 6700 | <0.01 | |
| Np6mPz | 461 | 540 | 8900 | 0.34 | 3000 |
| Np6pTz | 463 | 533 | 11000 |
<0.01 | |
| Np6pPz | 460 | 537 | 11000 |
0.25 | 2500 |
For initial studies, the commercially available reagent (1R,8S,9s)-bicyclo[6.1.0]non-4-yn-9-ylmethanol (BCN) was used as the click partner. The relevant tetrazine was incubated with five equivalents of BCN in DMSO for 10 min (Fig. 2A). After reaction with BCN, a significant change in the color of the solution was observed for all naphthalimide tetrazines (Fig. 2B), with corresponding shifts in the absorption spectra and disappearance of shoulder absorbance bands (500–550 nm) that correspond to the n–π* transition of tetrazines (Fig. S1, ESI†). This was consistent with the formation of the naphthalimide pyridazine products, which we named NpxxPz (Scheme S2, ESI†). We verified the formation of the pyridazines using liquid-chromatography mass spectrometry (LCMS) (Fig. S2–S5, ESI†) and the masses of these products were confirmed with high resolution mass spectrometry (HRMS) (Fig. S6–S9 and Table S2, ESI†). These studies indicated that the bioorthogonal reaction had proceeded to completion. The second-order rate constants of the click reaction were determined experimentally using the fluorescence increase observed after treatment with BCN (Fig. S10, ESI†). Rate constants were in the range of 4–8 M−1 s−1 in a 1:1 acetonitrile:water mixture, which is comparable to other reported tetrazine-BCN reactions44 and sufficiently fast for live-cell labelling.4
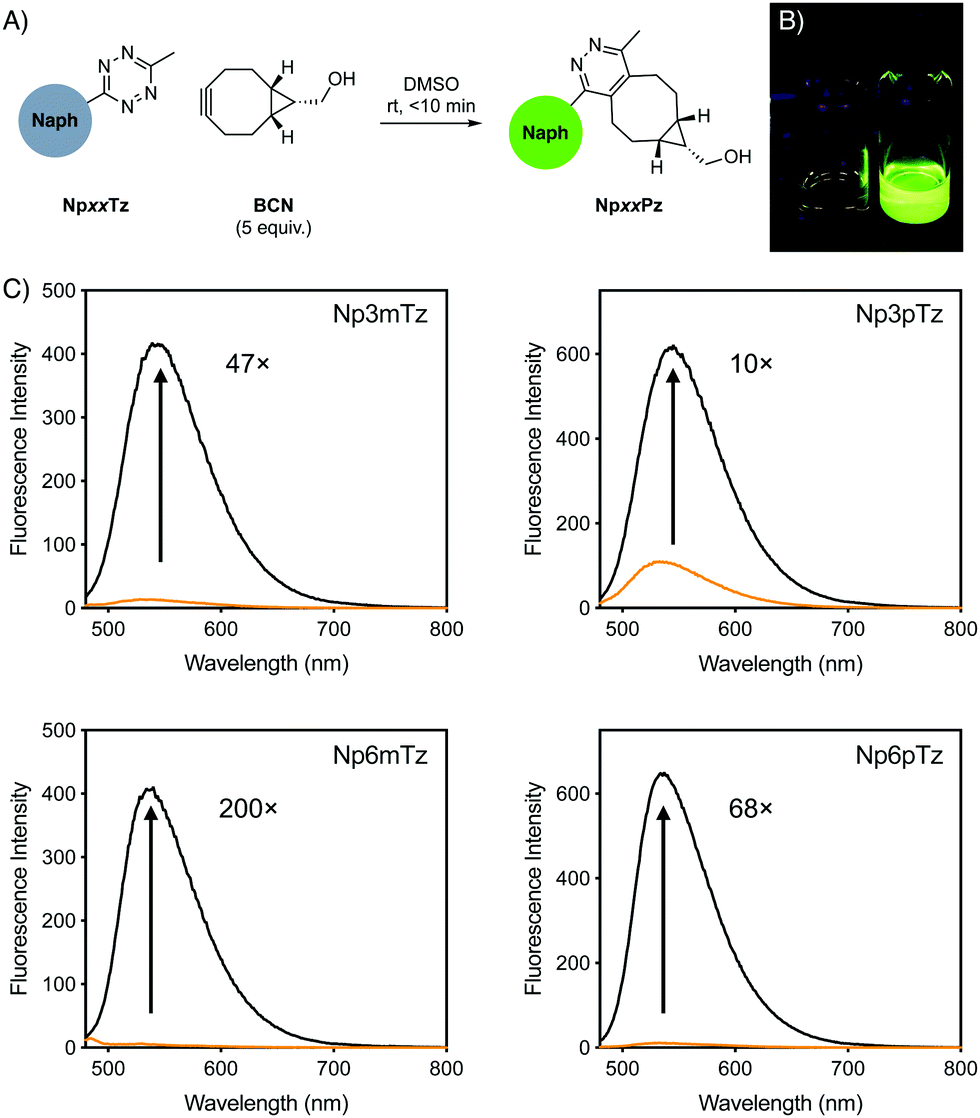 | ||
| Fig. 2 (A) Schematic of fluorogenic reaction between naphthalimide (Naph) tetrazines after reaction with BCN to form pyridazine products in situ. (B) Photograph of vials of Np6mTz (left) and Np6mPz (right) in dichloromethane, under 365 nm light. (C) Emission spectra of 5 μM solutions of naphthalimide tetrazines (orange) and the corresponding pyridazine products (black). Numbers indicate the fold turn-on as determined by integration of the spectra. | ||
We compared the emission spectra of equal concentrations of the tetrazines and corresponding pyridazine products, with strong fluorescence increases observed after the click reaction with BCN (Fig. 2C). Solutions of the pyridazine products in ethanol showed strong fluorescence, with quantum yields between 0.24 and 0.34. The 6-position derivatives exhibited slightly red-shifted excitation maxima compared to the 3-position, but with similar emission maxima (Table 1). As expected for ICT fluorophores, a strong solvatochromism was observed for all compounds, with fluorescence emission red-shifting with the polarity of the solvent (Fig. S11, ESI†). All pyridazine products exhibited a brightness greater than 103 M−1 cm−1, which is considered to be sufficiently bright for cellular imaging,1 with Np6mPz being the brightest derivative. Since the cellular environment is not homogenous in polarity, we evaluated the fold turn-on of the naphthalimide tetrazines after reaction with BCN using integrated fluorescence emission intensities in the same solvents employed for solvatochromism studies (Fig. S12, ESI†). Np6mTz exhibited a 200-fold turn-on upon reaction with BCN in ethanol and had the highest fold enhancements in all solvents. It was interesting to note that despite the significant differences between the compounds across the range of solvents, all of the compounds had a similar 70–130-fold turn-on in HEPES buffer. We ascribe this observation to the extremely low fluorescence of all the naphthalimide tetrazines in aqueous solvents, reinforcing their suitability for no-wash cellular imaging. The combined photophysical data indicated that Np6mTz is the best precursor for tetrazine-based fluorogenic probes for biological applications.
First-principle calculations
To confirm our experimental observations of the photophysical properties of the naphthalimide tetrazines, we have performed ab initio calculations relying on a mixed protocol combining time-dependent density functional theory (TD-DFT) and second-order Coupled Cluster approaches (see the ESI† for details). A comparison between the theoretical and experimental values for excitation energies reveals errors in the usual range for such a model (Fig. S13 and Table S3, ESI†).45 For all naphthalimide tetrazines, TD-DFT theory indicates that the first transition is localized on the tetrazine with a vertical transition energy of approximately 2.30 eV and a trifling oscillator strength, consistent with a dark n–π* excitation, whereas the second transition at approximately 3.01 eV corresponds to a naphthalimide-centered excitation, which is very bright (f > 0.3). As can be seen in Fig. 3 for Np3pTz, the two excitations are not overlapping at all, and the second excitation presents a strong charge transfer character, with the amino group acting as the main donor (large blue lobe in Fig. 3 center). While the S0–S1 transition induces no change in the total dipole moment, the S0–S2 excitation of Np3pTz is accompanied by an increase of the dipole by +5.36 D, consistent with the measured positive solvatochromism. When the Np3pPz structure is formed, the lowest transition disappears and the S0–S1 transition becomes equivalent to the second transition in the tetrazine derivative. Qualitatively equivalent results are obtained for the four derivatives. We have also determined the S1 and S2 minimal structures for all four naphthalimide derivatives, allowing direct calculation of the fluorescence energies. In addition, the state ordering is not affected by the geometrical relaxation (Table S4, ESI†). Therefore, the weak emission from the tetrazine derivatives is due to a residual radiative deexcitation from the S2 state, with the very strong quenching being explained by FRET from this S2 state to the lower dark S1 state. Finally, to understand why Np3pTz is significantly less quenched than Np3mTz, we have determined the excitation energy transfer (EET) coupling constant between the S1 and S2 states at the S2 minimal geometry. As EET is significantly dependent on the relative orientations of the two chromophores, we considered several conformations and averaged our results. The TD-DFT calculations found a significantly smaller coupling value in Np3pTz (1.63 meV) than in Np3mTz (2.49 meV), consistent with a stronger quenching of the emission in the latter. As the relative energies of the various states are almost unaffected by the various linkages, this effect is a result of the orientation of the two transition dipole moments of the tetrazine and naphthalimide that are significantly different in the two dyes. With this data, we rationalized key results from our photophysical experiments and were confident in the choice of Np6mTz as most suitable for further applications.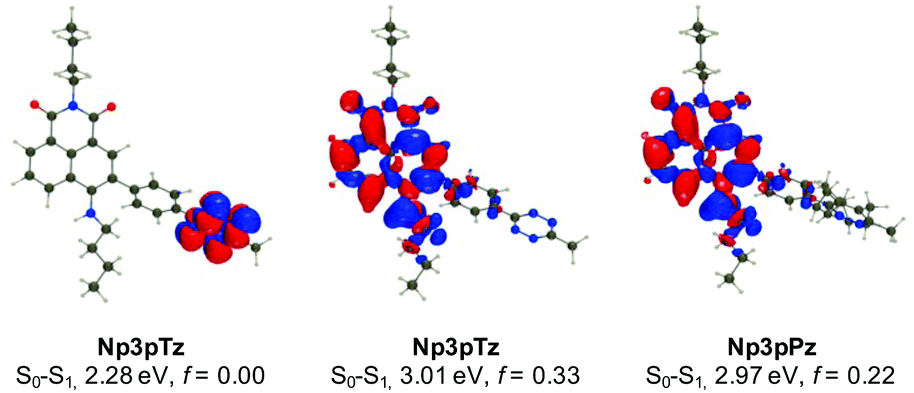 | ||
| Fig. 3 Density difference plots for selected excited states of Np3pTz and Np3pPz. The blue and red regions represent regions of increase and decrease of electron density upon photon absorption, respectively. Text indicates the computed transition energies and oscillator strengths (f). | ||
Investigating the fluorogenic reaction in cells
We next sought to confirm that the fluorogenic reaction between the naphthalimide tetrazines and BCN could be observed in living cells. Before carrying out imaging studies, A549 cells were exposed to high concentrations of the tetrazines (25 μM), BCN (250 μM) or a combination of the two for 3 h to determine whether these compounds were cytotoxic. Pleasingly, we observed no significant changes in cell viability during this time (Fig. S14, ESI†). The intracellular fluorescence of cells treated with Np3mTz as a model tetrazine for 20 min or 90 min, with and without washing, was similar for all conditions, confirming that the dyes could be used for no-wash labelling and imaging (Fig. S15, ESI†). We then compared the fluorescence of cells treated with the tetrazines and the pyridazine products. Cells treated with the tetrazines (1 μM, 20 min) exhibited minimal fluorescence compared to cells treated with the corresponding pyridazines (Fig. S16, ESI†). Importantly, the pyridazines gave measurable signals at low concentrations (1 μM) and low laser powers (<1.0%). The only tetrazine that gave any observable fluorescence in cells was Np3pTz, consistent with its higher quantum yield.We then confirmed that the reaction partners underwent the fluorogenic click reaction inside live cells. Strong fluorescence was observed in cells that were first treated with a naphthalimide tetrazine (1 μM, 30 min), followed by BCN (50 μM, 1 h) (Fig. 4), confirming that the bioorthogonal reaction occurs within cells and that the fluorescent product is sufficiently bright for confocal microscopy. We next evaluated how fast this reaction could occur within cells, and based on our photophysical data, chose Np6mTz as the candidate for testing. Cells were first incubated with Np6mTz, washed, and then incubated with imaging media or BCN-doped imaging media and imaged every 2 min for 30 min (Fig. S17, ESI†). Bright fluorescence was observed within 20 min, indicating that the BCN partner rapidly enters the cell and reacts with the tetrazine.
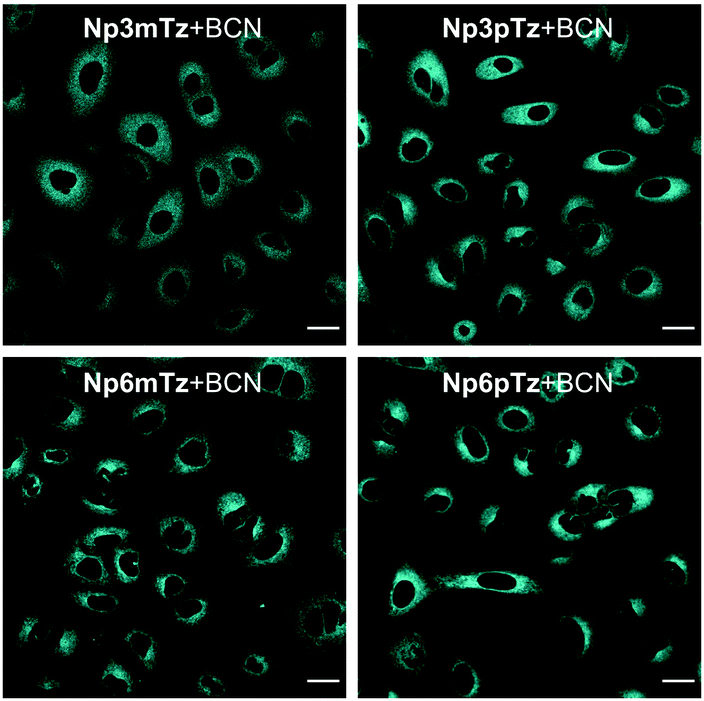 | ||
| Fig. 4 Representative images of A549 cells stained with Np3mTz, Np3pTz, Np6mTz or Np6pTz (1 μM, 30 min) followed by incubation with BCN (50 μM, 1 h). λex = 488 nm, λem = 510–610 nm. Scale bars represent 20 μm. | ||
Targeted naphthalimide tetrazines
Having optimized the general scaffold for fluorogenic imaging, we then sought to utilize the synthetic versatility of the system for targeting the tetrazines to cellular organelles. We envisaged that targeting the naphthalimide tetrazines to the lysosomes and mitochondria with appropriate targeting groups would produce fluorescent responses that could be correlated with established cellular trackers. We chose a morpholine targeting group for the lysosomes, which accumulates based on the protonation of the tertiary amine inside the acidic environment of the lysosomes; and a triphenylphosphonium group for targeting the mitochondria, which bears a positive charge that accumulates due to the negative membrane potential of the mitochondria.Both targeted variants were synthesized from 3-bromo-5-nitro-1,8-naphthalic anhydride; the intermediate previously used for synthesis of 1b, the precursor of Np6mTz. The lysosome-targeted naphthalimide, LysoNpTz, was synthesized over three steps in 46% overall yield (Scheme S3, ESI†). The mitochondria-targeted variant, MitoNpTz, was synthesized in five steps in 11% overall yield, with the additional steps permitting the introduction of the charged targeting group in the final step (Scheme S4, ESI†). Both of these naphthalimide tetrazines were reacted with BCN in situ as before, generating the pyridazine products LysoNpPz and MitoNpPz (Fig. 5A) whose identities were confirmed by LRMS (Fig. S18, ESI†). LysoNpPz (λem = 532 nm, ε = 12000 M−1 cm−1, ϕf = 0.30 in EtOH) and MitoNpPz (λem = 543 nm, ε = 4900 M−1 cm−1, ϕf = 0.27 in EtOH) had similar absorbance and fluorescence profiles to the 6-position naphthalimide pyridazines (Fig. S19–S21, ESI†). Furthermore, high doses of LysoNpTz and MitoNpTz were non-toxic to A549 cells (Fig. S22, ESI†). The probes also showed a fluorogenic response in cells within 30 min upon co-treatment with BCN (50 μM) (Fig. S23, ESI†).
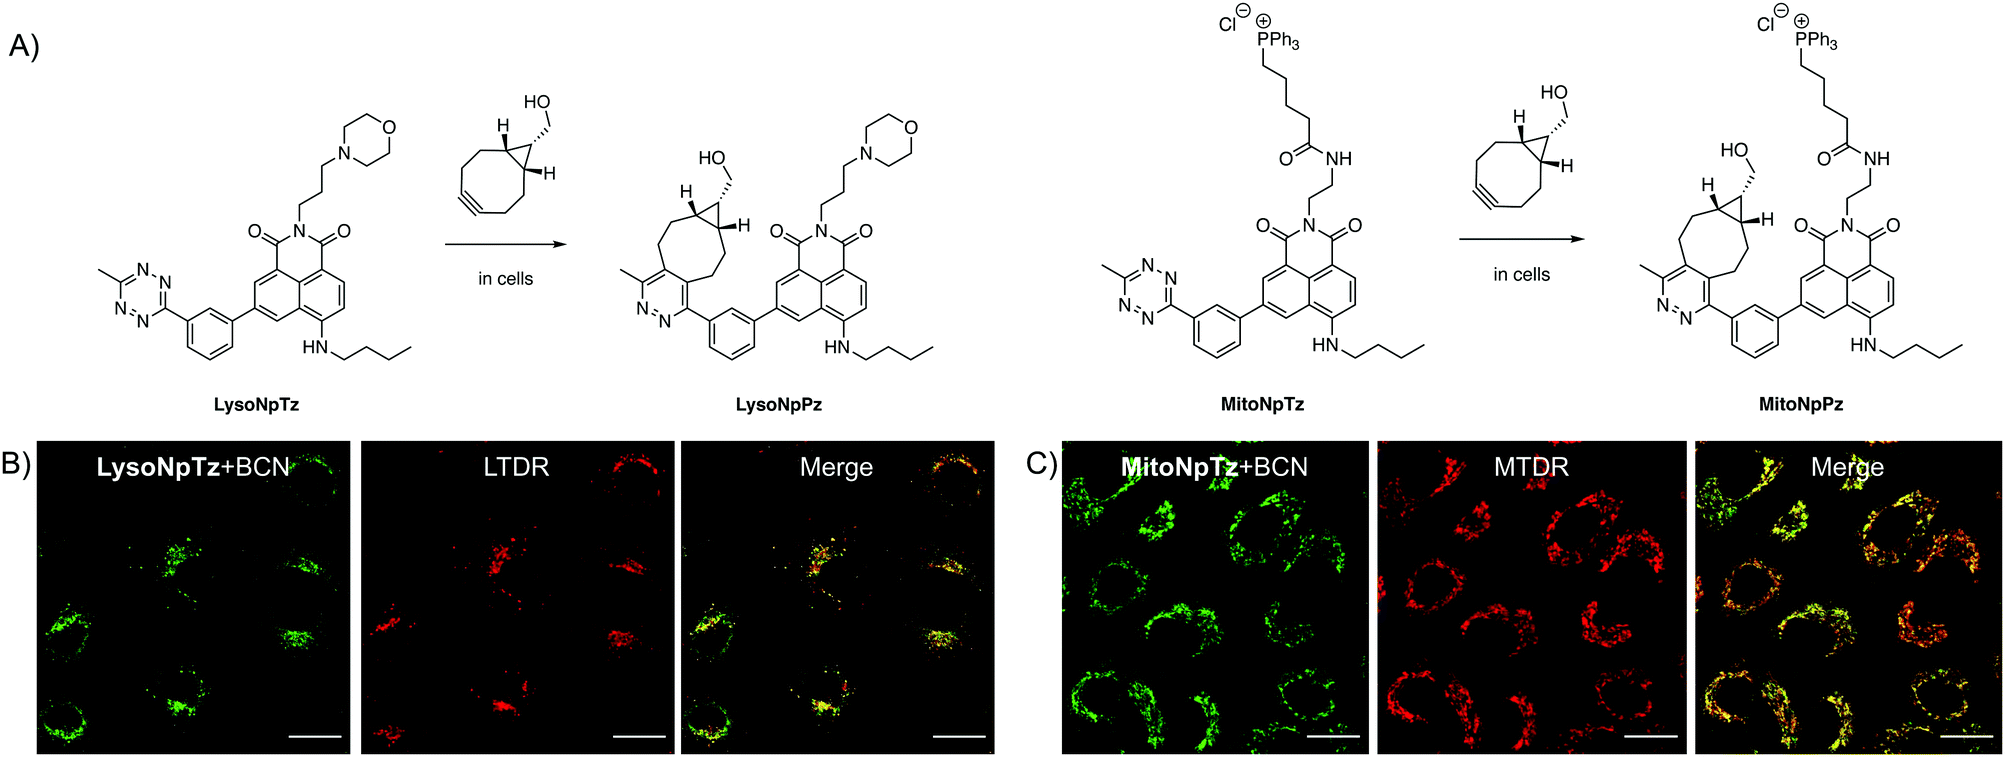 | ||
| Fig. 5 Targeted naphthalimide tetrazines. (A) Reaction of LysoNpTz with BCN to form LysoNpPz and reaction of MitoNpTz with BCN to form MitoNpPz. Representative images of A549 cells dosed with (B) LysoNpTz (2.5 μM) and BCN (2.5 μM) and LysoTracker Deep Red (LTDR) (50 nM) or (C) MitoNpTz (10 μM) and BCN (10 μM) and MitoTracker Deep Red (MTDR) (100 nM). Green channel (naphthalimides): λex = 488 nm, λem = 510–610 nm. Red channel (trackers): λex = 640 nm, λem = 650–750 nm. Scale bars represent 20 μm. | ||
With confidence that the targeted naphthalimide click reactions had similar photophysical and biological properties to the parent compounds, we next evaluated the ability of the probes to label their respective organelles. To verify their differences in localization, both naphthalimide tetrazines were incubated with BCN and LysoTracker Deep Red (LTDR) or MitoTracker Deep Red (MTDR). Fluorescence was observed in punctate regions around the nucleus in cells treated with LysoNpTz and BCN, which corresponded to the lysosomes (Fig. 5B) and did not significantly colocalize with the mitochondria (Fig. S24, ESI†). In contrast, cells treated with MitoNpTz and BCN exhibited web-like fluorescent structures that correlated to the mitochondria (Fig. 5C) and did not exhibit fluorescence in the lysosomes (Fig. S24, ESI†). Taken together, it is clear that incorporating these targeting groups increases the selectivity of the probes for the organelles of live cells, without the need for genetic modification of a specific protein.
Monitoring insulin fibrillation with fluorogenic naphthalimides
Having demonstrated that we can readily modify the naphthalimide tetrazines for organelle labelling, we sought to use the system as a means to investigate other biological structures of interest. Amyloid fibrils are implicated in a range of neurodegenerative disorders, and it is therefore essential to be able to image their formation and localization.46 The visualization of these structures is challenging due to the limitations in specificity and labelling efficiency of dyes like thioflavin T (ThT),47 and as such, genetically-modified amyloid-forming proteins tagged with fluorescent proteins are often used in experiments. However, the genetic modification of amyloid-forming proteins presents multiple challenges associated with cloning and altered physiological and aggregation profile of the amyloid-forming proteins.48,49 An alternative approach involving labeling with small-molecule fluorophores in vitro may disturb fibril growth, leading to models that do not accurately reflect their physiology.50 We therefore investigated whether the BCN-tetrazine labelling reaction could overcome these challenges as the BCN modification is smaller than most fluorophores used for imaging.Insulin was chosen for these studies as it is widely used as a model to probe the mechanisms of amyloid fibril formation, as insulin amyloids exhibit the characteristic cross-β structure found in the fibrils of disease-relevant amyloids.51 Monomeric insulin was treated with excess BCN 4-nitrophenyl ester (Scheme S5, ESI†) that was expected to react with one, two or three of the primary amine sites on the insulin monomer (two N-termini and a lysine residue). The tagged insulin-BCN was isolated using size exclusion column purification with 20 mM glycine HCl (pH 2.0). MALDI-TOF-MS analysis was used to confirm that the mixture contained insulin tagged with one, two or three BCN molecules (Fig. S25, ESI†). The number of BCN molecules per insulin monomer does not affect the imaging of insulin fibrils, so the monomers were used as a mixture in all subsequent experiments.
Amyloid fibrils were prepared from insulin and insulin-BCN using established procedures and imaged using total internal reflection microscopy (TIRF). The untreated insulin-BCN fibrils were non-fluorescent, while unlabeled insulin fibrils incubated with Np6mTz showed very weak fluorescence (Fig. 6A and B), potentially due to accumulation of Np6mTz in the hydrophobic environment of the fibrils. The low fluorescence confirms that Np6mTz does not undergo a click reaction with untagged insulin. In contrast, the insulin-tagged BCN fibrils after incubation with Np6mTz resulted in a strong fluorescence signal consistent with formation of the fluorescent pyridazine. The images show a web-like network morphology, as expected for insulin fibrils (Fig. 6C). This demonstrates that the naphthalimide tetrazine click reaction occurs in vitro and can be applied for imaging amyloid protein assemblies. Importantly, the use of the non-fluorescent Np6mTz enabled no-wash imaging experiments. Colocalization experiments with AmyTracker 680, a commercial amyloid marker, provided further confirmation that the tetrazine click reaction is labeling the amyloid fibrils (Fig. 6D–F).
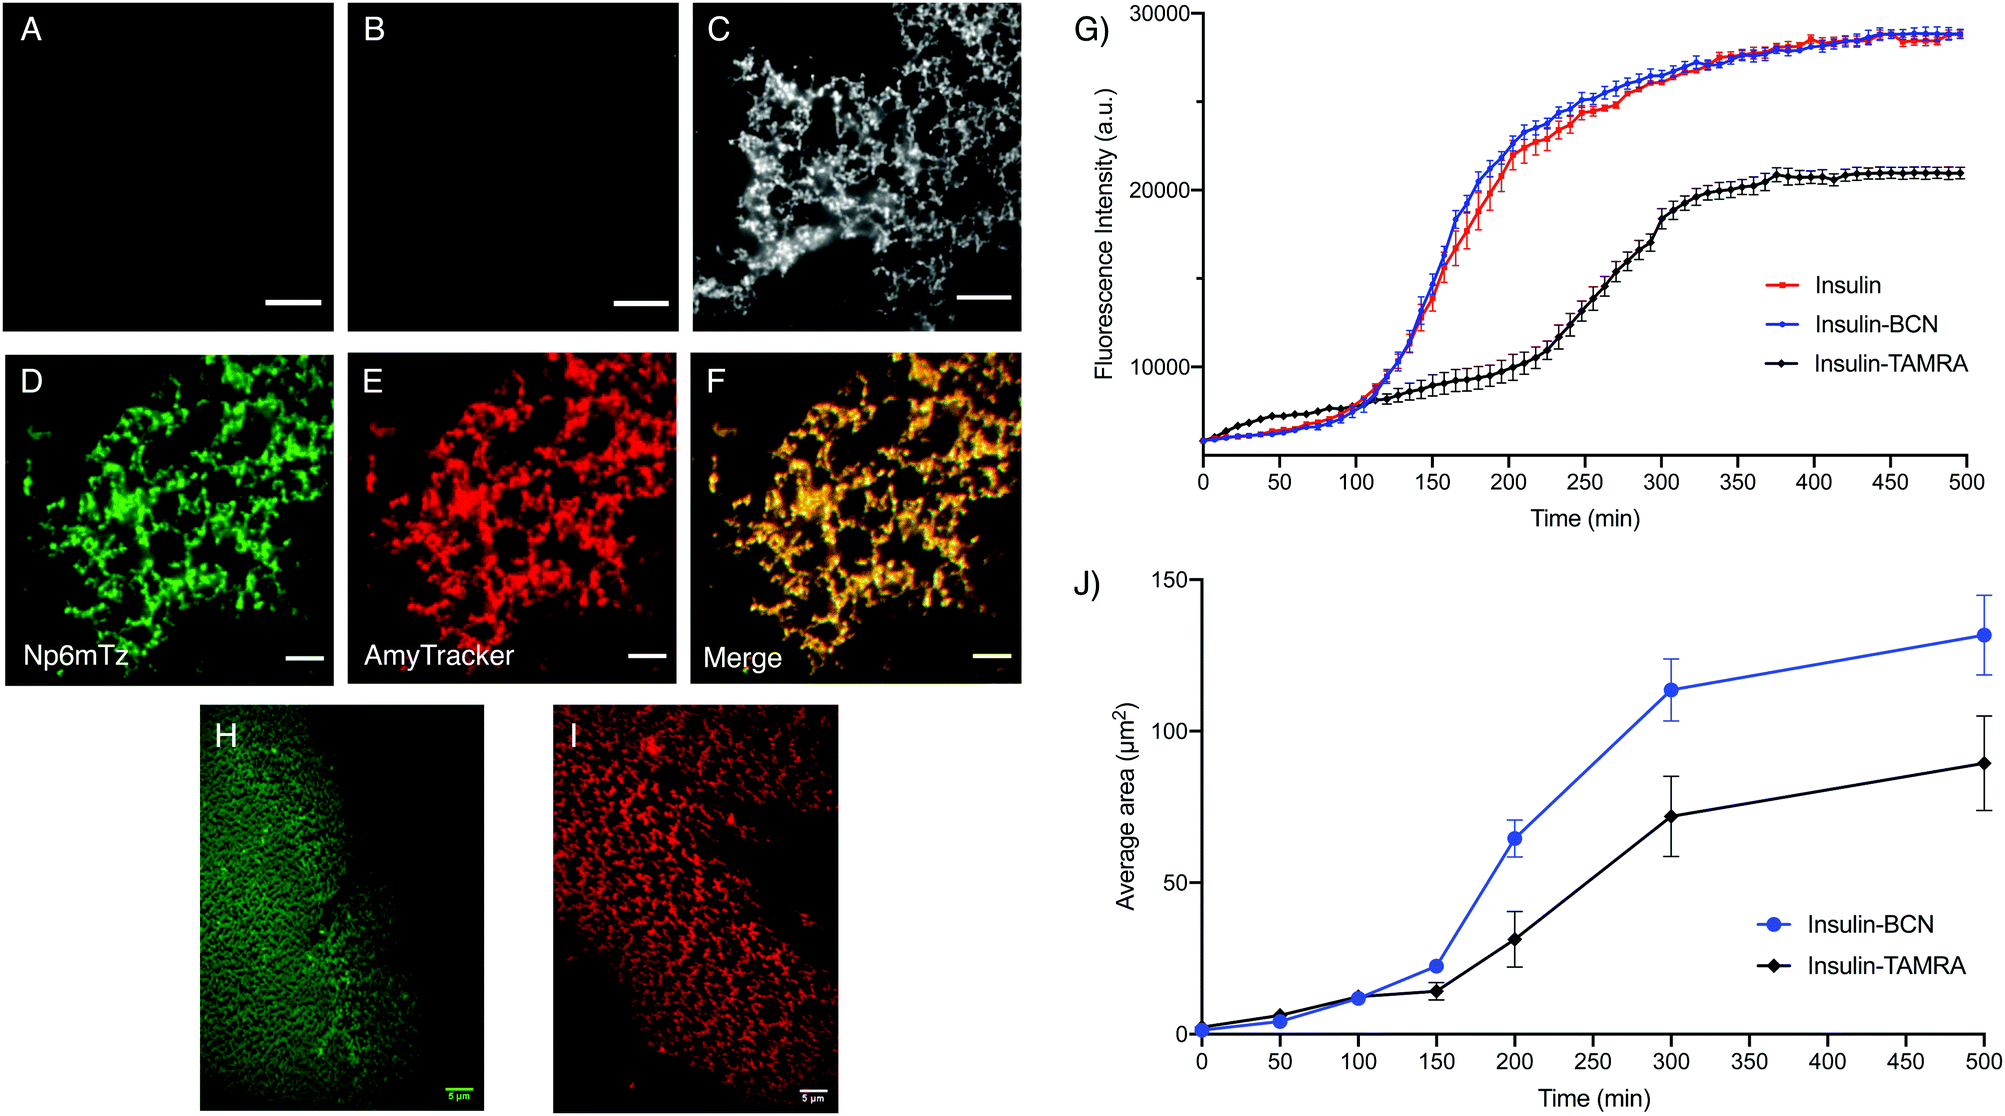 | ||
| Fig. 6 Investigating BCN-labelled insulin. Representative TIRF images of (A) insulin-BCN fibrils (0.5 mg mL−1) with no dye, (B) native insulin fibrils (2 mg mL−1) incubated with Np6mTz (2 μM) and (C) insulin-BCN fibrils (0.5 mg mL−1) incubated with Np6mTz (2 μM), with λex = 473 nm. Representative TIRF images of the (D) green channel (λex = 473 nm), (E) red channel (λex = 561 nm) and (F) merge of green and red channels of insulin-BCN fibrils treated with Np6mTz (2 μM) and AmyTracker 680 (1 μM). (G) Thioflavin T fibril assembly kinetics assay. Insulin, insulin-BCN and insulin-TAMRA were incubated in glycine buffer (20 mM, pH 2) with thioflavin T, and fluorescence intensity monitored every 7.5 min over 500 min. Data presented as mean ± SD of triplicate values from one experiment. (H) Representative TIRF image of insulin-BCN fibrils treated with Np6mTz (2 μM) after 500 min. (I) Representative TIRF image of insulin-TAMRA fibrils after 500 min. (J) Mean fibril area from TIRF images at the times indicated. Data presented as mean ± SD for 25 areas of interest from one experiment. All scale bars represent 5 μm. | ||
To investigate whether BCN-labelling of insulin results in altered amyloid assembly or properties, we measured the assembly kinetics of monomeric insulin and insulin-BCN using a conventional ThT-based assay in which formation of amyloid fibrils is signaled by increased ThT fluorescence at 485 nm. Insulin labelled with the rhodamine derivative TAMRA (insulin-TAMRA) was also synthesized and tested to compare the effect of labelling insulin with a larger fluorophore (Fig. S26, ESI†). We observed no significant differences between the ThT assembly profiles of insulin and insulin-BCN as they formed fibrils (Fig. 6G), while insulin-TAMRA showed a delayed and attenuated oligomerization. This demonstrated that labelling insulin monomers with BCN does not perturb their amyloid assembly or subsequent ThT binding, unlike insulin-TAMRA. To further probe the differential fibril assembly profiles, we imaged the growth of insulin-BCN and insulin-TAMRA fibrils and measured the area covered by the fibrils from these images. Samples of insulin-BCN fibrils (treated with Np6mTz) or insulin-TAMRA fibrils were extracted at different intervals (50–500 min) and imaged. TIRF imaging of the fibrils demonstrated a significant increase in the extent of the fibrillar network over time (Fig. S27 and S28, ESI†). The images clearly demonstrate formation of a less dense fibrillar network in the case of insulin-TAMRA (Fig. 6I) compared to insulin-BCN (Fig. 6H), particularly noticeable in images collected after 150 min. The lower density of insulin-TAMRA fibrils compared to insulin and insulin-BCN fibrils was also confirmed with TEM imaging (Fig. S29, ESI†) and by analysis of the area covered by insulin-BCN and insulin-TAMRA fibrils (Fig. 6J). We have therefore been able to demonstrate that the tetrazine-BCN reaction is a valuable strategy for monitoring the progression of amyloid fibril formation. The fact that the BCN label does not perturb fibril formation, while the TAMRA label does, suggests that post-aggregation functionalization with the fluorophore is a preferable strategy for fluorescent imaging of amyloid aggregation, and further highlights the value of the naphthalimide tetrazines that we have developed here.
Conclusions
Here we have presented the first naphthalimide tetrazines designed to undergo rapid click chemistry for biological labeling. The suitability of naphthalimides for biological labelling events was assessed through the photophysical characterization of a series of these compounds, which found that Np6mTz had the best fluorogenic response in cuvette studies, and underwent a fluorogenic reaction in cells with BCN within 20 min. The use of the naphthalimide scaffold permits the synthetic variation of groups at the imide and naphthalene positions, which led to the development of targeted naphthalimide tetrazines that fluorogenically labelled the lysosomes and mitochondria without genetic modification. The system was also used for no-wash imaging of insulin amyloid fibrils, which are an established model for understanding the progression of amyloidogenesis in amyloid-associated diseases. These applications demonstrate the versatility of the naphthalimide scaffold and should pave the way for the design of new, functionalizable fluorescent sensors that can report on biological changes at the sites of interest.Author contributions
The manuscript was written through contributions of all authors. All authors have given approval to the final version of the manuscript.Conflicts of interest
There are no conflicts to declare.Acknowledgements
The authors would like to acknowledge the Australian Research Council (DP180101353, DP180101897 and DP200102463) for funding, the Westpac Scholars Trust for a Research Fellowship (EJN), the University of Sydney for a SOAR Fellowship (EJN) a USyd Fellowship (AK), and the John A Lamberton Scholarship (MEG), and the Australian Government for Research Training Program Scholarships (MEG, SRB). We acknowledge the scientific and technical assistance of Sydney Analytical, the Mass Spectrometry Facility at the School of Chemistry and the Australian Microscopy and Microanalysis Research Facility at the Australian Centre for Microscopy and Microanalysis (ACMM). PMV and DJ thank the ANR for support in the framework of the GeDeMi grant. This research used the computational resources of CCIPL (Centre de Calcul Intensif des Pays de la Loire).References
- L. D. Lavis and R. T. Raines, ACS Chem. Biol., 2007, 3, 142–155 CrossRef.
- E. J. New, ACS Sens., 2016, 1, 328–333 CrossRef CAS.
- J. L. Kolanowski, F. Liu and E. J. New, Chem. Soc. Rev., 2017, 47, 195–208 RSC.
- B. L. Oliveira, Z. Guo and G. J. L. Bernardes, Chem. Soc. Rev., 2017, 46, 4895–4950 RSC.
- P. Shieh and C. R. Bertozzi, Org. Biomol. Chem., 2014, 12, 9307–9320 RSC.
- C. S. McKay and M. G. Finn, Chem. Biol., 2014, 21, 1075–1101 CrossRef CAS PubMed.
- D. M. Patterson, L. A. Nazarova and J. A. Prescher, ACS Chem. Biol., 2014, 9, 592–605 CrossRef CAS.
- M. L. Blackman, M. Royzen and J. M. Fox, J. Am. Chem. Soc., 2008, 130, 13518–13519 CrossRef CAS.
- N. K. Devaraj, S. Hilderbrand, R. Upadhyay, R. Mazitschek and R. Weissleder, Angew. Chem., Int. Ed., 2010, 49, 2869–2872 CrossRef CAS PubMed.
- G. S. Jiao, L. H. Thoresen and K. Burgess, J. Am. Chem. Soc., 2003, 125, 14668–14669 CrossRef CAS.
- G. S. Jiao, L. H. Thoresen, T. G. Kim, W. C. Haaland, F. Gao, M. R. Topp, R. M. Hochstrasser, M. L. Metzker and K. Burgess, Chem. – Eur. J., 2006, 12, 7816–7826 CrossRef CAS.
- J. C. T. Carlson, L. G. Meimetis, S. A. Hilderbrand and R. Weissleder, Angew. Chem., Int. Ed., 2013, 52, 6917–6920 CrossRef CAS.
- K. Lang, L. Davis, S. Wallace, M. Mahesh, D. J. Cox, M. L. Blackman, J. M. Fox and J. W. Chin, J. Am. Chem. Soc., 2012, 134, 9–12 Search PubMed.
- B. Pinto-Pacheco, W. P. Carbery, S. Khan, D. B. Turner and D. Buccella, Angew. Chem., Int. Ed., 2020, 59, 2–12 CrossRef PubMed.
- L. G. Meimetis, J. C. T. Carlson, R. J. Giedt, R. H. Kohler and R. Weissleder, Angew. Chem., Int. Ed., 2014, 53, 7531–7534 CrossRef CAS.
- A. Wieczorek, P. Werther, J. Euchner and R. Wombacher, Chem. Sci., 2017, 8, 1506–1510 RSC.
- E. Kozma, G. E. Girona, G. Paci, E. A. Lemke and P. Kele, Chem. Commun., 2017, 53, 6696–6699 RSC.
- G. Knorr, E. Kozma, J. M. Schaart, K. Németh, G. Török and P. Kele, Bioconjugate Chem., 2018, 29, 1312–1318 CrossRef CAS PubMed.
- G. Knorr, E. Kozma, A. Herner, E. A. Lemke and P. Kele, Chem. – Eur. J., 2016, 22, 8972–8979 CrossRef CAS.
- G. Beliu, A. J. Kurz, A. C. Kuhlemann, L. Behringer-Pliess, M. Meub, N. Wolf, J. Seibel, Z. D. Shi, M. Schnermann, J. B. Grimm, L. D. Lavis, S. Doose and M. Sauer, Commun. Biol., 2019, 2, 261 CrossRef PubMed.
- J. Tu, D. Svatunek, S. Parvez, A. C. Liu, B. J. Levandowski, H. J. Eckvahl, R. T. Peterson, K. N. Houk and R. M. Franzini, Angew. Chem., Int. Ed., 2019, 58, 9043–9048 CrossRef CAS PubMed.
- A. Vázquez, R. Dzijak, M. Dračínský, R. Rampmaier, S. J. Siegl and M. Vrabel, Angew. Chem., Int. Ed., 2017, 56, 1334–1337 CrossRef PubMed.
- S. J. Siegl, J. Galeta, R. Dzijak, M. Dračínský and M. Vrabel, ChemPlusChem, 2019, 84, 493–497 CrossRef CAS PubMed.
- S. J. Siegl, A. Vázquez, R. Dzijak, M. Dračínský, J. Galeta, R. Rampmaier, B. Klepetářová and M. Vrabel, Chem. – Eur. J., 2018, 24, 2426–2432 CrossRef CAS PubMed.
- S. J. Siegl, J. Galeta, R. Dzijak, A. Vázquez, M. Del Río-Villanueva, M. Dračínský and M. Vrabel, ChemBioChem, 2019, 20, 886–890 CrossRef CAS PubMed.
- A. Egyed, A. Kormos, B. Söveges, K. Németh and P. Kele, Bioorg. Med. Chem., 2020, 28, 115218 CrossRef CAS PubMed.
- P. Werther, K. Yserentant, F. Braun, N. Kaltwasser, C. Popp, M. Baalmann, D. P. Herten and R. Wombacher, Angew. Chem., Int. Ed., 2020, 59, 804–810 CrossRef CAS.
- F. Neubert, G. Beliu, U. Terpitz, C. Werner, C. Geis, M. Sauer and S. Doose, Angew. Chem., Int. Ed., 2018, 57, 16364–16369 CrossRef CAS.
- J. J. Gruskos, G. Zhang and D. Buccella, J. Am. Chem. Soc., 2016, 138, 14639–14649 CrossRef CAS PubMed.
- L. I. Selby, L. Aurelio, D. Yuen, B. Graham and A. P. R. Johnston, ACS Sens., 2018, 3, 1182–1189 CrossRef CAS PubMed.
- A. Loredo, J. Tang, L. Wang, K. L. Wu, Z. Peng and H. Xiao, Chem. Sci., 2020, 11, 4410–4415 RSC.
- K. G. Leslie, D. Jacquemin, E. J. New and K. A. Jolliffe, Chem. – Eur. J., 2018, 24, 5569–5573 CrossRef CAS PubMed.
- N. Trinh, K. A. Jolliffe and E. J. New, Angew. Chem., Int. Ed., 2020, 59, 20290–20301 CrossRef CAS PubMed.
- C. Le Droumaguet, C. Wang and Q. Wang, Chem. Soc. Rev., 2010, 39, 1233–1239 RSC.
- Q. Qiao, W. Liu, J. Chen, W. Zhou, W. Yin, L. Miao, J. Cui and Z. Xu, Dyes Pigm., 2017, 147, 327–333 CrossRef CAS.
- Z. Shao, C. Zhang, X. Zhu, Y. Wang, W. Xu, Y. Chen, X. Wang, H. Zhu and Y. Liang, Chin. Chem. Lett., 2019, 30, 2169–2172 CrossRef CAS.
- Y. Tian, X. Li and D. Yin, Chem. Commun., 2019, 55, 12865–12868 RSC.
- L. Fritea, K. Gorgy, A. Le Goff, P. Audebert, L. Galmiche, R. Săndulescu and S. Cosnier, J. Electroanal. Chem., 2016, 781, 36–40 CrossRef CAS.
- A. J. Gross, R. Haddad, C. Travelet, E. Reynaud, P. Audebert, R. Borsali and S. Cosnier, Langmuir, 2016, 32, 11939–11945 CrossRef CAS PubMed.
- O. Ourahmoun, T. Trigaud, B. Ratier, M. S. Belkaid, L. Galmiche and P. Audebert, Synth. Met., 2017, 234, 106–110 CrossRef CAS.
- Q. Zhou, P. Audebert, G. Clavier, R. Méallet-Renault, F. Miomandre, Z. Shaukat, T. T. Vu and J. Tang, J. Phys. Chem. C, 2011, 115, 21899–21906 CrossRef CAS.
- L. D. Adair, N. Trinh, P. M. Vérité, D. Jacquemin, K. A. Jolliffe and E. J. New, Chem. – Eur. J., 2020, 26, 10064–10071 CrossRef CAS PubMed.
- W. Mao, W. Shi, J. Li, D. Su, X. Wang, L. Zhang, L. Pan, X. Wu and H. Wu, Angew. Chem., Int. Ed., 2018, 58, 1106–1109 CrossRef PubMed.
- W. Chen, D. Wang, C. Dai, D. Hamelberg and B. Wang, Chem. Commun., 2012, 48, 1736–1738 RSC.
- D. Jacquemin, I. Duchemin and X. Blase, J. Chem. Theory Comput., 2015, 11, 5340–5359 CrossRef CAS PubMed.
- A. Kaur, E. J. New and M. Sunde, ACS Sens., 2020, 5, 2268–2282 CrossRef CAS PubMed.
- E. Coelho-Cerqueira, A. S. Pinheiro and C. Follmer, Bioorg. Med. Chem. Lett., 2014, 24, 3194–3198 CrossRef CAS PubMed.
- G. S. Waldo, B. M. Standish, J. Berendzen and T. C. Terwilliger, Nat. Biotechnol., 1999, 17, 691–695 CrossRef CAS PubMed.
- C. Wurth, N. K. Guimard and M. H. Hecht, J. Mol. Biol., 2002, 319, 1279–1290 CrossRef CAS.
- H. A. Shaban, C. A. Valades-Cruz, J. Savatier and S. Brasselet, Sci. Rep., 2017, 7, 1–10 CrossRef CAS PubMed.
- L. Nielsen, S. Frokjaer, J. Brange, V. N. Uversky and A. L. Fink, Biochemistry, 2001, 40, 8397–8409 CrossRef CAS PubMed.
Footnote |
| † Electronic supplementary information (ESI) available. See DOI: 10.1039/d1cb00128k |
| This journal is © The Royal Society of Chemistry 2021 |