
Photoelectrochemical analysis of the alkaline phosphatase activity in single living cells†
Nina
Wang
a,
Rongrong
Pan
a,
Lina
Ji
*b,
Dechen
Jiang
 *a and
Hong-Yuan
Chen
a
*a and
Hong-Yuan
Chen
a
aState Key Laboratory of Analytical Chemistry for Life Science, School of Chemistry and Chemical Engineering, Nanjing University, Nanjing, 210092, China. E-mail: dechenjiang@nju.edu.cn
bState Key Laboratory of Pharmaceutical Biotechnology, School of Life Sciences, Nanjing University, Nanjing, 210092, China. E-mail: jilina@nju.edu.cn
First published on 10th August 2021
Abstract
Conventional photoelectrochemical (PEC) analysis mostly utilizes photoactive material modified planar indium tin oxides (ITOs) to obtain photocurrent responses for the measurement of analytes in solution. In this work, a CdS quantum dot (QD) modified nanopipette was prepared for the PEC analysis of the alkaline phosphatase (ALP) activity in single MCF-7 cells. The nanopipette was filled with ascorbic acid 2-phosphate (AAP) that was egressed outside the nanopipette by electrochemical pumping. Next, AAP was catalyzed by ALP to generate ascorbic acid (AA), which is an efficient electron donor for CdS QDs under illumination. Based on the result that the nanopipette showed a linear photocurrent response to AA, a nearly linear correlation between the photocurrent and the activity of ALP was established. Accordingly, using these CdS QD modified nanopipettes, the ALP activity in single MCF-7 cells was determined to be 0.12 U mL−1 by PEC analysis. This work does not expand the application of PEC bioanalysis, but offers a new strategy for single cell analysis.
Introduction
Photoelectrochemical (PEC) analysis is a rapidly developing method in analytical chemistry.1–4 To quantitatively determine target molecules, some specific recognition processes are adopted that can induce changes in electric signals from photoelectric active materials under illumination.5,6 Because the excitation signal and detection signal exist in different energy forms, this method has the advantages of high sensitivity, good selectivity and fast response.7–10 Accordingly, PEC analysis is widely applied in the detection of small molecules, such as glucose,11,12 glutathione13 and cysteine.14 Integrated with the specificity of enzymes, PEC enzymatic biosensors have been commonly used to detect the enzyme activity.15,16 Furthermore, the emergence of near infrared-emitting photoelectric active materials (e.g. QDs), which can be effectively excited by long wavelength light, makes PEC analysis suitable for analyzing living cells.17 Despite the tremendous development in PEC analysis, its application in single cell analysis has been seldom reported.Nanopipette based electrochemistry has been developed in recent years for single cell analysis. To construct a nanoelectrode, a pre-pulled nanopipette is filled with electroactive materials, such as carbon,18 Pt,19 Au,20 carbon fibers,21,22etc. Then, the prepared nanoelectrode is first placed near the targeted cell and then inserted into the cell by penetrating the membrane under the control of a 3D manipulator. The nanoelectrode can easily detect a majority of electroactive analytes inside the cell as well as non-electroactive species, such as glucose,23,24 enzymes25 and cholesterol.26 The nanoelectrochemistry approach permits highly spatial measurement in single cells, and even in single cellular compartments inside the cells.27,28 Recently, an intricate tool called a “nanokit” was developed to analyze small molecules and the activities of enzymes inside single cells.29 A nanopipette with an O-ring detector at the tip is filled with several components of a reaction kit. After the nanopipette is inserted into a living cell, the kit components are pushed into the cell using an electrochemical pump and they react with the analytes to generate H2O2. The electrochemically active H2O2 can be measured by the nanoring electrode at the tip of the nanopipette immediately. Since photoactive materials could be modified at the Pt layer of the nanoring electrode, it is feasible to develop nanopipette based PEC analysis for single cell measurement.
In this work, a CdS quantum dot (QD) modified nanopipette was fabricated to probe the activity of alkaline phosphatase (ALP) in single living cells. ALP is a sub-family of phosphatases that is of great importance in the de-phosphorylation process of small molecules, proteins, and DNAs. The dysregulated expression of ALP can lead to a variety of serious diseases, such as hepatitis and breast and prostate cancers.30 Therefore, accurate measurement of the ALP activity in single cells should benefit the understanding of the role of ALP in these diseases. Since the prepared CdS QDs are negatively charged and PDDA is positively charged, CdS QDs assembled on the indium tin oxide (ITO) layer at the tip of a nanopipette through electrostatic adsorption as illustrated in Fig. 1. The nanopipette is filled with ascorbic acid 2-phosphate (AAP), which could be egressed from the nanopipette to a single cell. Then, the intracellular ALP catalyzes the hydrolysis of AAP to generate ascorbic acid (AA), which is an efficient electron donor for CdS QDs under illumination. After losing two electrons, AA is oxidized into dehydroascorbic acid. When excited with blue light with a wavelength of 425 nm, CdS QDs will produce electron–hole pairs immediately. The electrons from AA will transfer to the valence band (VB) of CdS QDs, while the extra electrons on the conduction band (CB) will be quickly collected as the anodic photocurrent by a nanoelectrode modified with ITO. The photocurrent is correlated with the amount of AA generated in a certain time. Consequently, the activity of ALP in single cells could be measured by nanopipette based PEC analysis.
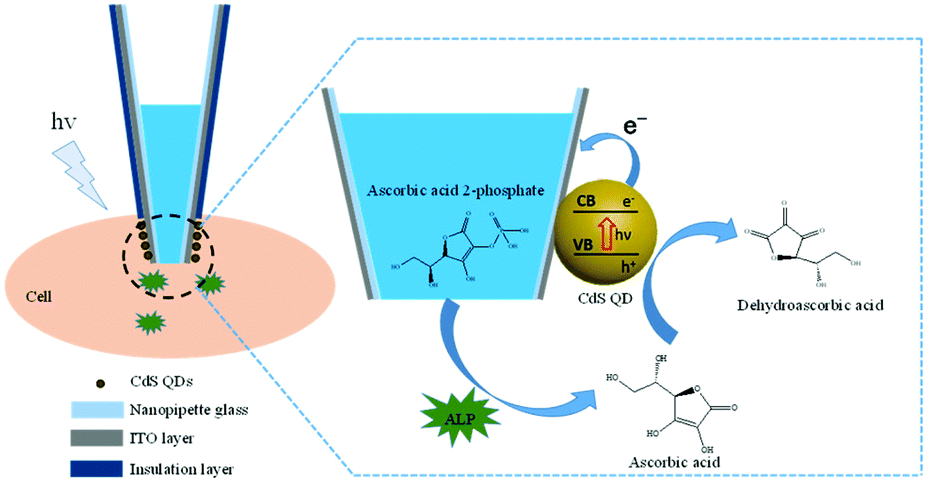 | ||
| Fig. 1 The schematic illustration of the CdS QD modified nanopipette for the analysis of the ALP activity in single living cells. | ||
Experimental section
Materials and cell culture
Cadmium chloride hemi (pentahydrate) (CdCl2·2.5H2O), sodium sulfide nonahydrate (Na2S·9H2O), sodium chloride (NaCl), sodium hydroxide (NaOH), thioglycolic acid (TGA) and ascorbic acid were purchased from Sinopharm Chemical Reagent Co., Ltd (Shanghai, China). Poly(diallyldimethylammonium chloride) (PDDA, 20%, w/w in water, M.W. 200–350 kDa), ascorbic acid 2-phosphate, alkaline phosphatase and 10 mM physiological phosphate buffered saline (PBS: 137 mM NaCl, 2.7 mM KCl, 10 mM Na2HPO4, 2 mM KH2PO4, pH 7.4) were purchased from Sigma-Aldrich.MCF-7 cells were obtained from the Center for Excellence in Molecular Cell Science of the Chinese Academy of Science (Shanghai, China). MCF-7 cells were cultured in DMEM/high glucose medium supplemented with 10% fetal bovine serum (FBS) and 1% antibiotics (penicillin/streptomycin). The culture was maintained at 37 °C under a humidified atmosphere containing 5% CO2.
Fabrication of a CdS QD modified nanopipette
CdS QDs were synthesized according to the previous method31 and characterized using transmission electron microscopy (TEM, JEOL 2800 instrument, Japan). First, a glass capillary (BF100-58-10) was pulled using a micropipette puller (P2000; Sutter Instrument Co.) to produce a nano-capillary with an orifice of ∼150 nm. The surface of the nano-capillary was sputtered with a layer of ITO with a thickness of 50 ± 5 nm, followed by annealing in a tube furnace for 1 h at 250 °C. Then, Apiezon wax was dissolved in chloroform. The nanopipette was dipped in the wax for about 5 s. After the nanopipette was taken out and chloroform evaporated, the ITO layer at the nano-capillary was mostly covered with Apiezon wax, leaving a small region uncovered at the tip. Next, we dipped the nano-capillary into a solution of 2% PDDA containing 0.5 M NaCl for 10 min and a solution of CdS QDs for 10 min, alternately. The nano-capillary was washed with ultra-pure water after each dipping step. This process was repeated four times to fabricate a CdS QD modified nanopipette. Finally, the tip of the CdS QD modified nanopipette was characterized by scanning electron microscopy (SEM, Hitachi S-4800 Instrument, Japan) with an acceleration voltage of 5 kV.PEC measurement
PEC measurement was performed using an electrochemical station (CHI 630E, CH Instrumental, Inc., USA). An LED lamp (3 W) with 425 nm excitation was employed as a light source. The CdS QD modified nanopipette was employed as the working electrode. A Ag/AgCl electrode and Pt wire were used as the reference and counter electrodes, respectively. All the photocurrents were collected at a constant potential of 0 V (vs. Ag/AgCl). For the detection of AA in the solution, the CdS QD modified nanopipette was placed in 10 mM PBS to record the background photocurrent. Once the photocurrent became stable after 5 min, AA with a series of concentrations (0.1, 0.2, 0.5, and 1 mM) was added to the buffer and then the photocurrents were recorded to investigate the PEC response of the nanopipette.For the detection of ALP in the solution, 10 μL of PBS solution containing 20 mM AAP was filled into the nanopipette, which was placed in the bulk solution (10 mM PBS). A voltage of 2 V was introduced between the Pt wire inside the nanopipette and the Ag/AgCl electrode in solution for 20 s using another electrochemical station (CHI 600E, CH Instrumental, Inc, USA). After 3 minutes of this egression process, the background photocurrent was recorded. Then, the same egression and recording procedure was repeated for measuring the response of the nanopipette to ALP (0.1, 0.2, 0.4, 0.6 U mL−1).
Single cell PEC analysis
The MCF-7 cells were cultured in a Petri dish in 10 mM PBS before the analysis. The CdS QD modified nanopipette was mounted on a 3D translation stage under an optical microscope (Olympus X51, Japan). 10 mM PBS containing 20 mM AAP was filled into the nanopipette. For the analysis of the ALP activity in a living cell, the nanopipette was initially positioned outside the cell. A voltage of 2 V was introduced between the Pt wire inside the nanopipette and the Ag/AgCl electrode in 10 mM PBS for 20 s followed by the recording of the photocurrent. When the photocurrent became stable, the nanopipette was inserted into the cell. Then, a voltage of 2 V was introduced between the Pt wire inside the nanopipette and the Ag/AgCl electrode in 10 mM PBS for 20 s again. After 3 minutes, the photocurrent was recorded to analyze the activity of ALP in a living cell.Results and discussion
Characterization of the CdS QD modified nanopipette
As indicated by TEM imaging (Fig. S1, ESI†) and absorption spectrum analysis (Fig. S2, ESI†), the prepared CdS QDs are quasi-spherical particles with diameters of 3–4 nm, which exhibit a broad absorption from 350 to 490 nm. Meanwhile, the inner and outer diameters of the tip of the nanopipette are characterized to be ∼150 and 250 nm, respectively (Fig. S3, ESI†) by SEM. After the nanopipette tip was coated with a layer of ITO and insulative wax, the inner diameter of the tip remained the same, while the outer diameter of the tip increased to ∼300 nm (Fig. 2A). The electrochemical characterization of the nanopipette in ferrocyanine solution shows a steady current of ∼2.5 nA (Fig. 2B, black curve), which confirms the presence of an uncovered ITO region at the tip of the nanopipette. According to our previous work,29 the length of the uncovered ITO is estimated to be ∼3 μm. Upon the modification with CdS QDs, the current dropped to ∼0.23 nA (Fig. 2B, red curve). This obvious decrease in the current should be ascribed to the slow electron transfer of ferrocyanine at the surface of semi-conductive CdS QDs. It is noted that PDDA as a polymer could block the electron transfer of ferrocyanine, as well. To minimize this interference, 0.5 mM NaCl is added inside the PDDA layer that could improve the conductivity of this layer significantly. Therefore, the presence of this layer does not induce an obvious decrease in the current.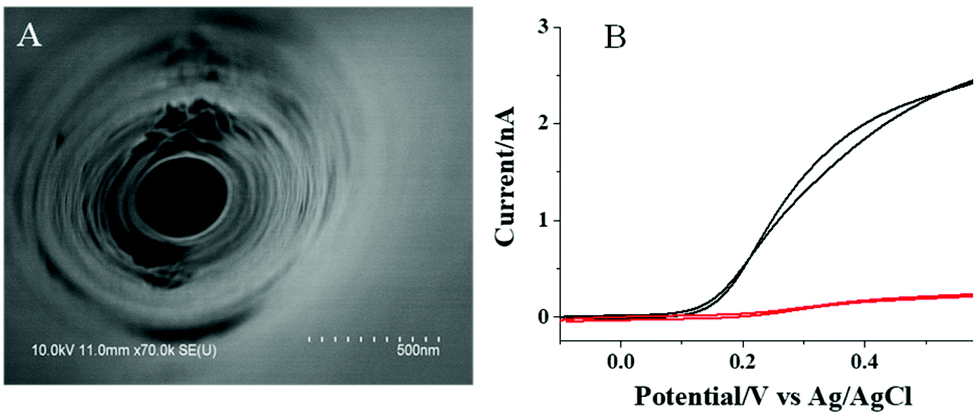 | ||
| Fig. 2 (A) The SEM image of the orifice of the nano-capillary after the sputtering of the ITO layer and coating with wax; (B) cyclic voltammograms of the nanopipette before (black curve) and after (red curve) modifying CdS QDs in 10 mM PBS with 5 mM K4Fe(CN)6. The scan rate is 100 mV s−1. | ||
Photocurrent response to AA and ALP in the solution using the CdS QD modified nanopipette
To test whether the CdS QD modified nanopipette can respond to AA, the photocurrents of the nanopipettes in PBS solution with and without 1 mM AA are recorded and shown in Fig. 3A. Upon the illumination, an obvious current increase is observed in the presence of 1 mM AA indicating the photocurrent response of the nanopipette to AA. The photocurrents are nearly constant when the illumination turns on every 10 s, which exhibits good reproducibility of the response (Fig. 3B). The initial slow transition of the photocurrent during the illumination might be ascribed to the kinetics of the photocatalyzed reaction. When the light turns off, some electrons on the CB of CdS QDs remain, resulting in a slow transition in the current, as well. Compared with the current trace in PBS, AA in the solution served as the donor for the VB of CdS QDs, and thus, the electrons on the CB could transfer to the electrode more easily. As a result, the transition in the presence of AA is faster than that in PBS. The photocurrents increase gradually with the increase in AA concentration from 0.1 to 1 mM (Fig. 3C). The calibration curve in Fig. 3D shows the linear response of the photocurrent to AA from 0.1 to 1 mM, suggesting the feasibility to detect AA using CdS QD modified nanopipettes.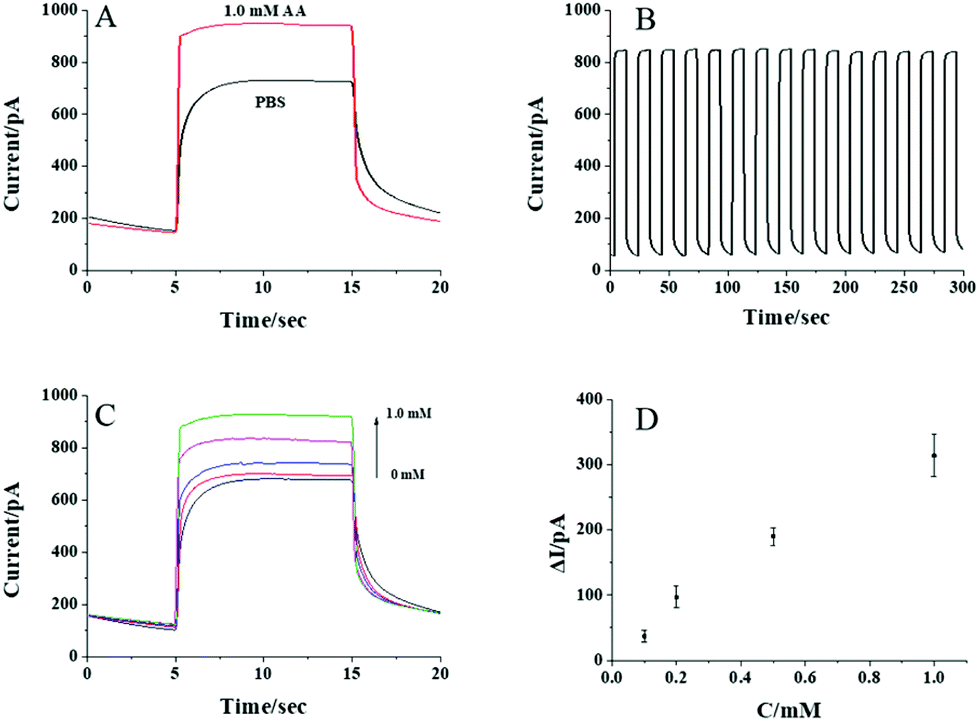 | ||
| Fig. 3 (A) Photocurrent traces of the CdS QD modified nanopipette in the presence and absence of 1 mM AA; (B) photocurrent stability of the CdS QD modified nanopipette in the presence of 1 mM AA; (C) photocurrent traces of AA at different concentrations (0, 0.1, 0.2, 0.5, 1 mM); (D) the linear response of the photocurrent to AA at different concentrations. The error bar presents the standard deviation from three CdS QD modified nanopipettes. | ||
After confirming that the CdS QD modified nanopipette has a good photocurrent response to AA, the activity of aqueous ALP was further analyzed. The nanopipette was filled with 20 mM AAP, which could be egressed by electrochemical pumping to generate AA in the presence of ALP (the reaction scheme is illustrated in Fig. 1). The electrons from the generated AA were donated to CdS QDs, resulting in a good photocurrent response to AA as shown in Fig. 4A. The photocurrent gradually increases with the activity of ALP from 0.1 to 0.6 U mL−1. The nearly linear correlation between the photocurrent and the activity of ALP (Fig. 4B) supports the feasibility to measure the ALP activity. The relative standard deviation of the responses to aqueous ALP using three nanopipettes is calculated to be less than 19.3%.
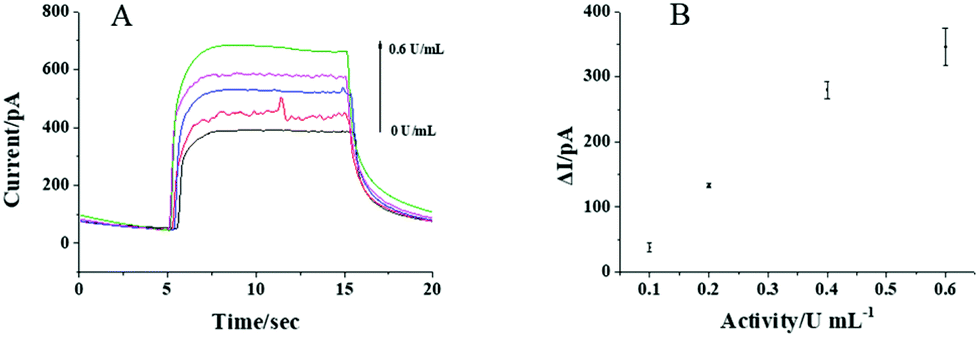 | ||
| Fig. 4 (A) Photocurrent traces of the CdS QD modified nanopipette in the presence of ALP with different activities (0, 0.1, 0.2, 0.4, 0.6 U mL−1); (B) the derived photocurrent response in the presence of ALP with different activities. The error bar presents the standard deviation from three independent measurements. | ||
Detection of the ALP activity in single MCF-7 cells
To analyze the ALP activity in single MCF-7 cells, a nanopipette filled with AAP is penetrated into one living MCF-7 cell, as observed in Fig. 5A. Prior to the cell penetration, the background photocurrent from the nanopipette was recorded as illustrated in Fig. 5B (black curve). Then, after the penetration, a significant photocurrent increase is observed under the illumination, as shown in Fig. 5B (red curve). This photocurrent increase should be caused by the generation of AA from the intracellular reaction between ALP and AAP, which supports the detection of the ALP activity in single MCF-7 cells. It is noted that the power of the illumination used in this work is 3 W, which is spread over the whole cell dish with a diameter of 35 mm. Therefore, the light intensity at a cell (20 μm in size) is calculated to be 98 μW. According to ref. 32, the safe exposure for the cell is 200 μW. Based on this information, the light used in this work should not damage the cell. To exclude the possible photocurrent increase by the electrochemical injection, a nanopipette filled with PBS solution is used to inject PBS into the cell for the control measurement. No obvious difference between the background photocurrent (Fig. 5C, black curve) and the photocurrent after the injection of PBS (Fig. 5C, red curve) is observed that supports our single cell PEC analysis.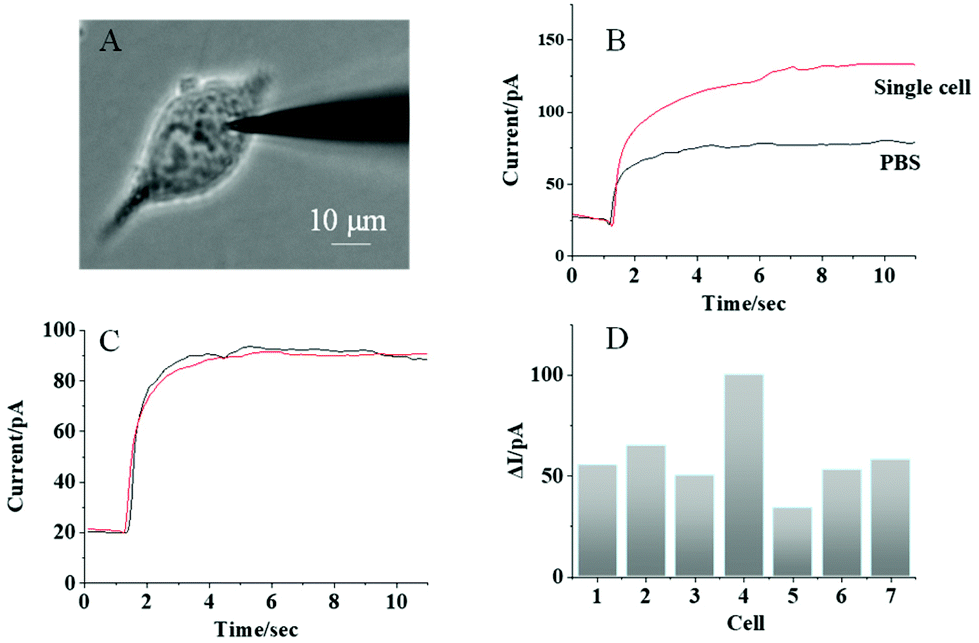 | ||
| Fig. 5 (A) Bright-field image of the CdS QD modified nanopipette penetrated into a single MCF-7 cell; (B) the photocurrent traces of CdS QD modified nanopipettes in PBS solution (background photocurrent, black curve) and in a single MCF-7 cell (red curve) after AAP in the nanopipette was expelled into the cell; (C) photocurrent trace of the CdS QD modified nanopipette after PBS was expelled into the cell (red curve) and the background photocurrent (black curve); (D) the photocurrent increase from 7 single MCF-7 cells using CdS QD modified nanopipettes. | ||
For further investigation of cellular heterogeneity in the ALP activity, 7 single cells were measured in series and the photocurrents are illustrated in Fig. 5D. The average photocurrent increase was 59.2 ± 20.3 pA with a relative standard deviation of 33.9%. From the calibration curve obtained for the solution (Fig. 4B), the average intracellular ALP activity was determined to be 0.12 U mL−1. More importantly, the relative standard deviation in single cell analysis is larger than that obtained from the detection of ALP in aqueous solution, which indicates the high cellular heterogeneity of the ALP activity in single living cells.
Conclusions
Herein, CdS QD modified nanopipettes were designed for the PEC analysis of the ALP activity in single living cells. A good analytical performance was obtained from these nanopipettes towards the detection of AA and ALP. Furthermore, when the nanopipette was inserted into a single living cell containing intracellular ALP, a significant increase in photocurrent was observed that validates the single cell PEC analysis of intracellular protein activity. Continuous analyses of more proteins using the corresponding kit components are being conducted in the lab to solidate this single cell PEC approach. Moreover, the modulation of the PEC response by choosing some novel photocurrent materials is also being studied to amplify the detection.Conflicts of interest
There are no conflicts to declare.Acknowledgements
This work was supported by the National Natural Science Foundation of China (nos 21874069, 21974060).Notes and references
- M. Riedel, N. Sabir, F. W. Scheller, W. J. Parak and F. Lisdat, Nanoscale, 2017, 9, 2814–2823 RSC.
- J. Zhuang, D. Tang, W. Lai, M. Xu and D. Tang, Anal. Chem., 2015, 87, 9473–9480 CrossRef CAS PubMed.
- J. Tang, B. Kong, Y. Wang, M. Xu, Y. Wang, H. Wu and G. Zheng, Nano Lett., 2013, 13, 5350–5354 CrossRef CAS PubMed.
- R. Freeman, J. Girsh and I. Willner, ACS Appl. Mater. Interfaces, 2013, 5, 2815–2834 CrossRef CAS PubMed.
- M. Hu, H. Yang, Z. Li, L. Zhang, P. Zhu, M. Yan and J. Yu, Biosens. Bioelectron., 2020, 147, 111786 CrossRef CAS PubMed.
- Z. Yue, F. Lisdat, W. J. Parak, S. G. Hickey, L. Tu, N. Sabir, D. Dorfs and N. C. Bigall, ACS Appl. Mater. Interfaces, 2013, 5, 2800–2814 CrossRef CAS PubMed.
- M. Liang, S. Liu, M. Wei and L. H. Guo, Anal. Chem., 2006, 78, 621–623 CrossRef CAS PubMed.
- G. L. Wang, J. J. Xu and H. Y. Chen, Biosens. Bioelectron., 2009, 24, 2494–2498 CrossRef CAS PubMed.
- N. Zhang, Y. F. Ruan, L. B. Zhang, W. W. Zhao and J. J. Xu, Anal. Chem., 2018, 90, 2341–2347 CrossRef CAS PubMed.
- Y. Chu, A. P. Deng, W. Wang and J. J. Zhu, Anal. Chem., 2019, 91, 3619–3627 CrossRef CAS PubMed.
- D. G. Dilgin and H. Ì. Gökçel, Anal. Methods, 2015, 7, 990–999 RSC.
- L. He, Q. Liu, S. Zhang, X. Zhang, C. Gong, H. Shu, G. Wang, H. Liu, S. Wen and B. Zhang, Electrochem. Commun., 2018, 94, 18–22 CrossRef CAS.
- X. Zhao, S. Zhou, Q. Shen, L. P. Jiang and J. J. Zhu, Analyst, 2012, 137, 3697–3703 RSC.
- Q. Shen, J. Jiang, S. Liu, L. Han, X. Fan, M. Fan, Q. Fan, L. Wang and W. Huang, Nanoscale, 2014, 6, 6315–6321 RSC.
- C. Q. Zhao, J. Zhou, K. W. Wu, S. N. Ding, J. J. Xu and H. Y. Chen, Anal. Chem., 2020, 92, 6886–6892 CrossRef CAS PubMed.
- H. B. Yildiz, R. Freeman, R. Gill and I. Willner, Anal. Chem., 2008, 80, 2811–2816 CrossRef CAS PubMed.
- K. Wang, R. Zhang, N. Sun, X. Li, J. Wang, Y. Cao and R. Pei, ACS Appl. Mater. Interfaces, 2016, 8, 25834–25839 CrossRef CAS PubMed.
- R. Pan, K. Hu, D. Jiang, U. Samuni and M. V. Mirkin, J. Am. Chem. Soc., 2019, 141, 19555–19559 CrossRef CAS PubMed.
- Y. Li, D. Bergman and B. Zhang, Anal. Chem., 2009, 81, 5496–5502 CrossRef CAS PubMed.
- B. K. Jena, S. J. Percival and B. Zhang, Anal. Chem., 2010, 82, 6737–6743 CrossRef CAS PubMed.
- J. G. Roberts, E. C. Mitchell, L. E. Dunaway, G. S. McCarty and L. A. Sombers, ACS Nano, 2020, 14, 2917–2926 CrossRef CAS PubMed.
- W. H. Huang, D. W. Pang, H. Tong, Z. L. Wang and J. K. Cheng, Anal. Chem., 2001, 73, 1048–1052 CrossRef CAS PubMed.
- R. A. Nascimento, R. E. Özel, W. H. Mak, M. Mulato, B. Singaram and N. Pourmand, Nano Lett., 2016, 16, 1194–1200 CrossRef CAS PubMed.
- M. H. Asif, S. M. Usman Ali, O. Nur, M. Willander, C. Brännmark, P. Strålfors, U. H. Englund, F. Elinder and B. Danielsson, Biosens. Bioelectron., 2010, 25, 2205–2211 CrossRef CAS PubMed.
- Y. L. Ying, Y. X. Hu, R. Gao, R. J. Yu, Z. Gu, L. P. Lee and Y. T. Long, J. Am. Chem. Soc., 2018, 140, 5385–5392 CrossRef CAS PubMed.
- H. Xu, S. Zhou, D. Jiang and H. Y. Chen, Anal. Chem., 2018, 90, 1054–1058 CrossRef CAS PubMed.
- X. W. Zhang, A. Oleinick, H. Jiang, Q. L. Liao, Q. F. Qiu, I. Svir, Y. L. Liu, C. Amatore and W. H. Huang, Angew. Chem., 2019, 58, 7753–7756 CrossRef CAS PubMed.
- K. Hu, Y. Li, S. A. Rotenberg, C. Amatore and M. V. Mirkin, J. Am. Chem. Soc., 2019, 141, 4564–4568 CrossRef CAS PubMed.
- R. Pan, M. Xu, D. Jiang, J. D. Burgess and H. Y. Chen, Proc. Natl. Acad. Sci. U. S. A., 2016, 113, 11436–11440 CrossRef CAS PubMed.
- J. L. Millán, Purinergic Signalling, 2006, 2, 335–341 CrossRef PubMed.
- W. W. Zhao, P. P. Yu, Y. Shan, J. Wang, J. J. Xu and H. Y. Chen, Anal. Chem., 2012, 84, 5892–5897 CrossRef CAS PubMed.
- A. Calabuig, M. Mugnano, L. Miccio, S. Grilli and P. Ferraro, J. Biophotonics, 2017, 10, 919–927 CrossRef CAS PubMed.
Footnote |
| † Electronic supplementary information (ESI) available: Characterization of CdS and nanocapillaries. See DOI: 10.1039/d1an01273h |
| This journal is © The Royal Society of Chemistry 2021 |