
Micro-Raman spectroscopy of lipid halo and dense-core amyloid plaques: aging process characterization in the Alzheimer's disease APPswePS1ΔE9 mouse model†
Emerson A.
Fonseca‡
 *ab,
Lucas
Lafeta‡
a,
João
Luiz Campos
a,
Renan
Cunha
a,
Alexandre
Barbosa
ac,
Marco A.
Romano-Silva
d,
Rafael
Vieira
e,
Leandro M.
Malard
a and
Ado
Jorio
ab
*ab,
Lucas
Lafeta‡
a,
João
Luiz Campos
a,
Renan
Cunha
a,
Alexandre
Barbosa
ac,
Marco A.
Romano-Silva
d,
Rafael
Vieira
e,
Leandro M.
Malard
a and
Ado
Jorio
ab
aDepartamento de Física, ICEx, Universidade Federal de Minas Gerais, Belo Horizonte, MG 31270-901, Brazil. E-mail: fonseca.et.al@gmail.com
bPrograma de Pós-Graduação em Inovação Tecnológica e Biofarmacêutica, Universidade Federal de Minas Gerais, Belo Horizonte, MG 31270-901, Brazil
cDepartamento de Oftalmologia, Faculdade de Medicina, Universidade Federal de Minas Gerais, Belo Horizonte, MG 30130-100, Brazil
dDepartamento de Saúde Mental, Faculdade de Medicina, Universidade Federal de Minas Gerais, Belo Horizonte, MG 30130-100, Brazil
eDepartamento de Bioquímica e Imunologia, Universidade Federal de Minas Gerais, Belo Horizonte, MG 31270-901, Brazil
First published on 11th August 2021
Abstract
The deposition of amyloid plaques is considered one of the main microscopic features of Alzheimer's disease (AD). Since plaque formation can precede extensive neurodegeneration and it is the main clinical manifestation of AD, it constitutes a relevant target for new treatment and diagnostic approaches. Micro-Raman spectroscopy, a label-free technique, is an accurate method for amyloid plaque identification and characterization. Here, we present a high spatial resolution micro-Raman hyperspectral study in transgenic APPswePS1ΔE9 mouse brains, showing details of AD tissue biochemical and histological changes without staining. First we used stimulated micro-Raman scattering to identify the lipid-rich halo surrounding the amyloid plaque, and then proceeded with spontaneous (conventional) micro-Raman spectral mapping, which shows a cholesterol and sphingomyelin lipid-rich halo structure around dense-core amyloid plaques. The detailed images of this lipid halo relate morphologically well with dystrophic neurites surrounding plaques. Principal Component Analysis (PCA) of the micro-Raman hyperspectral data indicates the feasibility of the optical biomarkers of AD progression with the potential for discriminating transgenic groups of young adult mice (6-month-old) from older ones (12-month-old). Frequency-specific PCA suggests that plaque-related neurodegeneration is the predominant change captured by Raman spectroscopy, and the main differences are highlighted by vibrational modes associated with cholesterol located majorly in the lipid halo.
Introduction
In 1906, Alois Alzheimer first described neurofibrillary tangles and neuritic plaques (or amyloid plaques) in the brain of a 55-year-old woman with cognitive impairment, as well as complementary signs and symptoms associated with dementia. From this point, researchers around the world have sought to understand and characterize the biochemical and structural changes that would become the hallmarks of Alzheimer's Disease (AD).1 Currently, amyloid peptide aggregation is considered one of the main biochemical features of the AD pathological process and a relevant target for new treatment and diagnostic approaches, since amyloid plaque formation seems to precede further morphological alterations, with extensive neurodegeneration, and it represents the main clinical aspects of AD.2Amyloid plaques are composed of misfolded β amyloid (Aβ) peptides. According to the amyloid hypothesis, the cascade of events leads to a complex process of Aβ aggregation involving intermediate neurotoxic oligomeric structures which form protofibrils, finally evolving into mature fibrils that aggregate and become packed in the core. The whole pathway is supposed to culminate in AD neurodegeneration.3,4
At the cellular level, when oligomers and protofibrils come in contact with neurons, it leads to axon and dendrite (neurites) dystrophy, with the loss of dendritic spines and withering of dendritic shafts and sprouting, microtubule disruption, and impairment of axonal transport.2,5–9 The microglia form a physical barrier around the plaque to prevent its radial growth and neuronal damage,10 phagocytizing the oligomers and protofibrils.11,12 The astrocytes engulf presynaptic dystrophies and phagocytize them.13,14 Both microglia and astrocyte cells undergo morphological transformations acquiring an activated phenotype and all cells in the microenvironment display metabolic changes.15
Immunostaining techniques are the usual methods to microscopically access the information contained in this plaque-related neurodegeneration complex process. There are several studies reporting each of the previously described events using antibody markers and specific chemical dyes,16–18 and sophisticated approaches using transgenic mice expressing fluorescent cell specific proteins.2,5,19
Raman spectroscopy (RS) is another microscopy technique that has aroused interest with regard to several pathological conditions. Currently several histopathological diagnoses have been proposed based on RS protocols.20–25 Raman scattering is the inelastic light scattering by matter, where the frequency of the incident light is modified due to the vibrational modes of the system, generating scattered light beams of different energy values with respect to the incident beam. This energy displacement, available as Raman shifts, is unique according to specific physical and chemical structures.26 Thus, RS has been used to characterize vibrational fingerprints of chemical species from different sample sources.27
There is a set of vibrational modes that can be used as a fingerprint of the amyloid plaque.21,28 At least in the mouse model, the mature amyloid plaque presents a core that is rich in β sheet conformation, surrounded by protofibrillar Aβ aggregates in diffuse plaques and diffuse Aβ halo areas.10,29 The β sheet secondary protein structure displays the specific Raman Amide I (AmI) frequency at ∼1670 cm−1. In addition, several other vibrational modes enable the identification of the dense-core Aβ plaques, such as Amide III (AmIII), which is also related to the β sheet conformation, and phenylalanine (Phe). The Aβ primary sequence presents two Phe residues showing an intense and characteristic vibrational mode at ∼1007 cm−1, which is attributed to their aromatic ring breathing mode.21,30,31 There has been an extensive effort to characterize the amyloid plaques directly in the brain tissue using RS.32–35 Summers et al. conducted a laborious study based on multimodal spectroscopy, including RS, to acquire images of AD brain tissue and amyloid plaques.34 However, the RS results did not show any vibrational mode related to the amyloid plaque or even the Raman image of the plaque. Michael et al. showed hyperspectral Raman imaging of amyloid plaques, but they were also not able to demonstrate the related Raman shifts, and the correlation between the tissue analyzed by Raman spectroscopy and the image confirmation by immunostaining was not clear.35 Recently, Palombo et al. presented a hyperspectral Raman image of an amyloid plaque followed later by staining confirmation.36
Spectroscopy studies using Raman or Fourier transform infrared spectroscopy (FTIR) generally show lipid-rich structures surrounding the dense-core plaque.29,36–39 This halo was related to degenerated neurites and myelin sheaths, as reported by Ji et al. using Stimulated Raman Scattering,28 whilst Palombo et al. suggested astrogliosis as its main origin.36 A recent study, using human brain tissue, was not able to find the Raman fingerprint for neither Aβ accumulation,40 nor the lipid halo that has been documented before.21,28,36
The objective of this work is to take a step further in the use of RS for histological diagnosis and also as an effective tool aiming at the characterization of biochemical and histological changes related to amyloid plaque formation. The past studies have been conducted at spatial resolutions of 0.47 μm,35 1.4 μm,36 and 6 μm.41 In this study, we build on the established literature by performing sub-micron imaging, which has provided new insights at the cellular and sub-cellular levels. We characterized the lipid-rich structures surrounding the dense-core Aβ plaque using micro-Raman imaging reaching the diffraction limit (spatial resolution of ∼0.3 μm), with mapping steps ranging between 0.25 μm and 0.35 μm.
First, we carried out label-free imaging of dense-core plaques using stimulated Raman scattering (SRS) microscopy to locate plaque and lipid-rich halo structures in few second scans. Subsequently, the same AD tissue was characterized with spontaneous (conventional) micro-Raman hyperspectroscopy imaging, to identify the chemical and histological characteristics in the AD tissue in brain samples of 6 and 12 months old transgenic mice. Our data clearly demonstrate the contribution of sphingomyelin (SM), apart from cholesterol (Chol), in the lipid halo structure. Secondly, we used a multivariate principal component analysis (PCA) to carry out the cross-sectional study using the hyperspectral scanning of a set of young adult (6 months) and aged (12 months) transgenic mice, as well as wild-type mice. PCA showed lipid molecules as a principal component to differentiate young adults from elderly mice.
Results and discussion
Aβ plaque imaging by stimulated micro-Raman scattering
The amyloid plaque is not visible in bright field microscopy, making the use of some specific markers necessary, such as Congo red, silver, Thioflavin S (ThioS), curcumin, antibody and others.42–45 In a previous study, we used two-photon-excited fluorescence prior to acquiring autofluorescence images of tissue and plaques to help us to locate the samples.21 In this work, we use SRS microscopy to achieve fast and label-free identification of the Aβ plaques before spontaneous Raman hyperspectral scanning.46 First, we acquired a histological and anatomical image of the tissue by SRS in the lipid vibrational mode at 2850 cm−1. Using this frequency, we were able to identify lipid-rich halo structures distributed around the cortex and hippocampus (Fig. 1A). This frequency has an intense peak, useful for the fast acquisition of histological images of tissues, showing lipid accumulation regions, normally harboring a dense-core Aβ plaque. Once the lipid halo was identified, we performed amyloid plaque imaging by SRS at the frequency of the β sheet protein secondary structure (AmI, ∼1670 cm−1) (Fig. 1B and C). For all lipid haloes identified, we found amyloid plaques inside them. AmI imaging takes ∼4.2 minutes, while lipid halo imaging takes ∼50 seconds. Therefore, searching the lipid halo as a way to discover the possible distribution of amyloid plaques in tissue proved useful. ThioS staining utilized to validate the SRS method is shown in Fig. 1D–F. | ||
| Fig. 1 Amyloid plaque image by SRS and ThioS fluorescence imaging. The SRS image of the tissue was captured for (A) the lipid (frequency 2850 cm−1) and (B and C) locations of amyloid plaques (1670 cm−1) corresponding to squares I and II in (A), respectively. ThioS images (D–F). Scale bars in (A and D) indicate 30 μm; in (C and F) indicate 15 μm. | ||
Biochemical mapping of Alzheimer's tissue
Fig. 2 shows the result of a hyperspectral micro-Raman analysis of two Aβ plaques. By plotting the Raman intensities at different spectral ranges, the images show different structures. As shown in Fig. 3, the frequency values were able to identify in situ the core of the amyloid plaque: Phe (1007 cm−1, 1022 cm−1, 1033 cm−1), Phe and tyrosine (1610 cm−1), amide III β sheet (centered at 1233 cm−1), amide I β sheet (1670 cm−1), and amide B (3070 cm−1). Several other frequencies are related to lipids that form the lipid halo.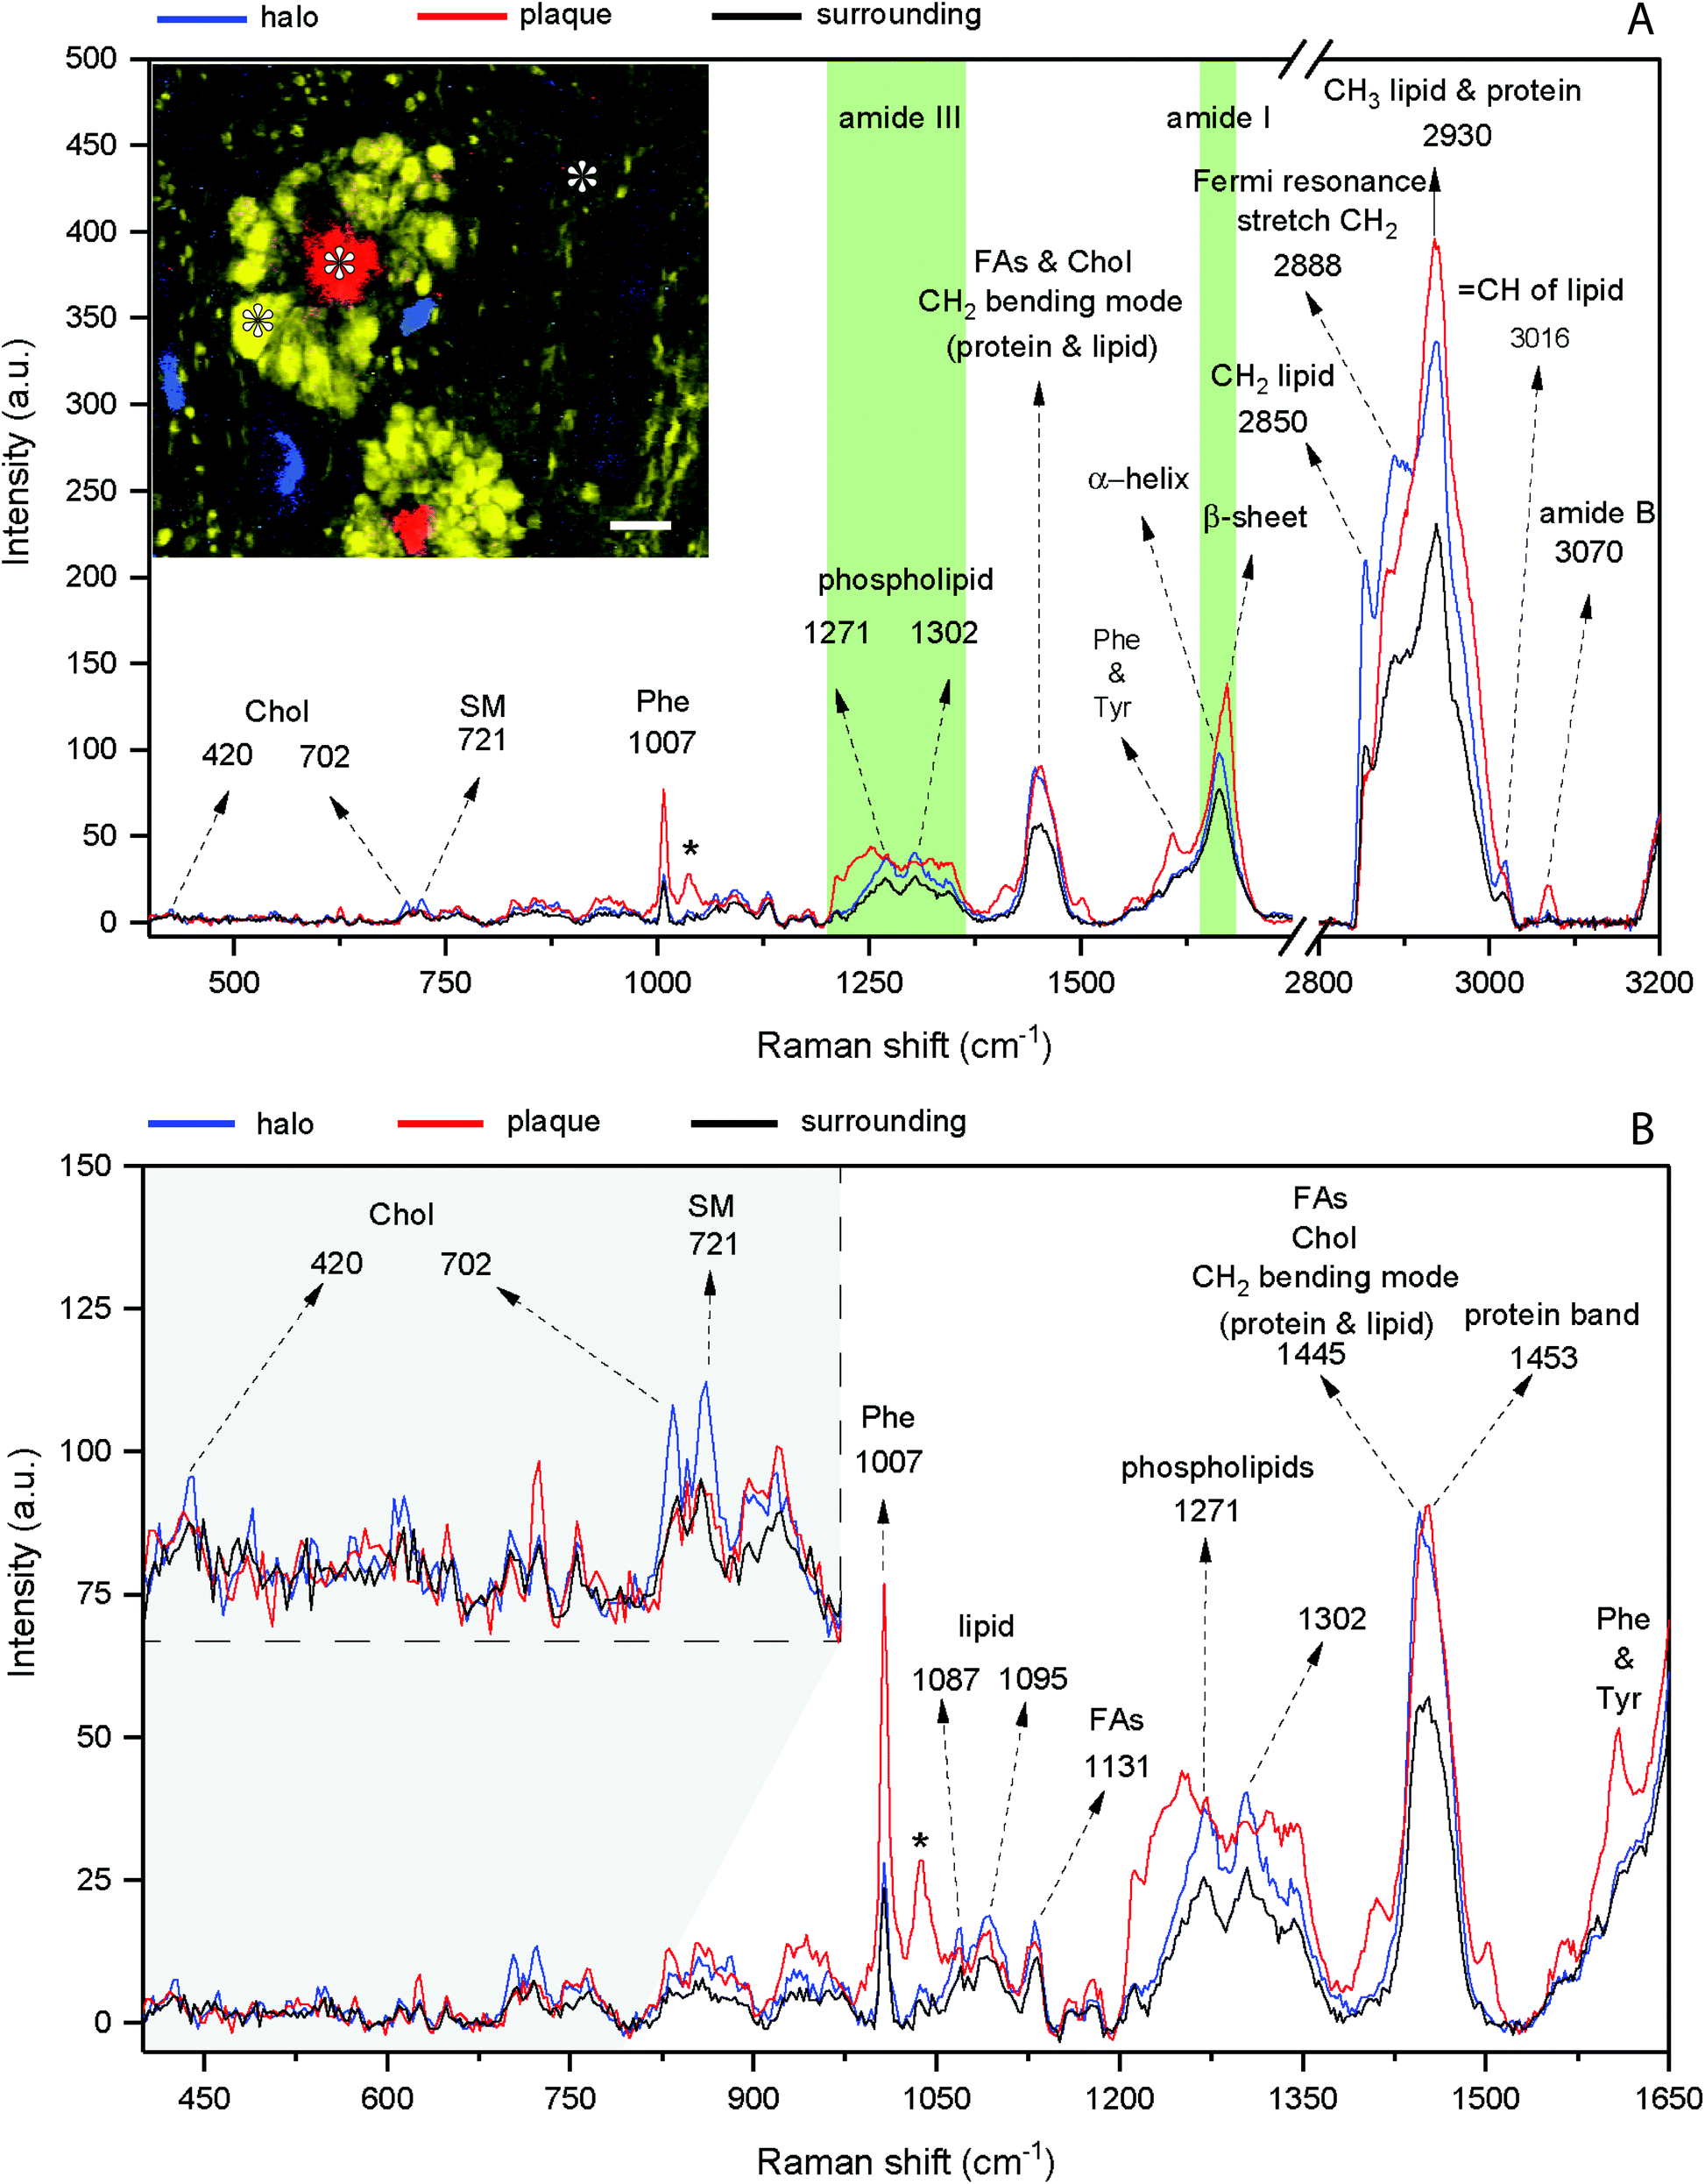 | ||
| Fig. 2 Representative spectra of the amyloid plaque and lipid halo of the 12 month old transgenic mouse brain. (A) Entire spectral range (400 cm−1 to 3200 cm−1). Amide I and III bands are highlighted in green. The inset shows the Raman image of the dense-core plaque (red – AmI vibration), DNA vibration at 791 cm−1 (blue), and CH2 stretching of lipid (yellow). Asterisks show the points corresponding to the spectra. Scale bar indicates 10 μm. (B) The same spectra focusing on the range of 400 to 1650 cm−1. Note the cholesterol peaks (420 cm−1 and 702 cm−1) and sphingomyelin (721 cm−1) in the lipid halo spectrum (inset). The asterisk shows the phenylalanine band at 1033 cm−1. Chol: cholesterol; SM: sphingomyelin; FAs: fatty acids; Phe: phenylalanine; Tyr: tyrosine. | ||
 | ||
| Fig. 3 High spatial resolution hyperspectral images of a 12 month old AD mouse brain section. The hyperspectral images had their background removed using the Project FIVE 5.0 WITec software, then the images were generated by selecting filters for each frequency value in the software. The asterisk indicates that the images (1427 cm−1, 1660 cm−1 amide I α helix and 1670 cm−1 β sheet) had their background subtracted using pixels at both sides from the filter range. Double asterisks **, indicate that the image was formed centered at 1022 cm−1 in the range of 40 cm−1 (1022/40 cm−1) to cover the two assigned vibrational modes of Phe, 1007 cm−1 and 1033 cm−1. The panel (bottom-right): DNA + dense-core amyloid plaque + lipid generated by the 791 cm−1, 1670 cm−1, and 2850 cm−1 spectra, respectively. Scale bar indicates 10 μm. | ||
The dense-core Aβ plaque spectrum shows the AmI (1670 cm−1) blue shift and the AmIII (1233 cm−1) red shift, as well the Phe peak (1007 cm−1) intensity increases, and a change in the relative intensities of CH stretching modes (CH2 at 2850 cm−1 and CH3 at 2930 cm−1). The lipid halo spectrum presents an increase in Chol (702 cm−1), SM (721 cm−1) and CH2 stretching mode related to lipid (2850 cm−1), as compared with surrounding tissue (Fig. 2).
To show histological details at the cellular or sub-cellular level, and to analyze the biochemical AD tissue in different developmental stages, we first performed high spatial resolution micro-Raman mapping of the lipids and a dense-core Aβ plaque distribution in the brain slices of transgenic (Tg) mice (Fig. 3, 4 and ESI†). The spatial resolution is enough to enable visualization of nuclei of cells surrounding the lipid halo, suggesting glial cells (Fig. 5). As the resident macrophages of the brain, microglial cells become responsive to microenvironmental variations and, once they are activated, they play a crucial role either in the clearance of Aβ fibrils and oligomers, or act as a physical barrier around the plaques.10,12,19 Reactive astrocytes are also part of the process, engulfing and digesting presynaptic dystrophic neurites and contributing to AD neuroinflammatory processes along with microglia.13
 | ||
| Fig. 4 Hyperspectral Raman Image of 6 and 12 month-old transgenic mice (Tg6 and Tg12, respectively). The images were generated using DNA phosphodiester bond frequency (791 cm−1, blue), amide I vibrational modes (1670 cm−1, red), total lipid by CH2 stretching vibration (2850 cm−1, yellow). In all images, the lipid halo (artificially colored in yellow here) surrounds the amyloid plaque and some cell nuclei surround the halo (see the last frame, overlap). Visually, there is no difference between the groups. Scale bars indicate 10 μm. Artificially colored. | ||
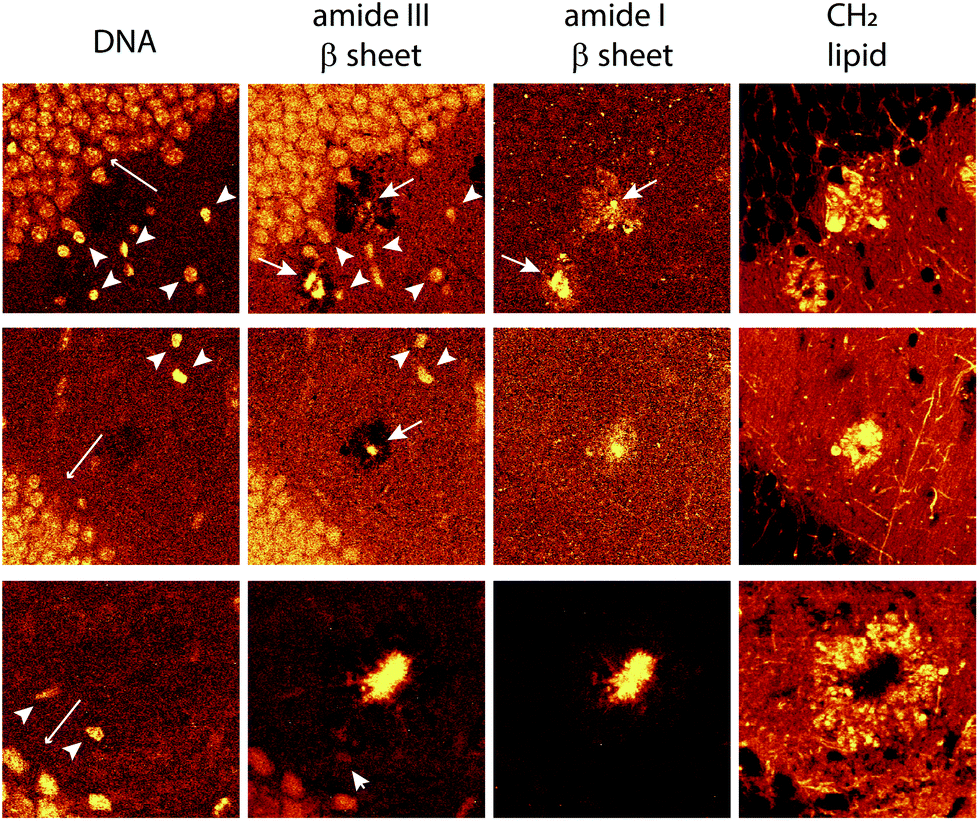 | ||
| Fig. 5 Hyperspectral images of cell nuclei surrounding the lipid halo of 12 month old transgenic mice. Nuclei of cells with respect to DNA frequency (791 cm−1, left-most images) amide III β sheet (centered at 1233 cm−1, center-left images) amide I β sheet (1670 cm−1, right-most images), stretching of the total lipid (2850 cm−1) forming the lipid halo. At amide III β sheet, nuclei are highlighted probably due to overlapping frequencies of protein and DNA in these ranges (see the frequency table in the ESI†). Note in DNA images nuclei of the cells of the neurons in the dentate gyrus (long arrow), smaller nuclei showing greater intensity (arrowhead) and different morphology, possibly glial cells. Amide I and III, arrows showing the core plaques. | ||
The representative hyperspectral images shown in Fig. 4 did not reveal significantly different morphology in young adults and aged mice, with the dense lipid halo surrounding the dense-core Aβ plaques observed in both. The Raman frequency of lipid (2850 cm−1), AmI frequency of β sheet structure (1670 cm−1) and DNA phosphodiester bond (791 cm−1) always provide an overview of the complex cellular changes occurring in the AD brain. It is interesting to note that the lipid halo is larger than the dense-core plaque (Fig. 3, 4, 5 and the ESI†). Morphologically, these lipid halos related well with dystrophic neurites5,8,10 more than astrogliosis, as previously suggested.36 The axonal transport and metabolism of neurons around the amyloid plaques were affected, showing dystrophy.2,47–51 However, more studies are necessary to confirm this hypothesis.
Since the differences between the plaques and the lipid-rich structures of different developmental stages of mice were not visually evident, we used PCA to discriminate the differences between our hyperspectral data, as discussed below.
Principal component analysis (PCA) for AD progression differentiation
PCA was previously used to determine the biochemical differences in the tissue samples according to hyperspectral data.52 We applied PCA to our hyperspectral data to determine spectral differences among 12-month-old wild type (WT) and Tg mice, and between Tg6 and Tg12 mice. We first performed PCA in the scanned spectral range (300 cm−1 to 3800 cm−1) of plaques of eight adult mice (4 from Tg6, and 4 from Tg12), and one hyperspectral mapping for a WT mouse. Fig. 6A shows the mean spectra of each group, WT, Tg6 and Tg12. Fig. 6B presents the distribution of the first principal component (PC1), responsible for ∼44.59% of the total spectral variance for the Tg and WT mice, showing significant differences among them. To find which vibrational modes across the spectrum have the most relevant contribution to differentiate the groups of mice, we selected a spectral region (10 cm−1 width) based on seven distinct frequencies: 420 cm−1 and 702 cm−1 (Chol), 721 cm−1 (SM), 1007 cm−1 (Phe), 1670 cm−1 (β sheet structure), 2850 cm−1 (CH2 stretching of the total lipid) and 2930 cm−1 (CH3 stretching of the total lipid and protein). All the frequencies described above exhibited a clear trend for enabling the differentiation of the experimental groups. As shown in Fig. 6C, the PC1 difference between WT and Tg12 is larger than the difference between WT and Tg6. Therefore, although there is no clear pathophysiological relationship between cholesterol and the amyloid plaque formation, the PCA showed that the vibrational modes at 420 cm−1 and 702 cm−1, both related to Chol, were able to significantly differentiate the Tg 6 and Tg 12 mice. | ||
| Fig. 6 Differentiation of young adults and aged APP/PS1 Tg mice by PCA. (A) Mean Raman spectra of the brain tissue. The hyperspectral means of each group are presented, WT (black), Tg6 (blue) and Tg12 (red). Green vertical areas highlight regions of cholesterol/sphingomyelin, amide III and amide I. (B) Histogram showing the results from the PCA of the full spectral windows from 300 cm−1 to 3800 cm−1. (C) PC1 distributions at different frequencies (420 cm−1, 702 cm−1, 721 cm−1, 1007 cm−1, 1670 cm−1, 2850 cm−1, 2930 cm−1). Error bars indicated the PC1 variance. WT (black), Tg6 (blue), and Tg12 (red). For all frequency values, there is a clear trend of separation between the animals of each group. Chol: cholesterol; SM: sphingomyelin; Phe: phenylalanine; PC1: principal component1. | ||
There are several studies investigating the association between neurodegeneration, Aβ aggregation and lipid deposition, especially Chol, in AD. The brain is the organ that has the highest concentration of this lipid, approximately 25% of all Chol in the body.53 However, according to the literature, changes in the Chol content in AD, as well as their co-localization within the amyloid plaque, remain controversial.54–56 The main analytical approach used to measure Chol and other lipids in amyloid plaques and AD brains is by homogenate analysis using liquid chromatography and mass spectrometry.57,58 In addition, these are multi-step approaches that involve solvent extraction and may change the sample. The spatial location of biomolecules in the tissue is not defined by these techniques. Recently, a more sophisticated chemical imaging combining matrix assisted laser desorption/ionization imaging mass spectrometry has been presented.59 However, RS is effective at mapping the distribution of Chol and other molecules without previous preparation of tissue, keeping the histological structures intact. Here we show the hyperspectral Raman images of the dense-core amyloid plaques and the lipid-rich halo structures and we explored the contribution of Chol in these structures by RS. Fig. 7 shows hyperspectral images of Chol, SM and CH2 total lipid for Tg6 and Tg12. According to the results, the structures in the hyperspectral image formed by Chol- and SM-related peak frequencies co-localizes with the structures formed in the hyperspectral image of frequencies related to total lipids (2850 cm−1) in the halo, i.e. they do not co-localize with the observed dense-core Aβ plaques. Both Chol and SM form the lipid-rich structures surrounding the dense-core. The main hyperspectral images of the dense-core Aβ plaque related frequencies, DNA and lipid for Tg6 and Tg12 are shown in Fig. S1.†
 | ||
| Fig. 7 Hyperspectral image of cholesterol, sphingomyelin and total lipid. (A) Representative spectra (Tg12) of the amyloid plaque (red), lipid halo (blue) and surrounding tissue (black) showing the Chol, SM, and Phe peaks. (B) Sequence of images showing Chol frequencies (420 cm−1, 702 cm−1), SM (721 cm−1), and CH2 lipid (2850 cm−1) for Tg6 and Tg12. The Chol and SM frequencies form the lipid-rich structure, as well as the total lipid frequency (2850 cm−1). Note the lipid halo limits are more perceptible in Tg12 than Tg6. Scale bars, 10 μm. Chol: cholesterol; SM: sphingomyelin; Phe: phenylalanine. | ||
These data should be interpreted as a measure of the lipid distribution in neural tissue. The human brain is basically made up of 30% protein and 70% lipid, where Chol represents 27.7% and SM 7.9%.60 Most of the Chol is found in the membranes of neuronal and glial cells, whilst SM accounts for approximately 10% of mammalian cellular lipids and it is highly enriched in myelin sheets.61 These two biomolecules constitute an important class of membrane lipids. SM is anchored in the membrane bilayer, together with Chol, representing a major component of lipid raft membrane microdomains.62
In this sense, RS is a valuable tool for identifying features related to lipid distribution, especially the 2850 cm−1 Raman shift of the lipid halo, as a picture of the AD neurodegeneration process and associated neuroinflammation.
This result suggests that changes in the region of the dense-core Aβ plaque captured by the RS are not exclusively related to the presence of Aβ. The presence of Chol and SM vibrational modes in the halo indicates that neurodegeneration and neuroinflammation should be the contributing factors to the differentiation by RS, as much as the dense-core Aβ plaques alone, i.e. that the changes that differentiate animals according to the stage of the disease are not limited to the plaque itself.
Although the presence of amyloid plaques is frequently related to AD, their presence does not fully explain the progression of the disease. A post mortem analysis of the brains of AD patients shows that neurofibrillary tangles, rather amyloid plaques, are predictive of the cognitive status in AD.63 Patients with similar amounts of amyloid plaques in the brain show a difference in glucose metabolism, suggesting that neurodegeneration, and therefore, disease progression, does not depend exclusively on the plaque burden.64 In this sense, our findings are in accordance with the studies on neurodegeneration in AD and they open a new perspective for the use of RS in the AD study.
Cluster maps
In the human brain, the amyloid plaques show different morphologies, (i) diffuse, (ii) fibrillar and (iii) dense-core type.65 In a recent study, Röhr et al. presented a differentiation of these three types of human amyloid plaques, using FTIR.39 Their cluster analysis showed a dense-core Aβ surrounded by a “corona” of Aβ aggregates.To improve our spectroscopy study of amyloid plaques, after analyzing the PC1 distribution, we performed cluster analysis by PCA using all frequencies for Tg6 and Tg12, considering the first nine principal components and nine clusters. Nine clusters was a good rational considering our images always depict a clear overview of three components (lipid, beta sheet and DNA). The results are presented in Fig. 8. All frequency values and their assignments are given in the ESI Table.† For PCA, values related with lipids (420 cm−1, 702 cm−1, 721 cm−1, 763 cm−1, 876 cm−1, 1104 cm−1, 1267 cm−1, 1295 cm−1, 1428 cm−1, 1437 cm−1, and 1464 cm−1), lipid total (2850 cm−1), total lipid and protein content (2930 cm−1) and the Aβ structure (1233 cm−1, 1670 cm−1, and 3070 cm−1), as well phenylalanine (1007 cm−1) were chosen, and a screeplot (Fig. S5†) showing PC importance and PC loading (Fig. S6†) is presented in the ESI.† As can be seen in the cluster maps, the dense-core amyloid plaque is well defined for both animals, Tg6 and Tg12, mostly by clusters 5 and 7. On the other hand, the lipid halo showed significant differences in intensities of points belonging to each cluster. Note that clusters 6 and 8 clearly define a region of the halo structure in Tg12, which is not well defined in Tg6. Cluster 9 also showed a significant difference between adult young and aged mice, which in Tg6 is much more abundant, dispersed and forms an edge of the cluster 8. There seems to be a temporal relationship between clusters 6, 8 and 9. As cluster 9 decreases, the contribution of clusters 6 and 8 localized around the plaque core increases, as seen in the elderly animal. Interestingly, there is a specific cluster (8) that describes a region of the halo's edge, thinner in aged mice.
 | ||
| Fig. 8 Cluster Maps of AD mouse brain tissues for Tg6 (upper panel) and Tg12 (lower panel) mice. (A) Bright field optical images. (B) Respective hyperspectral Raman images from the black-square area. Dense-core amyloid plaques (red), lipid (yellow), and DNA (blue). Scale bars, 10 μm. (C) PCA cluster maps considering all frequencies of young and aged mice. | ||
This result suggested the chemical heterogeneity in the AD tissue analyzed by PCA of RS, which is able to discriminate the young and aged transgenic mice. The most important contribution for differentiating the two groups lies in the surrounding lipid halo rather than in the plaque core, as demonstrated. Similar results are observed in other plaques, as shown in Fig. S6.†
Conclusion
In summary, we have studied the differences between AD Tg (6 and 12 months) and WT mice by hyperspectral micro-Raman spectroscopy, including principal component analysis. First, we used stimulated Raman scattering microscopy to locate the dense-core amyloid plaques using amide I β sheet vibrational mode, as well as the lipid halo, using CH2 lipid stretching vibrational mode. These two modes gave us a picture of the brain tissue showing the lipid-rich structure surrounding the dense-core plaque. Through this prior visualization, we subsequently performed the hyperspectral spontaneous micro-Raman mapping to differentiate WT 12 month old, and Tg (6 and 12 month old) mice by PCA. In this sense, we demonstrated the difference between the groups of mice based on lipid, protein and amide I vibrational modes. The main difference between Tg6 and Tg12 is given by the vibrational modes attributed to lipid. High spatial resolution Raman mapping showed cholesterol with the pool of lipids that comprise the halo around the dense-core amyloid plaque, in addition to sphingomyelin. The detailed images of the lipid halo are morphologically related to dystrophic neurites observed surrounding amyloid plaques by immunofluorescence, according to the literature.8,10,66 Frequency specific PCA suggests that the plaque-related neurodegeneration is the main change captured by RS, the main difference being seen in vibrational modes related to cholesterol grouping around the plaque core.As we have shown, Raman imaging is a powerful tool for the characterization of dense-core plaques and their relevance in AD-related histological changes. The technique captures details such as the nuclei of the cells around the lipid halo and the dense-core amyloid plaque, without a staining procedure. Interestingly, the cell nuclei surrounding the lipid halo present different intensities and morphology in comparison to neuron nuclei of the gyrus dentatus. These results suggest that they may be glial cells, but further studies must be performed to confirm this assumption.
Methods
Transgenic animal models of AD
Double transgenic (Tg) mice APPswePS1ΔE9 used in this study were purchased from Jackson Laboratory. These are double transgenic mice that express a chimeric mouse/human amyloid precursor protein (Mo/HuAPP695swe) and a mutant human presenilin 1 (PS1ΔE9) protein. The Swedish FAD mutation comprises K595N/M596L and Delta E9 mutation is the human presenilin with the deletion of exon 9, both associated with early-onset AD. These Tg mice show early Aβ deposition in the brain starting at the age of 4 months.67 Our investigation was in accordance with the Guide for the Care and Use of Laboratory Animals and approved by the Ethics Committee for Animal Utilization in Research (CEUA) of the Federal University of Minas Gerais (protocol 225/2014), under the criteria of the National Animal Experimentation Control Council (CONCEA).Tissue preparation
6-month-old Tg mice (Tg6, n = 3), 12-month-old Tg mice (Tg12, n = 3), and a 12-month C57BL/6 littermate controls (WT, n = 1) were anesthetized (i.p.) with ketamine (80 mg kg−1) and xylazine (8 mg kg−1) and intracardially perfused with ice-cold phosphate-buffered saline (PBS) followed by 4% paraformaldehyde (PFA) in PBS (pH 7.4). Then, their brains were removed and kept overnight in 4% PFA, and subsequently moved to a 30% sucrose solution. The brains were then embedded in the Optimal Cutting Temperature (OCT) compound (Fisher Healthcare) to obtain frozen sections (30 μm) on a cryostat. Raman spectroscopy studies have already proven that OCT does not contaminate the brain tissue.68,69 Sequential tissue sections were washed three times for 15 minutes with PBS to move the OCT compound completely, avoiding spectral interference.Thioflavin S staining
After spectroscopy analysis tissue sections were stained using 0.05% thioflavin S (w/v) in 50% ethanol (v/v) (Sigma-Aldrich). Samples were stained for 8 minutes in ThioS solution, immediately dipped three times in 50% ethanol, and washed with PBS. Subsequently, the slices were seeded directly on coverslips for fluorescence imaging.Two-photon-excited fluorescence
Two-photon-excited fluorescence (TPEF) microscopy was performed in a modified inverted Nikon laser scanning microscope (Lavision Biotech) with an 80 MHz, 5–6 picosecond laser (APE PicoEmerald). ThioS was excited at 830 nm, and a GaAsP photomultiplier collected the emission after passing through a bandpass filter at 525/40 nm. Images were obtained using objective Nikon Plan Apo 20×/NA 0.75 air, and 60×/NA 1.40 oil immersion.Spontaneous (conventional) micro-Raman spectroscopy
A commercial confocal Raman spectrometer equipped with a microscope (WITec Alpha 300 SAR) was used for hyperspectroscopy map acquisition. All measurements were performed with 532 nm laser excitation, 25 mW focused on the sample with an objective Nikon PlanApo 20×/NA 0.75 air, and 60×/NA 1.40 oil immersion. Data were collected with 0.2 s dwell time per pixel, spectral range from 0 to 3800 cm−1 and steps ranging between 0.25 μm and 0.35 μm. Regions of the hippocampal (dentate gyrus – DG, pyramidal cells of CA3 and CA1) were selected for hyperspectral scanning. The confocal Raman microscope used in this work shows a spectral resolution of 3.5 cm−1, and the equipment can reach lateral resolutions comparable to the Rayleigh criterion expressed by the formula 0.61 × λ/NA, obtained without deconvolution.70,71Stimulated micro-Raman scattering microscopy
Stimulated Raman scattering (SRS) microscopy was performed with an inverted microscope (Nikon Eclipse), coupled to a laser scanning system (Lavision Biotech), with the light being focused on the sample with Nikon Plan Apo 60×/NA 1.40 oil immersion objective. A picoEMERALD laser supplied a synchronized pulsed pump (with 5–6 ps pulse width, 80 MHz repetition rate, and tunable wavelength between 750–950 nm) and the Stokes beams (7 ps pulse width, 80 MHz repetition rate, and with fixed wavelength at 1064 nm). The Stokes beam was modulated at 10 MHz using an electro-optical modulator. The pump and Stokes power after the microscope objective were 40 mW and 100 mW, respectively. SRS images were acquired at 5 s per frame with 1000 × 1000 pixels, dwell time was ∼4.7 μs per pixel, ∼50 s was needed for 10 acquisitions, for lipid measurement (2850 cm−1), for amide I (1670 cm−1), we used 50 acquisitions at ∼4.2 min per image. The spectral resolution for the SRS measurement is ∼5 cm−1. The spatial resolution of SRS can be given by , where λp denotes the pump wavelength of the SRS excitation laser, NA is the numerical aperture of the objective, and the factor of √2 in the denominator comes from the fact that SRS is a multiphoton technique as shown in Yali et al.72 In our experiments we used a pump wavelength (λp) of 816 nm for lipids, and 903 nm for amide I, therefore the spatial resolution for lipids is expected to be ∼250 nm, and for amide I, ∼280 nm. In our setup, the resolution was better than 0.3 μm. Transmission of the forward-moving pump and Stokes beams after passing through the sample was collected by a condenser. A bandpass filter (850/310, Semrock) was used to block the Stokes beam completely and transmit the pump beam only onto a large area Si photodiode for the detection of the stimulated Raman loss signal. The output current from the photodiode was terminated, filtered, and demodulated by a lock-in amplifier at 10 MHz to ensure shot-noise-limited detection sensitivity.
Data analysis
The hyperspectral images were generated using the Project FIVE 5.0 software after data pre-processing, where the intensities within the selected spectral ranges are displayed. We measured nine plaques of Tg6, and nine plaques of Tg12 mice (three per animal). The hyperspectral Raman images with higher definition and resolution and accumulation times were selected for the PCA analysis, as described below. The SRS and fluorescence images were edited using ImageJ software. Before applying the PCA, all spectra were subjected to pre-processing, which consisted of removing baseline and spikes from cosmic rays. Spectra with anomalies not related to the cosmic ray or the baseline were removed from the data set. Cosmic rays were identified using a method based on a discrete wavelet transform with four levels of decomposition.73 After identification, the spikes were removed using weighted linear interpolation. The same method used to identify cosmic ray spikes was used to identify anomalous peaks in the spectra. In this case, the spectrum received a tag to avoid being considered in the analysis. To remove the baseline from the spectra, the asymmetric least-squares (ALS) method74 was used. The desired parameters were obtained by an optimization process, to obtain the best parameters for the smoothing parameter (λ = 6) and asymmetry (p = 0.01). All analyses were performed on a DELL EMC PowerEdge R540 machine with two Intel Xeon Silver 4116 processors with 256 GB RAM running the RStudio program.Principal component analysis (PCA)
Principal component analysis (PCA) was performed on a data set composed of a wild type (WT) hyperspectral map with 277![[thin space (1/6-em)]](https://www.rsc.org/images/entities/char_2009.gif) 636 spectra, four Tg6 maps with 375463 spectra and four Tg12 maps with 245568 spectra in total. All three data sets (WT, Tg6 and Tg12) were combined to build a single one that was used to perform PCA analysis. Four analysis sets were made: one using the entire spectrum (between 300 cm−1 and 3800 cm−1), and three analyses using different regions (between 350 cm−1 and 1750 cm−1, and between 2670 cm−1 and 3650 cm−1) and their combinations. Of the eighteen scanned plaques, the PCA could process only eight (four Tg6 and four Tg12 plaques) due to artifacts and noise in the source files. More technical details are given in the ESI.†
636 spectra, four Tg6 maps with 375463 spectra and four Tg12 maps with 245568 spectra in total. All three data sets (WT, Tg6 and Tg12) were combined to build a single one that was used to perform PCA analysis. Four analysis sets were made: one using the entire spectrum (between 300 cm−1 and 3800 cm−1), and three analyses using different regions (between 350 cm−1 and 1750 cm−1, and between 2670 cm−1 and 3650 cm−1) and their combinations. Of the eighteen scanned plaques, the PCA could process only eight (four Tg6 and four Tg12 plaques) due to artifacts and noise in the source files. More technical details are given in the ESI.†
Cluster maps
For each analyzed region, a cluster analysis (K-means) of the first principal component (PC1) was performed, PC1 represents between 45% and 85% of the data variance, depending on the region analyzed. After those analyses, a set of frequencies (420, 702, 721, 763, 876, 1007, 1104, 1233, 1267, 1295, 1428, 1437, 1464, 1670, 2850, 2930 and 3070 cm−1), representative of the possible differences between the samples, was chosen. These values were analyzed individually as central points of intervals of approximately 10 cm−1. After analyzing each frequency individually, PCA analysis was performed using all frequencies together. More technical details are given in the ESI.†Author contributions
E. A. F. helped in designing the research, performed data acquisition, interpreted the data and wrote the paper. L. L. performed SRS and two-photon spectroscopy measurements. J. C. performed PCA. M. A. R. S. contributed to the establishment of the colony of mice and project design. R. C., A. B. and R. V. contributed to the scientific interpretation of the data and significantly revised the article. L. M. M. and A. J. were responsible for the conception and design of the work and significantly revised the article. All authors read and approved the submitted version of the article.Conflicts of interest
The authors declare no competing interest.Acknowledgements
We acknowledge financial support from FINEP (01.13.0330.00), CAPES, Fapemig (TEC - RED-00282-16, APQ-03052-15), and CNPq (project 302775/2018-8). We thanks the Tecgraf Institute of PUC-Rio,“www.tecgraf.puc-rio.br”, for providing the computational infrastructure that were used in the data analysis.References
- R. A. Stelzmann, H. N. Schnitzlein and F. R. Murtagh, Clin. Anat., 1995, 8, 429–431 CrossRef PubMed.
- J. Tsai, J. Grutzendler, K. Duff and W.-B. Gan, Nat. Neurosci., 2004, 7, 1181–1183 CrossRef CAS PubMed.
- M. Ahmed, J. Davis, D. Aucoin, T. Sato, S. Ahuja, S. Aimoto, J. I. Elliott, W. E. Van Nostrand and S. O. Smith, Nat. Struct. Mol. Biol., 2010, 17, 561–567 CrossRef CAS PubMed.
- D. J. Selkoe and J. Hardy, EMBO Mol. Med., 2016, 8, 595–608 CrossRef CAS PubMed.
- R. Adalbert, A. Nogradi, E. Babetto, L. Janeckova, S. A. Walker, M. Kerschensteiner, T. Misgeld and M. P. Coleman, Brain, 2009, 132, 402–416 CrossRef PubMed.
- P. A. Adlard and J. C. Vickers, Acta Neuropathol., 2002, 103, 377–383 CrossRef CAS PubMed.
- J. Grutzendler, K. Helmin, J. Tsai and W. B. Gan, Ann. N. Y. Acad. Sci., 2007, 1097, 30–39 CrossRef PubMed.
- K. R. Sadleir, P. C. Kandalepas, V. Buggia-Prévot, D. A. Nicholson, G. Thinakaran and R. Vassar, Acta Neuropathol., 2016, 132, 235–256 CrossRef CAS PubMed.
- T. L. Spires, M. Meyer-Luehmann, E. A. Stern, P. J. McLean, J. Skoch, P. T. Nguyen, B. J. Bacskai and B. T. Hyman, J. Neurosci., 2005, 25, 7278–7287 CrossRef CAS PubMed.
- C. Condello, P. Yuan, A. Schain and J. Grutzendler, Nat. Commun., 2015, 6, 6176 CrossRef CAS PubMed.
- Z. Liu, C. Condello, A. Schain, R. Harb and J. Grutzendler, J. Neurosci., 2010, 30, 17091–17101 CrossRef CAS PubMed.
- S. Mandrekar, Q. Jiang, C. Y. D. Lee, J. Koenigsknecht-Talboo, D. M. Holtzman and G. E. Landreth, J. Neurosci., 2009, 29, 4252–4262 CrossRef CAS PubMed.
- A. Gomez-Arboledas, J. C. Davila, E. Sanchez-Mejias, V. Navarro, C. Nuñez-Diaz, R. Sanchez-Varo, M. V. Sanchez-Mico, L. Trujillo-Estrada, J. J. Fernandez-Valenzuela, M. Vizuete, J. X. Comella, E. Galea, J. Vitorica and A. Gutierrez, Glia, 2018, 66, 637–653 CrossRef PubMed.
- R. E. González-Reyes, M. O. Nava-Mesa, K. Vargas-Sánchez, D. Ariza-Salamanca and L. Mora-Muñoz, Front. Mol. Neurosci., 2017, 10, 1–20 Search PubMed.
- A. Serrano-Pozo, A. Muzikansky, T. Gómez-Isla, J. H. Growdon, R. A. Betensky, M. P. Frosch and B. T. Hyman, J. Neuropathol. Exp. Neurol., 2013, 72, 462–471 CrossRef CAS PubMed.
- J. C. Vickers, D. Chin, A. M. Edwards, V. Sampson, C. Harper and J. Morrison, Exp. Neurol., 1996, 141, 1–11 CrossRef CAS PubMed.
- A. Woodhouse, J. C. Vickers, P. A. Adlard and T. C. Dickson, Neurobiol. Aging, 2009, 30, 864–874 CrossRef CAS PubMed.
- P. Yuan, C. Condello, C. D. Keene, Y. Wang, T. D. Bird, S. M. Paul, W. Luo, M. Colonna, D. Baddeley and J. Grutzendler, Neuron, 2016, 90, 724–739 CrossRef CAS PubMed.
- S. H. Baik, S. Kang, S. M. Son and I. Mook-Jung, Glia, 2016, 64, 2274–2290 CrossRef PubMed.
- S. Duraipandian, M. S. Bergholt, W. Zheng, K. Y. Ho, M. Teh, K. G. Yeoh, J. B. Y. So, A. Shabbir and Z. Huang, J. Biomed. Opt., 2012, 17, 1–9 CrossRef PubMed.
- E. A. Fonseca, L. Lafetá, R. Cunha, H. Miranda, J. Campos, H. G. Medeiros, M. A. Romano-Silva, R. A. Silva, A. S. Barbosa, R. P. Vieira, L. M. Malard and A. Jorio, Analyst, 2019, 144, 7049–7056 RSC.
- S. Kaminaka, T. Ito, H. Yamazaki, E. Kohda and H.-O. Hamaguchi, J. Raman Spectrosc., 2002, 33, 498–502 CrossRef CAS.
- F. M. Lyng, I. R. M. Ramos, O. Ibrahim and H. J. Byrne, Appl. Sci., 2015, 5, 23–35 CrossRef.
- K. M. Marzec, A. Rygula, M. Gasior-Glogowska, K. Kochan, K. Czamara, K. Bulat, K. Malek, A. Kaczor and M. Baranska, Pharmacol. Rep., 2015, 67, 744–750 CrossRef CAS PubMed.
- M. A. Short, S. Lam, A. McWilliams, J. Zhao, H. Lui and H. Zeng, Opt. Lett., 2008, 33, 711–713 CrossRef CAS PubMed.
- H. J. Butler, L. Ashton, B. Bird, G. Cinque, K. Curtis, J. Dorney, K. Esmonde-White, N. J. Fullwood, B. Gardner, P. L. Martin-Hirsch, M. J. Walsh, M. R. McAinsh, N. Stone and F. L. Martin, Nat. Protoc., 2016, 11, 664–687 CrossRef CAS PubMed.
- T. W. Bocklitz, S. Guo, O. Ryabchykov, N. Vogler and J. Popp, Anal. Chem., 2016, 88, 133–151 CrossRef CAS PubMed.
- M. Ji, M. Arbel, L. Zhang, C. W. Freudiger, S. S. Hou, D. Lin, X. Yang, B. J. Bacskai and X. S. Xie, Sci. Adv., 2018, 4, EAAT7715 CrossRef CAS PubMed.
- M. Rak, M. R. Del Bigio, S. Mai, D. Westaway and K. Gough, Biopolymers, 2007, 87, 207–217 CrossRef CAS PubMed.
- Z. Kristofiková, V. Jr. Kopecký, K. Hofbauerová, P. Hovorková and D. Rípová, Neurochem. Res., 2008, 33, 412–421 CrossRef PubMed.
- T. Pazderka and V. Kopecký, Spectrochim. Acta, Part A, 2017, 185, 207–216 CrossRef CAS PubMed.
- J. Dong, C. S. Atwood, V. E. Anderson, S. L. Siedlak, M. A. Smith, G. Perry and P. R. Carey, Biochemistry, 2003, 42, 2768–2773 CrossRef CAS PubMed.
- P. Chen, A. Shen, W. Zhao, S.-J. Baek, H. Yuan and J. Hu, Appl. Opt., 2009, 48, 4743–4748 CrossRef CAS PubMed.
- K. L. Summers, N. Fimognari, A. Hollings, M. Kiernan, V. Lam, R. J. Tidy, D. Paterson, M. J. Tobin, R. Takechi, G. N. George, I. J. Pickering, J. C. Mamo, H. H. Harris and M. J. Hackett, Biochemistry, 2017, 56, 4107–4116 CrossRef CAS PubMed.
- R. Michael, A. Lenferink, G. F. J. M. Vrensen, E. Gelpi, R. I. Barraquer and C. Otto, Sci. Rep., 2017, 7, 1–11 CrossRef CAS PubMed.
- F. Palombo, F. Tamagnini, J. C. G. Jeynes, S. Mattana, I. Swift, J. Nallala, J. Hancock, J. T. Brown, A. D. Randall and N. Stone, Analyst, 2018, 143, 850–857 RSC.
- M. Z. Kastyak-Ibrahim, M. J. Nasse, M. Rak, C. Hirschmugl, M. R. Del Bigio, B. C. Albensi and K. M. Gough, NeuroImage, 2012, 60, 376–383 CrossRef CAS PubMed.
- C. R. Liao, M. Rak, J. Lund, M. Unger, E. Platt, B. C. Albensi, C. J. Hirschmugl and K. M. Gough, Analyst, 2013, 138, 3991–3997 RSC.
- D. Röhr, B. D. C. Boon, M. Schuler, K. Kremer, J. J. M. Hoozemans, F. H. Bouwman, S. F. El-Mashtoly, A. Nabers, F. Großerueschkamp, A. J. M. Rozemuller and K. Gerwert, Acta Neuropathol. Commun., 2020, 8, 222 CrossRef PubMed.
- B. Lochocki, T. H. J. Morrema, F. Ariese, J. J. M. Hoozemans and J. F. de Boer, Analyst, 2020, 145, 1724–1736 RSC.
- N. Benseny-Cases, O. Klementieva, M. Cotte, I. Ferrer and J. Cladera, Anal. Chem., 2014, 86, 12047–12054 CrossRef CAS PubMed.
- R. M. Koffie, M. Meyer-Luehmann, T. Hashimoto, K. W. Adams, M. L. Mielke, M. Garcia-Alloza, K. D. Micheva, S. J. Smith, M. L. Kim, V. M. Lee, B. T. Hyman and T. L. Spires-Jones, Proc. Natl. Acad. Sci. U. S. A., 2009, 106, 4012–4017 CrossRef CAS PubMed.
- W. E. Klunk, B. J. Bacskai, C. A. Mathis, S. T. Kajdasz, M. E. McLellan, M. P. Frosch, M. L. Debnath, D. P. Holt, Y. Wang and B. T. Hyman, J. Neuropathol. Exp. Neurol., 2002, 61, 797–805 CrossRef CAS PubMed.
- A. D. Cohen, M. D. Ikonomovic, E. E. Abrahamson, W. R. Paljug, S. T. DeKosky, I. M. Lefterov, R. P. Koldamova, L. Shao, M. L. Debnath, C. A. Mason, N. S. Mathis and W. E. Klunk, Lett. Drug Des. Discovery, 2009, 6, 437–444 CrossRef CAS PubMed.
- F. Yang, G. P. Lim, A. N. Begum, L. J. Ubeda, M. R. Simmons, S. S. Ambegaokar, P. P. Chen, R. Kayed, C. G. Glabe, S. A. Frautschy and G. M. Cole, J. Biol. Chem., 2005, 280, 5892–5901 CrossRef CAS PubMed.
- R. Cunha, L. Lafetá, E. A. Fonseca, A. Barbosa, M. A. Romano-Silva, R. Vieira, A. Jorio and L. Malard, Analyst, 2021, 146, 2945–2954 RSC.
- M. Boutajangout, A. Authelet, V. Blanchard, N. Touchet, G. Tremp, L. Pradier and J. Brion, Neurobiol. Dis., 2004, 15, 47–60 CrossRef PubMed.
- B. Caughey and P. T. Lansbury, Annu. Rev. Neurosci., 2003, 26, 267–298 CrossRef CAS PubMed.
- T. C. Dickson, C. E. King, G. H. McCormack and J. C. Vickers, Exp. Neurol., 1999, 156, 100–110 CrossRef CAS PubMed.
- C. G. Glabe, Neurobiol. Aging, 2006, 27, 570–575 CrossRef CAS PubMed.
- I. C. Martins, I. Kuperstein, H. Wilkinson, E. Maes, M. Vanbrabant, W. Jonckheere, P. Van Gelder, D. Hartmann, R. D'Hooge, B. De Strooper, J. Schymkowitz and F. Rousseau, EMBO J., 2008, 27, 224–233 CrossRef CAS PubMed.
- P. Sacré, C. De Bleye, P.-F. Chavez, L. Netchacovitch, P. Hubert and E. Ziemons, J. Pharm. Biomed. Anal., 2014, 101, 123–140 CrossRef PubMed.
- P. Gamba, G. Testa, S. Gargiulo, E. Staurenghi, G. Poli and G. Leonarduzzi, Front. Aging Neurosci., 2015, 7, 119 Search PubMed.
- A. Lazar, C. Bich, M. Panchal, N. Desbenoit, V. Petit, D. Touboul, L. Dauphinot, C. Marquer, O. Laprévote, A. Brunelle and C. Duyckaerts, Acta Neuropathol., 2013, 125, 133–144 CrossRef CAS PubMed.
- T. Lebouvier, C. Perruchini, M. Panchal, M. Potier and C. Duyckaerts, Acta Neuropathol., 2009, 117, 31–34 CrossRef CAS PubMed.
- W. G. Wood, L. Li, W. E. Müller and G. P. Eckert, J. Neurochem., 2014, 129, 559–572 CrossRef CAS PubMed.
- M. Panchal, J. Loeper, J. C. Cossec, C. Perruchini, A. Lazar, D. Pompon and C. Duyckaerts, J. Lipid Res., 2010, 51, 598–605 CrossRef CAS PubMed.
- J. K. Yao, T. M. Wengenack, G. L. Curran and J. F. Poduslo, Neurochem. Res., 2009, 34, 102–108 CrossRef CAS PubMed.
- W. Michno, I. Kaya, S. Nyström, L. Guerard, K. P. R. Nilsson, P. Hammarström, K. Blennow, H. Zetterberg and J. Hanrieder, Anal. Chem., 2018, 90, 8130–8138 CrossRef CAS PubMed.
- Oligodendroglia, ed. W. Norton, Springer US, 1st edn, 1984 Search PubMed.
- M. O. W. Grimm, J. Mett, H. S. Grimm and T. Hartmann, Front. Mol. Neurosci., 2017, 10, 63 Search PubMed.
- E. Posse De Chaves and S. Sipione, FEBS Lett., 2010, 584, 1748–1759 CrossRef CAS PubMed.
- P. Giannakopoulos, F. R. Herrmann, T. Bussière, C. Bouras, E. Kövari, D. P. Perl, J. H. Morrison, G. Gold and P. R. Hof, Neurology, 2003, 60, 1495–1500 CrossRef CAS PubMed.
- G. D. Rabinovici, A. J. Furst, A. Alkalay, C. A. Racine, J. P. O'Neil, M. Janabi, S. L. Baker, N. Agarwal, S. J. Bonasera, E. C. Mormino, M. W. Weiner, M. L. Gorno-Tempini, H. J. Rosen, B. L. Miller and W. J. Jagust, Brain, 2010, 133, 512–528 CrossRef PubMed.
- T. C. Dickson and J. C. Vickers, Neuroscience, 2001, 105, 99–107 CrossRef CAS PubMed.
- C. Condello, A. Schain and J. Grutzendler, Sci. Rep., 2011, 1, 19 CrossRef CAS PubMed.
- M. Garcia-Alloza, E. M. Robbins, S. X. Zhang-Nunes, S. M. Purcell, R. A. Betensky, S. Raju, C. Prada, S. M. Greenberg, B. J. Bacskai and M. P. Frosch, Neurobiol. Dis., 2006, 24, 516–524 CrossRef CAS PubMed.
- M. G. Shim and B. C. Wilson, Photochem. Photobiol., 1996, 63, 662–671 CrossRef CAS PubMed.
- M. J. Hackett, J. A. McQuillan, F. El-Assaad, J. B. Aitken and A. Levina, Analyst, 2011, 136, 2941–2952 RSC.
- M. Hedegaard, C. Matthäus, S. Hassing, C. Krafft, M. Diem and J. Popp, Theor. Chem. Acc., 2011, 130, 1249–1260 Search PubMed.
- Y. Kim, E. J. Lee, S. Roy, A. S. Sharbirin, L. G. Ranz, T. Dieing and L. Kim, Curr. Appl. Phys., 2020, 20, 71–77 CrossRef.
- B. Yali, C. Yang, Y. Chen, Y. Shuai and Y. Guang, Light: Sci. Appl., 2018, 7, 81 CrossRef PubMed.
- A. Maury and R. I. Revilla, Appl. Spectrosc., 2015, 69, 984–992 CrossRef CAS PubMed.
- P. H. C. Eilers and H. F. Boelens, Baseline correction with aysmmetric least squares smoothing, Leiden university medical centre technical report, 2005 Search PubMed.
Footnotes |
| † Electronic supplementary information (ESI) available: Table of the molecular vibrational frequencies and assignments; hyperspectral images of 6 and 12 month old AD mice; technical information about PCA. See DOI: 10.1039/d1an01078f |
| ‡ These authors contributed equally to this work. |
| This journal is © The Royal Society of Chemistry 2021 |