 Open Access Article
Creative Commons Attribution 3.0 Unported Licence
Temperature dependence of acoustic vibrations of CdSe and CdSe–CdS core–shell nanocrystals measured by low-frequency Raman spectroscopy†
A. Jolene
Mork
,
Elizabeth M. Y.
Lee
and
William A.
Tisdale
 *
*
Department of Chemical Engineering, Massachusetts Institute of Technology, Cambridge, MA 02139, USA. E-mail: tisdale@mit.edu
First published on 5th October 2016
Abstract
We measure the temperature dependence of breathing-mode acoustic vibrations of semiconductor nanocrystals using low-frequency Raman spectroscopy. In CdSe core-only nanocrystals, the lowest-energy ![[small script l]](https://www.rsc.org/images/entities/char_e146.gif) = 0 mode red-shifts with increasing temperature by ∼5% between 77–300 K. Changes to the interatomic bond distances in the inorganic crystal lattice, with corresponding changes to the bulk modulus and density of the material, contribute to the observed energy shift but do not fully explain its magnitude across all nanocrystal sizes. Invariance of the Raman linewidth over the same temperature range suggests that the acoustic breathing mode is inhomogeneously broadened. The acoustic phonons of CdSe/CdS core–shell composite nanocrystals display similar qualitative behavior. However, for large core–shell nanocrystals, we observe a higher-order Raman peak at approximately twice the energy of the
= 0 mode red-shifts with increasing temperature by ∼5% between 77–300 K. Changes to the interatomic bond distances in the inorganic crystal lattice, with corresponding changes to the bulk modulus and density of the material, contribute to the observed energy shift but do not fully explain its magnitude across all nanocrystal sizes. Invariance of the Raman linewidth over the same temperature range suggests that the acoustic breathing mode is inhomogeneously broadened. The acoustic phonons of CdSe/CdS core–shell composite nanocrystals display similar qualitative behavior. However, for large core–shell nanocrystals, we observe a higher-order Raman peak at approximately twice the energy of the ![[small script l]](https://www.rsc.org/images/entities/char_e146.gif) = 0 mode, which we identify as a higher spherical harmonic—the n = 2,
= 0 mode, which we identify as a higher spherical harmonic—the n = 2, ![[small script l]](https://www.rsc.org/images/entities/char_e146.gif) = 0 eigenmode—rather than a two-phonon scattering event.
= 0 eigenmode—rather than a two-phonon scattering event.
1. Introduction
Semiconductor nanocrystals, commonly known as quantum dots (QDs), are highly tunable, quantum-confined materials with solid-state applications ranging from TVs to solar cells.1,2 The myriad of applications of these materials stem from the small size of the semiconductor, where excited states are confined to occupy a finite volume and therefore allow only certain discrete energies, yielding a well-defined band-edge transition energy. The optical properties of QDs are not their only size-dependent feature, however; the acoustic phonons confined to the volume of a nanocrystal also exhibit highly size-dependent energies, with phonon frequency roughly inversely proportional to QD radius.3 These acoustic phonons are known to play a role in QD thermalization,4 exciton decoherence and dephasing,5,6 and non-radiative relaxation processes,7 among others. While several studies have examined how size3 and polydispersity8 play a role in the acoustic phonon energies, there has been little work targeted towards understanding how these phonon modes shift in energy as a function of temperature and what those dependencies reveal about the nature of the phonon modes themselves.Temperature dependent frequency shifts and peak widths have been extensively studied for optical phonons in bulk crystals9–11 and nanocrystals,12–18 and are modeled using bond anharmonicity models. In particular, the longitudinal optical (LO) phonon has been shown to redshift in energy and broaden in linewidth with increasing temperature in CdSe nanocrystals,12–18 but the temperature dependence of the acoustic phonons have received little attention. Results in ZnO nanocrystals at high temperatures (300–700 K) suggest that a simple anharmonic phonon–phonon decay mechanism cannot fully explain the observed temperature dependence of the energies and linewidths of acoustic phonon modes.19 Temperature-dependent measurements of acoustic phonons in other nanocrystal materials systems are lacking, in spite of their relevance to low-temperature photoluminescence studies.20–22
Here we use low-frequency Raman spectroscopy to measure the temperature dependence of the acoustic phonons in several sizes of colloidally synthesized CdSe nanocrystals, as well as core–shell structures. Beyond the expected inverse size effect of the Raman-active acoustic phonons, the size- and temperature-dependent data reveal that changes to the crystal lattice of the inorganic core alone cannot fully explain the observed trends. Additionally, for CdSe/CdS core–shell nanocrystals, low-temperature Raman spectra reveal that higher order Raman features are the higher spherical harmonics of the fundamental breathing mode rather than multiphonon features.
2. Experimental details
2.1 Synthesis of colloidal nanocrystals
Colloidal QDs of various sizes were synthesized using a hot-injection method derived from Peng and Peng.23 120 mg of CdO and 512 mg of n-octadecylphosphonic acid (ODPA) were added to 5.8 g of trioctylphosphine oxide (TOPO) in a 50 mL 3-neck round-bottom flask. These reagents were heated to 120 °C and degassed under vacuum for 1.5 hours, then heated to 300 °C under nitrogen until the brown suspension became a clear solution. At this point, 1.5 mL of trioctylphosphine (TOP) were injected into the flask, and the temperature was raised to 360 °C. When the solution reached this temperature, 0.9 mL of 1.7 M TOP–Se were swiftly injected into the flask with vigorous stirring. 1.5 mL aliquots were withdrawn from the reaction mixture approximately every 30 seconds after injection in order to obtain a size series of QDs. These aliquots were dissolved in 2 mL hexanes, and purified twice by precipitation with acetone and resuspension in hexanes. The resulting nanocrystals were stored in ambient conditions as a hexanes suspension before use.2.2 Synthesis of core–shell nanocrystals
CdSe/CdS core–shell nanocrystals were synthesized according to Coropceanu and Bawendi,24 with an initial wurtzite core of 1.6 nm in radius and a final radius after shell addition of 5.3 nm. Heteronanocrystals were purified by repeated precipitation with acetone and resuspension in hexanes. The purified nanocrystals were stored in hexanes under ambient conditions before use.2.3 Low-temperature Raman spectroscopy
QD samples for Raman spectroscopy were drop cast from the stock solution to create optically dense thin films on single crystal quartz substrates. After drying in air, the samples were loaded into a ST-500 microscopy cryostat (Janis Research) and kept under vacuum for at least 12 hours before cooling with a cryogenic liquid (nitrogen or helium). Low-frequency non-resonant Raman spectra were acquired with a wavelength-stabilized 785 nm diode laser (Ondax), which, after passing several amplified spontaneous emission filters, reached the sample through a 40× 0.6 NA objective with a power density of about 1.8 mW μm−2. Scattered light was collected in a back-scattering geometry, and Rayleigh-scattered light was filtered with two sequential notch filters (Ondax) which, combined, resulted in eight orders of magnitude Rayleigh suppression. Raman spectra were imaged using a 0.5 m focal length spectrograph with 1200 g mm−1 dispersion grating and a Peltier-cooled CCD camera (Princeton Instruments). The overall resolution of the instrument was 0.44 cm−1. Each spectrum represents the average of three spectra acquired for 90 seconds. At least five minutes elapsed between measurements at different temperatures in order to ensure temperature stabilization before each measurement.3. Results and discussion
3.1 CdSe core-only QDs
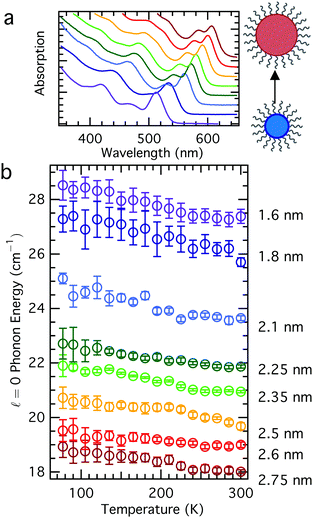
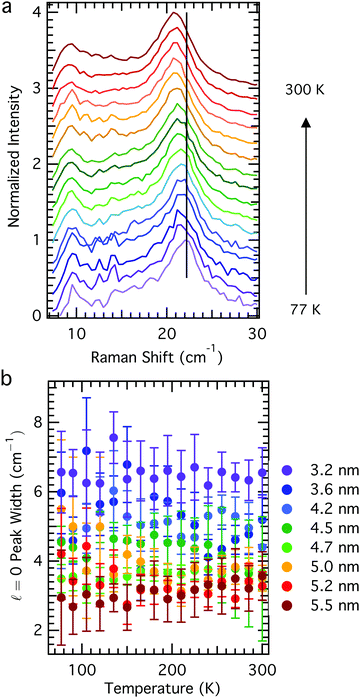
In order to understand how the acoustic phonon energies of QDs vary as a function of temperature, we synthesized a series of colloidal QDs according to Peng and Peng,23 where aliquots were removed at various reaction times in order to achieve an array of sizes. These aliquots were purified by precipitation, and all samples were treated the same in order to minimize sample-to-sample differences that might result from, for example, different ligand coverage on different QD samples.25,26 The Raman spectra of these samples all reveal the same trend: a phonon mode softening (redshift) with increasing temperature (Fig. 1) without concomitant change in the phonon linewidth (Fig. 2). For LO phonons in nanocrystals, the phonon linewidth is typically decomposed into a temperature-dependent contribution and a temperature independent contribution, resulting from an intrinsic zone-center phonon linewidth derived from its lifetime and a phonon-confinement effect broadening, respectively.12 Acoustic phonons, unlike optical phonons, have no linewidth contribution from the sampling of a larger region of the Brillioun zone due to the phonon confinement effect; rather, their homogeneous linewidth results from their lifetime and damping with the environment. The nanoparticles studied showed no consistent change in linewidth as a function of temperature, and in general had nearly temperature independent linewidth, within the error of the measurement (Fig. 2b). This suggests that inhomogenous contributions to the linewidth from, for example, many different sizes of QDs (QD sample had polydispersity ≤10%) or strong environmental damping, dominate contributions to the acoustic phonon linewidth in these materials. As can be seen in Fig. 2b, the linewidth in general decreases with increasing particle size, consistent with predictions based on environmental damping.27,28 However, this same trend can also be explained by sample polydispersity; QD batches having smaller average diameter tend to have greater size dispersity.29Acoustic phonon modes in CdSe QDs have been frequently understood using the elastic sphere model, first described by Lamb,30 which yields phonon energies inversely proportional to the QD size. Though the modes with angular momentum number ![[small script l]](https://www.rsc.org/images/entities/char_e146.gif) = 0 and
= 0 and ![[small script l]](https://www.rsc.org/images/entities/char_e146.gif) = 2 are known to be Raman active,31 this study focuses on the
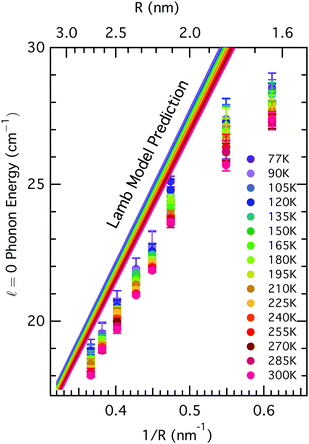
= 2 are known to be Raman active,31 this study focuses on the ![[small script l]](https://www.rsc.org/images/entities/char_e146.gif) = 0 mode for more facile interpretation. The equations governing the vibrations of an elastic sphere are sensitive not only to the size of the material, but also its elastic properties, given by its bulk modulus or transverse and longitudinal sound velocities, and its density. For CdSe, both of these are known to change with temperature: the bulk modulus changes by less than 5% over the temperature range between 77–300 K,32 while the density changes by less than 1% in this range.33 Incorporating these known changes in the physical properties of the CdSe core results in some expected variation in the nanoparticle acoustic phonon frequencies as a function of temperature, but it is insufficient to fully explain the observed trends. In Fig. 3, we compare the temperature-dependent Raman spectra as a function of QD size to the predictions based on Lamb's model after accounting for changes in the bulk modulus and density at various temperatures. The Lamb model consistently over-predicts phonon frequency for a particular size, yet under-predicts the observed variation in phonon frequency for all sizes of nanocrystals over the measured temperature range. The smallest nanocrystals exhibit the greatest deviation from Lamb model calculations both in the absolute value of the phonon energy as well as the temperature-dependent variation (∼2 cm−1 observed variation, compared to 1 cm−1 predicted), suggesting that other factors beyond those traditionally considered in the Lamb model may play a role in defining acoustic phonon frequencies in colloidal nanocrystal films.
= 0 mode for more facile interpretation. The equations governing the vibrations of an elastic sphere are sensitive not only to the size of the material, but also its elastic properties, given by its bulk modulus or transverse and longitudinal sound velocities, and its density. For CdSe, both of these are known to change with temperature: the bulk modulus changes by less than 5% over the temperature range between 77–300 K,32 while the density changes by less than 1% in this range.33 Incorporating these known changes in the physical properties of the CdSe core results in some expected variation in the nanoparticle acoustic phonon frequencies as a function of temperature, but it is insufficient to fully explain the observed trends. In Fig. 3, we compare the temperature-dependent Raman spectra as a function of QD size to the predictions based on Lamb's model after accounting for changes in the bulk modulus and density at various temperatures. The Lamb model consistently over-predicts phonon frequency for a particular size, yet under-predicts the observed variation in phonon frequency for all sizes of nanocrystals over the measured temperature range. The smallest nanocrystals exhibit the greatest deviation from Lamb model calculations both in the absolute value of the phonon energy as well as the temperature-dependent variation (∼2 cm−1 observed variation, compared to 1 cm−1 predicted), suggesting that other factors beyond those traditionally considered in the Lamb model may play a role in defining acoustic phonon frequencies in colloidal nanocrystal films.
We hypothesize that the QD ligands, organic molecules with a significantly different elastic modulus bound to the nanocrystal surface, may play an important role in determining acoustic phonon frequencies in these materials.26 While other models have considered the effect of an elastic medium on the linewidth and acoustic phonon damping,34 these organic ligands have not been explicitly modeled (in part because many studies of acoustic phonons in nanocrystals have focused exclusively on those embedded into glasses). Especially for small nanocrystals, where the surface-to-volume ratio is high and the total core mass is low, the inertial mass of the ligands may significantly affect the vibrational energies sustained within the inorganic core.26,35 While the Lamb model for vibrating elastic spheres predicts much of the variation in eigenmode frequency with particle size, it alone does not fully capture the temperature-dependent behavior of the acoustic modes in nanocrystals and highlights the necessity for models that explicitly account for surface ligands.
3.2 CdSe–CdS core–shell QDs
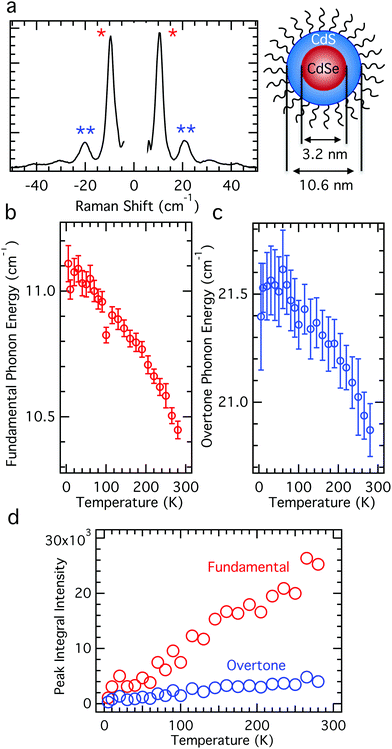
In addition to core-only nanocrystals, we also report on the temperature-dependent behavior of acoustic phonons in the more technologically-relevant core–shell nanostructures. Room temperature Raman spectra of the thick shell CdSe/CdS nanocrystals reveal the fundamental![[small script l]](https://www.rsc.org/images/entities/char_e146.gif) = 0 Raman mode (labelled ω1), as well as a series of higher order modes at higher energies, of which the first is labelled ω2 in Fig. 4a. These phonon features display a similar temperature-dependent redshift in energy as was observed for core-only nanocrystals (Fig. 4b and c), demonstrating again that any model for nanocrystal phonon mode energies must account for sample temperature. Also like the core-only CdSe QDs, the Raman linewidth of the phonon mode shows no variation with sample temperature within the error of the measurement. These data imply that the same fundamental physics govern both core-only and core–shell nanocrystals in the low-temperature regime.
= 0 Raman mode (labelled ω1), as well as a series of higher order modes at higher energies, of which the first is labelled ω2 in Fig. 4a. These phonon features display a similar temperature-dependent redshift in energy as was observed for core-only nanocrystals (Fig. 4b and c), demonstrating again that any model for nanocrystal phonon mode energies must account for sample temperature. Also like the core-only CdSe QDs, the Raman linewidth of the phonon mode shows no variation with sample temperature within the error of the measurement. These data imply that the same fundamental physics govern both core-only and core–shell nanocrystals in the low-temperature regime.
Temperature-dependent Raman spectroscopy reveals the identity of the higher order mode, ω2, allowing discrimination between a two-phonon Raman scattering process and a single eigenmode with approximately twice the energy of the ![[small script l]](https://www.rsc.org/images/entities/char_e146.gif) = 0 fundamental mode (i.e. the n = 2 spheroidal mode). The temperature dependent intensities for the fundamental and second harmonic peaks are plotted between 4 K and 300 K in Fig. 4d. The nearly linear temperature dependence of the ω2 mode characterizes a one-phonon process; a two-phonon Raman scattering process would yield a quadratic dependence on temperature.36 Additionally, from Fig. 4b and c, the temperature dependent energy shift is approximately equivalent for both the ω1 and ω2 modes, while a two-phonon process would have resulted in a 2× larger energy shift with temperature for the second harmonic. From these data, we confidently assign the ω2 mode to single-phonon Raman scattering from the n = 2 eigenmode, as has been observed for silver nanoparticles.37 Other higher order phonon modes are observed in Fig. 4a with energies close to 3ω1 and 4ω1, but these features could not be conclusively assigned due to weak low-temperature signal.
= 0 fundamental mode (i.e. the n = 2 spheroidal mode). The temperature dependent intensities for the fundamental and second harmonic peaks are plotted between 4 K and 300 K in Fig. 4d. The nearly linear temperature dependence of the ω2 mode characterizes a one-phonon process; a two-phonon Raman scattering process would yield a quadratic dependence on temperature.36 Additionally, from Fig. 4b and c, the temperature dependent energy shift is approximately equivalent for both the ω1 and ω2 modes, while a two-phonon process would have resulted in a 2× larger energy shift with temperature for the second harmonic. From these data, we confidently assign the ω2 mode to single-phonon Raman scattering from the n = 2 eigenmode, as has been observed for silver nanoparticles.37 Other higher order phonon modes are observed in Fig. 4a with energies close to 3ω1 and 4ω1, but these features could not be conclusively assigned due to weak low-temperature signal.
4. Conclusions
We collected Raman spectra of CdSe and CdSe/CdS core–shell QDs between cryogenic temperatures and room temperature and monitored the response of the acoustic phonon Raman features. All samples studied exhibited a temperature-dependent mode softening at higher temperatures, consistent with expected changes in the bulk elastic properties and density of the core material, but the magnitude of the temperature-dependent shift suggests that changes to the environment surrounding the inorganic nanocrystal, including the organic surface ligands, may also play a role in determining the QD phonon energies. The negligible change in Raman linewidth over the temperature range studied in both types of nanocrystals likely results from inhomogeneous broadening (for example, due to polydispersity) that greatly exceeds any temperature-dependent change to the homogeneous linewidth derived from the phonon lifetime. Finally, we resolve for the first time the n = 2,![[small script l]](https://www.rsc.org/images/entities/char_e146.gif) = 0 acoustic phonon mode for large CdSe/CdS core–shell nanoparticles.
= 0 acoustic phonon mode for large CdSe/CdS core–shell nanoparticles.
Acknowledgements
This work was supported by Eni S.p.A. under the Eni-MIT Solar Frontiers Center.Notes and references
- K. Bourzac, Nature, 2013, 493, 283 CrossRef CAS PubMed.
- P. V. Kamat, J. Phys. Chem. C, 2008, 18737–18753 CAS.
- L. Saviot, B. Champagnon, E. Duval, I. A. Kudriavtsev and A. I. Ekimov, J. Non-Cryst. Solids, 1996, 197, 238–246 CrossRef CAS.
- D. Hannah, N. Dunn, S. Ithurria, D. Talapin, L. Chen, M. Pelton, G. Schatz and R. Schaller, Phys. Rev. Lett., 2011, 107, 13–16 Search PubMed.
- S. Dong, D. Trivedi, S. Chakrabortty, T. Kobayashi, Y. Chan, O. V. Prezhdo and Z. H. Loh, Nano Lett., 2015, 15, 6875–6882 CrossRef PubMed.
- A. P. Alivisatos, J. Phys. Chem., 1996, 100, 13226–13239 CrossRef CAS.
- D. Bozyigit, N. Yazdani, M. Yarema, O. Yarema, W. M. M. Lin, S. Volk, K. Vuttivorakulchai, M. Luisier, F. Juranyi and V. Wood, Nature, 2016, 531, 618–622 CrossRef CAS PubMed.
- M. Ivanda, K. Furić, S. Musić, M. Ristić, M. Gotić, D. Ristić, A. M. Tonejc, I. Djerdj, M. Mattarelli, M. Montagna, F. Rossi, M. Ferrari, A. Chiasera, Y. Jestin, G. C. Righini, W. Kiefer and R. R. Gonçalves, J. Raman Spectrosc., 2007, 38, 647–659 CrossRef CAS.
- T. Hart, R. Aggarwal and B. Lax, Phys. Rev. B: Solid State, 1970, 1, 638–642 CrossRef.
- J. Menendez and M. Cardona, Phys. Rev. B: Condens. Matter Mater. Phys., 1984, 29, 2051 CrossRef CAS.
- M. Liu, L. Bursill, S. Prawer and R. Beserman, Phys. Rev. B: Condens. Matter Mater. Phys., 2000, 61, 3391–3395 CrossRef CAS.
- A. Tanaka, S. Onari and T. Arai, Phys. Rev. B: Condens. Matter Mater. Phys., 1992, 45, 6587 CrossRef CAS.
- N. G. Guo, Z. F. Zhou, Y. L. Huang, X. X. Yang, R. Jiang, Z. S. Ma and C. Q. Sun, Chem. Phys. Lett., 2013, 585, 167–170 CrossRef CAS.
- P. Kusch, H. Lange, M. Artemyev and C. Thomsen, Solid State Commun., 2011, 151, 67–70 CrossRef CAS.
- K. R. Zhu, M. S. Zhang, Q. Chen and Z. Yin, Phys. Lett. A, 2005, 340, 220–227 CrossRef CAS.
- X. X. Yang, Z. F. Zhou, Y. Wang, R. Jiang, W. T. Zheng and C. Q. Sun, J. Appl. Phys., 2012, 112, 83508 CrossRef.
- X. Fu, H. An and W. Du, Mater. Lett., 2005, 59, 1484–1490 CrossRef CAS.
- P. Mishra and K. Jain, Phys. Rev. B: Condens. Matter Mater. Phys., 2000, 62, 14790–14795 CrossRef CAS.
- H. K. Yadav, K. Sreenivas, R. S. Katiyar and V. Gupta, J. Raman Spectrosc., 2011, 42, 1620–1625 CrossRef CAS.
- M. J. Fernee, B. N. Littleton, S. Cooper, H. Rubinsztein-Dunlop, D. E. Gómez and P. Mulvaney, J. Phys. Chem. C, 2008, 112, 1878–1884 CAS.
- D. Oron, A. Aharoni, C. de Mello Donega, J. van Rijssel, A. Meijerink and U. Banin, Phys. Rev. Lett., 2009, 102, 1–4 CrossRef PubMed.
- P. Borri, W. Langbein, S. Schneider, U. Woggon, R. L. Sellin, D. Ouyang and D. Bimberg, Phys. Rev. Lett., 2001, 87, 157401 CrossRef CAS PubMed.
- Z. A. Peng and X. Peng, J. Am. Chem. Soc., 2001, 123, 183–184 CrossRef CAS PubMed.
- I. Coropceanu and M. G. Bawendi, Nano Lett., 2014, 14, 4097–4101 CrossRef CAS PubMed.
- V. M. Dzhagan, I. Lokteva, M. Y. Valakh, O. E. Raevska, J. Kolny-Olesiak and D. R. T. Zahn, J. Appl. Phys., 2009, 106, 84318 CrossRef.
- A. Girard, L. Saviot, S. Pedetti, M. D. Tessier, J. Margueritat, H. Gehan, B. Mahler, B. Dubertret and A. Mermet, Nanoscale, 2016, 8, 13251–13256 RSC.
- M. Montagna and R. Dusi, Phys. Rev. B: Condens. Matter Mater. Phys., 1995, 52, 10080–10089 CrossRef CAS.
- P. Verma, W. Cordts, G. Irmer and J. Monecke, Phys. Rev. B: Condens. Matter Mater. Phys., 1999, 60, 5778–5785 CrossRef CAS.
- J. R. Caram, H. Zheng, P. D. Dahlberg, B. S. Rolczynski, G. B. Griffin, D. S. Dolzhnikov, D. V. Talapin and G. S. Engel, J. Chem. Phys., 2014, 140, 84701 CrossRef PubMed.
- H. Lamb, Proc. London Math. Soc., 1882, 13, 189–211 Search PubMed.
- E. Duval, Phys. Rev. B: Condens. Matter Mater. Phys., 1992, 46, 5795–5797 CrossRef CAS.
- B. Bonello and B. Fernandez, J. Phys. Chem. Solids, 1993, 54, 209–212 CrossRef CAS.
- H. Iwanaga, A. Kunishige and S. Takeuchi, J. Mater. Sci., 2000, 35, 2451–2454 CrossRef CAS.
- S. K. Gupta, P. K. Jha and a. K. Arora, J. Appl. Phys., 2008, 103, 124307 CrossRef.
- G. Cerullo, S. De Silvestri and U. Banin, Phys. Rev. B: Condens. Matter Mater. Phys., 1999, 60, 1928–1932 CrossRef CAS.
- P. M. A. Sherwood, Vibrational Spectroscopy of Solids, Cambridge University Press, 1972 Search PubMed.
- A. Nelet, A. Crut, A. Arbouet, N. Del Fatti, F. Vallée, H. Portalès, L. Saviot and E. Duval, Appl. Surf. Sci., 2004, 226, 209–215 CrossRef CAS.
Footnote |
| † Electronic supplementary information (ESI) available. See DOI: 10.1039/c6cp05683k |
| This journal is © the Owner Societies 2016 |


