 Open Access Article
Creative Commons Attribution 3.0 Unported Licence
Chiral sensing of amino acids and proteins chelating with EuIII complexes by Raman optical activity spectroscopy†
Tao
Wu
 *,
Jiří
Kessler
and
Petr
Bouř
Institute of Organic Chemistry and Biochemistry, Academy of Sciences, Flemingovo náměstí 2, 16610 Prague 6, Czech Republic. E-mail: njutwu@gmail.com
First published on 1st August 2016
Abstract
Chiroptical spectroscopy of lanthanides sensitively reflects their environment and finds various applications including probing protein structures. However, the measurement is often hampered by instrumental detection limits. In the present study circularly polarized luminescence (CPL) of a europium complex induced by amino acids is monitored by Raman optical activity (ROA) spectroscopy, which enables us to detect weak CPL bands invisible to conventional CPL spectrometers. In detail, the spectroscopic response to the protonation state could be studied, e.g. histidine at pH = 2 showed an opposite sign of the strongest CPL band in contrast to that at pH = 7. The spectra were interpreted qualitatively on the basis of the ligand-field theory and related to CPL induced by an external magnetic field. Free energy profiles obtained by molecular dynamic simulations for differently charged alanine and histidine forms are in qualitative agreement with the spectroscopic data. The sensitivity and specificity of the detection promise future applications in probing peptide and protein side chains, chemical imaging and medical diagnosis. This potential is observed for human milk and hen egg-white lysozymes; these proteins have a similar structure, but very different induced CPL spectra.
Introduction
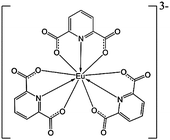
Lanthanide complexes are popular probes used in analytical and medicinal chemistry.1,2 They exhibit unique spectroscopic properties due to their electronic structure, such as the relatively isolated 4f-shell electrons and a wealth of spectroscopically active electronic transitions.3 Their luminescence is particularly sensitive to the environment of the lanthanide metal; circularly polarized luminescence (CPL), difference in the emission of left- and right-circularly polarized light, provides additional information about molecular chirality, and is thus commonly employed in biologically oriented applications.4–7However, the development of molecular biologically relevant probes based on lanthanides is not straightforward. For example, many europium(III) complexes decompose in the aqueous environment8 or the luminescence in water solutions is strongly affected by interaction with the O–H groups. The Na3[Eu(DPA)3] complex (Scheme 1) used here and similar tris-dipicolinate (DPA) complexes of lanthanides appear to be more universal because they are stable also in water. Such complexes can also be prepared relatively easily and their chiral spectroscopic response sensitively reflects their chemical neighborhood.
The sensitivity comes from the unperturbed geometry of the complex that possesses the D3 symmetry and forms enantiomers of opposite helicity. They can be imagined as left- and right-propellers and in a standard notation they are referred to as “Δ” and “Λ”. In achiral samples they are present in equal amounts. However, the Δ ↔ Λ equilibrium can be perturbed by interactions with chiral ligands, as revealed by previous CPL experiments.9–14 In general, such chirality transfer is referred to as the Pfeiffer effect.15
So far, CPL experiments on induced chirality in metal complexes used weak excitation sources and were mostly oriented to detect strong CPL bands in crystals exhibiting high CPL to total luminescence ratios.16 Only recently, solution complexes providing a strong signal were targeted by this technique as well.14,17 In the Raman optical activity (ROA) instrument the luminescence is excited by more intense laser radiation; in addition the circularly polarized components are detected using a sensitive artifact-resistant detection scheme.18 Thus very weak fluorescence bands can be detected as well. In a recent study, we discussed how the fluorescence can be distinguished from the “true” vibrational Raman bands.19 A disadvantage of the ROA–CPL approach lies in a limited spectral range of the detected fluorescence (approximately 535–610 nm), i.e. the transitions need to be close to the laser 532 nm excitation radiation. For europium(III) this is a minor drawback only because the metal has a large number of luminescence bands, including about sixty 5D → 7F transitions in the measurable region. For the systems investigated in the present study, only the strongest bands would be detectable on traditional CPL instruments.
The ROA technique has been developed to measure tiny differences in scattering of the right- and left-circularly polarized light caused by vibrational transitions in chiral molecules.20,21 It has been applied to a wide range of systems including small organic compounds, complex proteins, saccharides and nucleic acids.22–26 The difference is difficult to measure; for a typical molecule the ratio of the ROA and Raman signal (“CID”, circular intensity difference) is about 10−4. Therefore, a strong and easily detectable signal in the presence of lanthanide metal attracted attention for both the plain Raman27,28 and the ROA29–31 spectra. As pointed out above, the strongest “ROA” bands correspond neither to Raman scattering nor to vibrational transitions, but they originate from circularly polarized luminescence initiated by the laser radiation.19
Before, we could detect a record-high CPL activity of a Cs–EuIII complex by ROA.19 The dissymmetry factor (“g”, CPL analogue of the CID) of this complex was 1.4, corresponding to a CID of 1.4/2 = 0.7.32,33 The aqueous complexes studied here provide much smaller g; however, they exhibit remarkable sensitivity to the type and the protonation state of amino acid chain.
At present, a priori theoretical tools providing the link between the spectra and the structure are not available. The principle problems lie in the complicated lanthanide electronic structure, so far fairly inaccessible by contemporary quantum chemistry. Nevertheless, we use the empirical crystal field theory34–36 enabling us to assign the observed transitions, and on a semi-quantitative basis model the induced chirality.
To document that the structural sensitivity remains even when the europium compound reacts with proteins and thus indicate a more wide range of potential applications of this technique, we also report induced CPL spectra of two structurally very close proteins, human milk and hen egg-white lysozymes. They provide opposite spectral patterns; in fact, we are not aware of any other spectroscopy that would provide signals so different as CPL.
Results and discussion
EuIII CPL induced by alanine
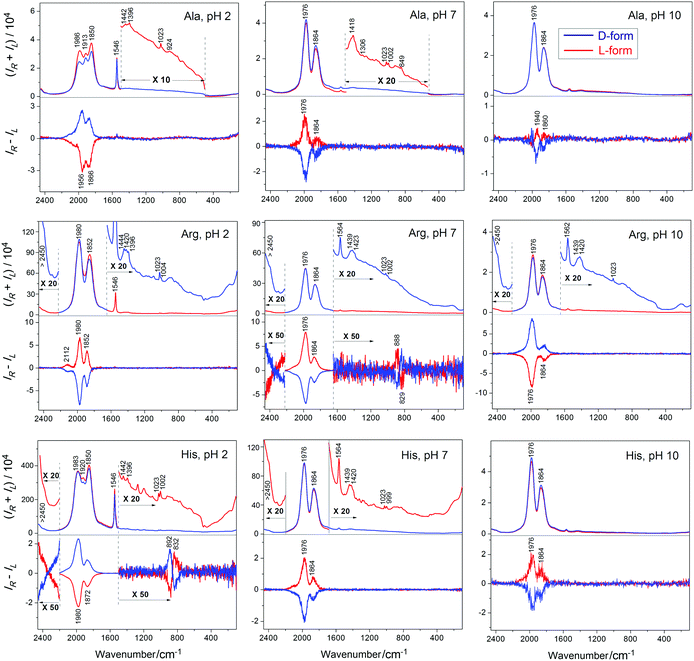
CPL spectra of complex Na3[Eu(DPA)3] induced by alanine provide rather weak signals. The Raman (luminescence) and ROA (CPL) spectra are plotted in Fig. 1 (top). At pH 7 and 10, the (total) luminescence is dominated by two strong 1864 and 1976 cm−1 bands, both corresponding to 5D0 → 7F1 transitions of Eu3+.3 These are accompanied by corresponding circularly polarized luminescence bands. At pH 2, the fluorescence splits into more bands, and a band at 1546 cm−1 significantly gains in intensity. The highest CID ratio of the polarized and total luminescence components is about 1 × 10⁻⁴ and corresponds to the weak interaction between alanine and the complex (selected CID ratios are listed in Table S1, ESI†). Still, the spectral intensities are much higher than Raman and vibrational ROA of alanine. In the zoomed insets, a few Raman bands may be recognized while ROA is invisible at this scale. True vibrational ROA of alanine is also impossible to measure at such low concentrations. At high concentrations of alanine, observed ROA CID ratios of ∼3 × 10⁻⁴ (Fig. S1, ESI†) are larger than those corresponding to Eu(III) CPL.EuIII CPL induced by histidine and arginine
As discussed before amino acids with the polar side chains interact much more strongly with Na3[Eu(DPA)3] and similar complexes than alanine.16,37 The luminescence, and in particular CPL, is also very sensitive to pH and the protonation state. One can see (Fig. 1), for example, that the low pH of 2 supports a high luminescence intensity of the 1546 cm−1 (5D0 → 7F0) band. Neutral (7) and basic (10) pH provide very similar Raman spectra. In the magnified “Raman” spectra the true vibrational Raman scattering signal specific for each amino acid and the complex is apparent as well: dipicolinate centers around 1420 and 1023 cm−1, and Raman bands of histidine and arginine can be recognized, for example, as CH2 wagging around 1439 cm−1, C–N valence, ring vibration at 999 cm−1, etc.38,39 Vibrational Raman and ROA spectra of pure histidine and arginine can be found in Fig. S2 and S3 (ESI†).The ROA intensities in Fig. 1 comprise CPL only; vibrational ROA at these low concentrations is invisible as for alanine. But the CID ratios are much higher for the charged amino acids, with a maximum of ∼0.007 for the protonated (pH = 2) form of histidine (which can be gradually increased to ∼0.014 with higher concentration of histidine, Fig. S5, ESI†), indicating a much stronger interaction with the europium complex than for alanine. The weakest interaction, at least as judged from the low CID of 4 × 10⁻⁵, is indicated between [Eu(DPA)3]3− and histidine at pH = 10 (Table S1, ESI†). For the protonated form of histidine and the neutral form of arginine 5D1 → 7F2 transition gives rise to a weak but measurable CPL. This signal appears in a form of couplets (close positive and negative band), different from the one-sign pattern of the strongest bands, which suggests a different mechanism of chirality induction, most probably associated with a perturbation of the D3 symmetry of the Λ and Δ forms of the complex. Above 2400 cm−1, the signal of a 5D0 → 7F2 band is partially observable as a shoulder, which is at the limit of the operational instrumental range and the intensity might not be reliable.
The complex chirality control achieved by the environmental pH value appears to be very interesting. Let us arbitrarily associate the Λ-configuration of the complex with the positive signal at 1970 cm−1. Then for arginine we observe the following possibility of chirality changes by pH:
| Λ (pH = 2) ↔ Λ (pH = 7) ↔ Δ (pH = 10) |
For alanine and histidine, we get:
| Δ (pH = 2) ↔ Λ (pH = 7) ↔ Λ (pH = 10) |
EuIII CPL induced by tartaric acid and an external magnet
The spectrum induced by tartaric acid (Fig. 2) is similar to that of alanine, but the two strongest luminescence bands are broader and shifted (to 1978 and 1858 cm−1) and a narrow band appears at 1546 cm−1 (5D0 → 7F0 transition). CPL bands are broader as well, and the CID of the strongest bands increases to 1.7 × 10⁻⁴.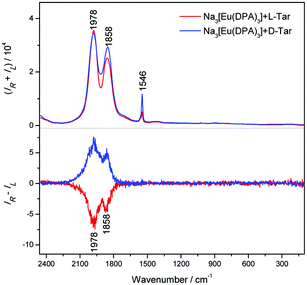 | ||
| Fig. 2 Raman (upper) and ROA (lower) spectra of complexes with [Eu(DPA)3]3− (2 mM) with L- and D-forms of tartaric acid (20 mM); the accumulation time was 2 hours. | ||
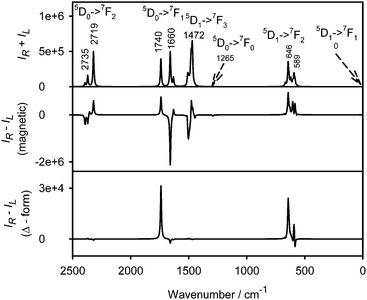
Raman and magnetic ROA spectra40 of aqueous solution of plain Na3[Eu(DPA)3] (Fig. 3) confirm that the bands observed in the complexes with amino acids originate in europium electronic transitions and facilitate their assignment. Although pure electronic magnetic Raman optical activity has been reported for heavy metal complexes as well,21,41 control measurements with a 404 nm excitation laser and the degree of circularity confirm19 that at least the strongest bands are almost exclusively formed by the luminescence and correspond to those observed in the chiral complexes. Only few bands corresponding to the “true” vibrational Raman scattering of the tris(pyridine-2,6-dicarboxylate) ligand can be recognized, such as the CC ring stretch at ∼1423 cm−1 and symmetric breathing mode of the pyridine ring at ∼1023 cm−1.42,43
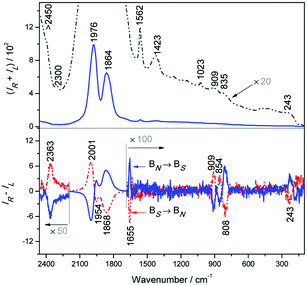 | ||
| Fig. 3 Raman (upper) and magnetic ROA (lower) of Na3[Eu(DPA)3] (2 mM) water solution; the accumulation time was 20 minutes. | ||
The magnetic ROA spectra (Fig. 3, lower) are again mostly formed by circularly polarized luminescence. Band positions correspond to those in the complexes with amino acids, but the sign pattern and relative intensities are different, which reflects the different mechanisms of optical activity induced by the magnetic field and by the complexations with chiral ligands. This is best documented on the strongest signal within 1800–2100 cm−1 providing a multiple sign pattern in magnetic ROA/CPL, where the amino acids induced one sign pattern only. In the magnetic field, additional weaker magnetic ROA/CPL bands below 250 cm−1 can be observed, assignable to 5D1 → 7F1 transitions within the Eu3+ f-shell electronic system.3,13,19,44 The strongest observed transitions of Na3[Eu(DPA)3] and its complexes with histidine and arginine are summarized in Table 1. The transition assignment is based on the crystal field theory3,45 and the electronic structure of free Eu3+ ions, which is not much perturbed in the complexes.
| Transition | Magnetic CPL | Induced CPL-His | Induced CPL-Arg | |||
|---|---|---|---|---|---|---|
| δ/cm−1 | λ/nm | δ/cm−1 | λ/nm | δ/cm−1 | λ/nm | |
| 5D0 → 7F2 | >2450 | 615 | >2450 | 615 | >2450 | 615 |
| 2362 | 608 | |||||
| 2300 | 606 | |||||
| 5D0 → 7F1 | 2001 | 595 | 1983 | 595 | 1976 | 595 |
| 1976 | 594 | 1980 | 595 | |||
| 1954 | 594 | 1920 | 592 | |||
| 5D0 → 7F1 | 1868 | 591 | 1872 | 591 | 1864 | 591 |
| 1864 | 591 | 1850 | 590 | |||
| 5D0 → 7F0 | 1655 | 583 | 1546 | 580 | 1546 | 580 |
| 5D1 → 7F2 | 909 | 550 | 892 | 558 | 888 | 558 |
| 854 | 557 | 832 | 557 | 829 | 557 | |
| 835 | 557 | |||||
| 808 | 556 | |||||
| 5D1 → 7F1 | 243 | 539 | ||||
Theoretical analysis
The crystal field theory also provides a handy tool to qualitatively model the Eu3+ spectral intensities and assign observed transition. The calculated luminescence, magnetic and ordinary CPL of the [Eu(DPA)3]3− ion are plotted in Fig. 4. As expected for an empirical model, the calculated transition energies differ from the observed ones by 200–300 cm−1 and relative spectral intensities are not always matching the experiment, otherwise the simulated spectra well correspond to the observation. For example, the highest-wavenumber transition observed at ∼2000 cm−1 is reproduced at 1740 cm−1, although its relative intensity is significantly underestimated, the lowest one observed at ∼240 cm−1 is reproduced at ∼0 cm−1 (= 532 nm), etc. As in experiment, CPL induced by the magnetic field is different from that exhibited by an enantiomeric (Δ) form, magnetic CPL above 2300 cm−1 is relatively strong compared to (ordinary) CPL, and the strongest 5D0 → 7F1 region exhibits both positive and negative magnetic CPL, while for CPL rather one-sign pattern is simulated. Note that the y-scale has no meaning for magnetic CPL because absolute magnitudes of transition matrix elements are not known.Chiral recognition mechanism
In spite of the large chiroptical effect, the complexes of [Eu(DPA)3]3− with the amino acids do not appear particularly stable. For example, Raman and ROA spectra of the L-His/Na3[Eu(DPA)3] complex measured at different temperatures (Fig. S4, ESI†) reveal that the induced CPL almost vanishes at 90 °C. Also, the dependence of CID on the amino acid/Na3[Eu(DPA)3] molar ratio (Fig. S5, ESI†) exhibits a slow convergence and indicates a small stability constant of the resultant “super-complex”.At present, we do not know the accurate structure of the amino acid associated with the [Eu(DPA)3]3− ion. Clearly, the positively charged histidine and arginine forms are most attracted to the negatively charged complex, cf. Fig. S6 (ESI†) with its electrostatic potential. The ion pairing, however, can produce high CID and strong CPL only for an interaction additionally sensitive to [Eu(DPA)3]3− chirality.46 This can be provided by hydrogen bonding and electrostatic attractions between the COO− groups of [Eu(DPA)3]3− and polar amino acid parts, as well as by π–π interactions and van der Waals attraction.
For selected systems we ran molecular dynamics simulations and obtained free energy profiles using the weighted histogram analysis method (WHAM).35,36 For alanine (Fig. 5) we can see that the protonated (Ala+) form is predicted to interact most strongly with the [Eu(DPA)3]3− ion, with two minima of the energy at approximately 5 and 7 Å. For the Δ-form, the minima have about the same value (−0.8 kcal mol−1), whereas for the Λ-form the distance of 7 Å is more favoured. Note also the energy maximum at ∼9.5 Å, which corresponds to disruption of the hydration spheres of [Eu(DPA)3]3− and Ala+ when they are coming closer.
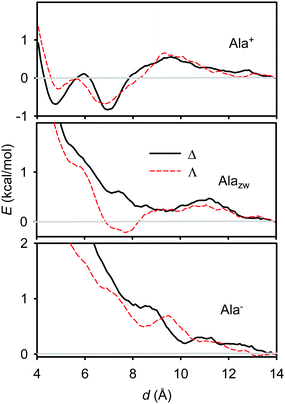 | ||
| Fig. 5 Calculated free energy profiles for different L-alanine forms interacting with Δ and Λ enantiomers of [Eu(DPA)3]3−. | ||
For alanine in the zwitterionic form (Alazw, middle in Fig. 5) only a very shallow (−0.2 kcal mol−1) minimum appears at ∼7.5 Å for the Λ-enantiomer of [Eu(DPA)3]3−. For Alazw and the Δ-enantiomer, as well as for the deprotonated amino acid (Ala−, bottom of the figure), no significant minima of the energy are apparent. This behavior qualitatively well corresponds to the spectroscopic results (Fig. 1), where Ala+ provided the largest chiral response while the other forms gave much weaker CPL intensities.
Similar behaviour of the free energy was obtained also for histidine (Fig. 6). However, its energy profiles for the Δ and Λ enantiomers are more different than those for alanine, and the energy scale suggests that the interaction with [Eu(DPA)3]3− is in general stronger. For example, the double-protonated form (His2+) provides only a weak (∼−0.7 kcal mol−1) energy minimum with the Λ-enantiomer, but its associate with the Δ-enantiomer of [Eu(DPA)3]3− is stabilized by 3.1 kcal mol−1 around 8 Å. This is in agreement with both the spectroscopic results described above (Fig. 1) and the different histidine structure providing more binding sites than alanine.
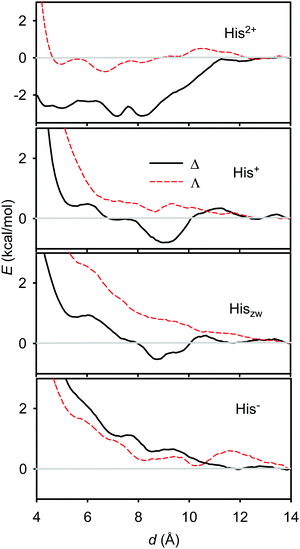 | ||
| Fig. 6 Calculated free energy profiles for different L-histidine forms interacting with Δ and Λ enantiomers of [Eu(DPA)3]3−. | ||
Geometries of His2+ associates with Δ- and Λ-[Eu(DPA)3]3− obtained by the molecular dynamic simulations are shown in Fig. 7. As also shown in Fig. 6, the formation of the first system is associated with the stabilization energy of 3.1 kcal mol−1, while the second is stabilized by 0.7 kcal only. At this point, however, we wish to warn the reader that although the simulations provide a plausible explanation of the experiment, they may be hampered by limited configurational sampling, restriction to one protonation state, a 1![[thin space (1/6-em)]](https://www.rsc.org/images/entities/char_2009.gif) :
:![[thin space (1/6-em)]](https://www.rsc.org/images/entities/char_2009.gif) 1 complex
1 complex![[thin space (1/6-em)]](https://www.rsc.org/images/entities/char_2009.gif) :
:![[thin space (1/6-em)]](https://www.rsc.org/images/entities/char_2009.gif) amino acid ratio, and force field accuracy. Nevertheless, the results document the possibility of chiral discrimination and the energetics and stereochemistry involved. For the first structure in Fig. 7, for example, a π–π stacking between the histidine five-membered ring and the DPA ligand is possible, while the Δ configuration does not enable it. More realistic energy and geometry estimates are intended for future studies as the perturbation of the Δ ↔ Λ equilibrium is associated with rather small energy differences, which are especially difficult to reproduce for the weak chirality sensitive interactions.47 For the 5D0 → 7F1 transition in [Eu(DPA)3]3− a maximal g-factor of ∼0.1 was reported,48 which again indicates a partial stereoselection in our experiments only.
amino acid ratio, and force field accuracy. Nevertheless, the results document the possibility of chiral discrimination and the energetics and stereochemistry involved. For the first structure in Fig. 7, for example, a π–π stacking between the histidine five-membered ring and the DPA ligand is possible, while the Δ configuration does not enable it. More realistic energy and geometry estimates are intended for future studies as the perturbation of the Δ ↔ Λ equilibrium is associated with rather small energy differences, which are especially difficult to reproduce for the weak chirality sensitive interactions.47 For the 5D0 → 7F1 transition in [Eu(DPA)3]3− a maximal g-factor of ∼0.1 was reported,48 which again indicates a partial stereoselection in our experiments only.
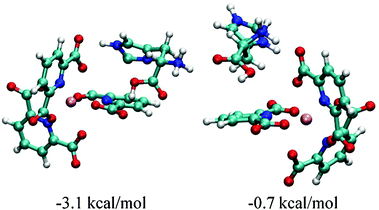 | ||
| Fig. 7 Geometries and formation free energies of L-histidine complexes with the Δ (left) and Λ (right) form of [Eu(DPA)3]3−. | ||
[Eu(DPA)3]3− complexes with human milk and hen egg-white lysozymes
Luminescence and induced CPL spectra of the lysozyme mixtures with [Eu(DPA)3]3−, together with the vibrational Raman and ROA spectra of pure proteins as obtained in ref. 49, are shown in Fig. 8. The two proteins are fairly similar, and the vibrational ROA/Raman spectra (upper part of the figure) differ in minor features only. Also the luminescence spectra are almost the same. However, the [Eu(DPA)3]3− complex in the presence of the lysozymes provides induced CPL spectra of different chiralities. The strong 5D0 → 7F1 1976 and 1875 cm−1 bands of human milk lysozyme provide CID ratios of 1.46 × 10⁻² and 7.14 × 10⁻³, respectively, and the signal remains detectable at a much lower concentration (0.5 mg ml−1) of the protein than needed for classical vibrational ROA measurements (>100 mg ml−1). The hen egg-white lysozyme inverses the CPL sign of the strongest bands and provides in absolute magnitude bigger CIDs of −4.65 × 10⁻² and −2.24 × 10⁻². A similar change occurs for the weaker bisignate 5D1 → 7F2 CPL signal at 838 and 887 cm−1. Note that such an induced CPL signal takes full advantage of the ROA laser resource (1000 mW) which is not accessible by traditional CPL spectrometers. The observation is consistent with the sensitive response of the Δ ↔ Λ equilibrium to the individual amino acid chains, and indicates the potential of the method in biochemical analyses.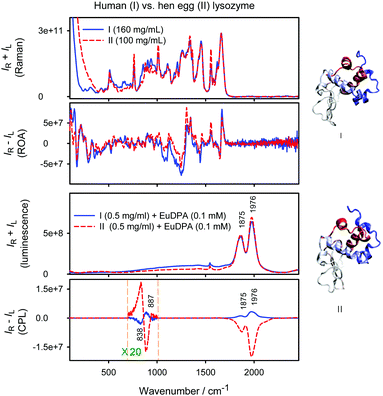 | ||
| Fig. 8 Normalized Raman and ROA spectra of human milk and hen-egg lysozyme (from ref. 49) and luminescence and CPL spectra of the complexes with [Eu(DPA)3]3− (this work). | ||
Experimental
Synthesis of the EuIII complex
The Na3[Eu(DPA)3] (DPA = dipicolinate = 2,6-pyridinedicarboxylate) complex was obtained by a reaction of europium carbonate and pyridine-2,6-dicarboxylic acid in the 1![[thin space (1/6-em)]](https://www.rsc.org/images/entities/char_2009.gif) :
:![[thin space (1/6-em)]](https://www.rsc.org/images/entities/char_2009.gif) 3 molar ratio in water, and pH was adjusted to 7 by adding 1 M sodium carbonate solution.
3 molar ratio in water, and pH was adjusted to 7 by adding 1 M sodium carbonate solution.
ROA and magnetic ROA experiments
Backscattering Raman and scattered circular polarization (SCP) ROA spectra were acquired on a BioTools ROA spectrometer operating with laser excitation at 532 nm at a resolution of 7 cm−1, and the laser power at the sample was 200–1000 mW. Accumulation times were 1 hour for the ROA spectra of histidine–EuIII complexes at pH = 2 and arginine at pH = 7; 4 hours for spectral panels of histidine–EuIII at pH = 7 and Arginine–EuIII at pH = 2, 10; and 20 hours for spectral panels of histidine–EuIII at pH = 10 and alanine–EuIII at pH = 2, 7 and 10, respectively. Magnetic ROA (MROA) spectra41,50 were acquired under similar conditions, using a magnetic cell providing a field of about 1.5 tesla.40 The collection time was 20 min for the MROA spectrum of Na3[Eu(DPA)3] with a concentration of 2 mM in water. For ROA spectral measurements of pure amino acids, the collection times were 10 h with a concentration of 0.5 M for L/D-alanine, 0.24 M for L/D-histidine and 0.34 M for L/D-arginine. The pH value was adjusted using 0.1 M HCl or NaOH aqueous solutions. Human milk and hen egg-white lysozymes (Sigma-Aldrich) were dissolved in water. For Raman, ROA and degree of circularity spectral measurements the protein concentration was 0.5 mg ml−1 and the EuDPA complex concentration was 0.1 mM; the measurement took 1 hour. All experiments were performed at room temperature (20 °C). Raman spectra are presented after subtraction of the water background signal. Note that Raman spectra also comprise the total luminescence and the ROA spectra comprise circularly polarized luminescence.Theoretical calculations
[Eu(DPA)3]3− geometry was optimized by energy minimization using the Gaussian 0951 program, the B3LYP functional, the MWB28 pseudopotential and basis set for Eu, and the 6-31G(d,p) basis set for the other atoms. The solvent was modelled by a conductor-like polarizable continuum solvent model (CPCM).52To assign spectral peaks and approximately simulate spectral intensities, the semi-empirical crystal theory was used.3,53 The crystal (ligand) potential in Na3[Eu(DPA)3] was calculated from ligand electronic density obtained using Gaussian at the B3LYP/6-31G(d,p)/PCM approximation level. The europium wavefunctions and energies were obtained using the Lanthanide program.34 Then spectral intensities were generated using our AnalCFP program interfaced to Lanthanide, using the perturbational approach54–56 where the Eu3+ free-ion wavefunction was perturbed by the same DPA ligand electrostatic potential. For example, the electric dipole moment matrix element for a transition between states A and B (α = x, y, or z) was calculated as
where K is a constant, V is the ligand electrostatic potential, and u denote configurations where one electron is transferred to the g or d-shell. Note that the plain dipole moments within the f-shell configurations 〈f6q|μα|f6q′〉 are zero; thus the spectrum is very sensitive to the lanthanide environment entering through the potential V. For magnetic CPL, the sum over states formula was used as developed previously for magnetic circular dichroism.57 The potential was calculated from nuclear charges and electron density obtained by the Gaussian calculation.
Interaction of L-histidine with the Λ and Δ [Eu(DPA)3]3− forms was also studied using molecular dynamics and the Amber1458 software. Variously protonated histidine and alanine amino acids with the [Eu(DPA)3]3− ion were placed inside a cubic box (30 Å a side) filled with water molecules. For a large distance of the two components, the energy of the system was minimized, and the geometry was equilibrated during a 1 ns NVT dynamics, using an integration step of 1 fs, temperature of 300 K, and the GAFF59 (DPA ligands), Amber14SB60 (alanine and histidine) and TIP3P61 (water) force fields. Europium parameters were taken from ref. 62. Then the distance between carbonyl oxygen of histidine/alanine and europium was decreasing (14–4 Å) in 1 Å steps using 1 ns long constrained dynamics runs and a harmonic potential force constant of 2 kcal Å−2 mol−1. From resultant histograms the potential of mean force was obtained via the weighted histogram analysis method (WHAM).35,36
Conclusions
We synthesized the water-soluble Na3[Eu(DPA)3] complex and explored its chirality induced by model amino acids. Due to the sensitive ROA instrumentation very weak CPL bands could be detected, invisible to conventional CPL experiments. The results confirm a tight link between measured CPL spectra patterns and the structure; in particular, the circularly polarized component was found to be extremely sensitive to the nature of the interacting ligand. Magnetic ROA spectra were measured as well, comprising mostly magnetically induced CPL, which enabled us to better discriminate and assign observed transitions. On a semi-quantitative basis, the relation of spectral intensities to fine structural changes could be modelled by the crystal field theory, which also confirmed the assignment of the transitions. For various alanine and histidine forms the molecular dynamics modelling confirmed the possibility of chiral discrimination, e.g. it indicated that the π–π stacking involving histidine side chain and electrostatic interactions may be equally important for the complex stabilization. Significant differences in induced CPL in the presence of human milk and hen egg-white lysozymes suggest that the sensitivity of the [Eu(DPA)3]3− complex may facilitate its applications for sensitive protein detection in analytical chemistry and chemical imaging.Acknowledgements
This work was supported by the Czech Science Foundation (16-08764Y, 16-05935 and S15-09072S).Notes and references
- M. C. Heffern, L. M. Matosziuk and T. J. Meade, Chem. Rev., 2014, 114, 4496–4539 CrossRef CAS PubMed.
- J. C. G. Bunzli and S. V. Eliseeva, Chem. Sci., 2013, 4, 1939–1949 RSC.
- K. Binnemans, Coord. Chem. Rev., 2015, 295, 1–45 CrossRef CAS.
- F. Zinna and L. Di Bari, Chirality, 2015, 27, 1–13 CrossRef CAS PubMed.
- L. Benda, J. Štěpánek, J. Kaminský and P. Bouř, in Comprehensive Chirality, ed. E. M. Carreira and H. Yamamoto, Elsevier, Amsterdam, 2012, vol. 8, pp. 520–544 Search PubMed.
- L. Benda, P. Bouř, N. Müller and V. Sychrovský, J. Phys. Chem. B, 2009, 113, 5273–5281 CrossRef CAS PubMed.
- E. M. Sanchez-Carnerero, A. R. Agarrabeitia, F. Moreno, B. L. Maroto, G. Muller, M. J. Ortiz and S. de la Moya, Chem. – Eur. J., 2015, 21, 13488–13500 CrossRef CAS PubMed.
- V. Andrushchenko, D. Padula, E. Zhivotova, S. Yamamoto and P. Bouř, Chirality, 2014, 26, 655–662 CrossRef CAS PubMed.
- H. G. Brittain, Inorg. Chem., 1981, 20, 3007–3013 CrossRef CAS.
- H. G. Brittain, J. Coord. Chem., 1989, 20, 331–347 CrossRef CAS.
- E. Huskowska and J. P. Riehl, Inorg. Chem., 1995, 34, 5615–5621 CrossRef CAS.
- G. Muller and J. P. Riehl, J. Fluoresc., 2005, 15, 553–558 CrossRef CAS PubMed.
- P. Gawryszewska, J. Legendziewicz, Z. Ciunik, N. Esfandiari, G. Muller, C. Piguet, M. Cantuel and J. P. Riehl, Chirality, 2006, 18, 406–412 CrossRef CAS PubMed.
- A. Moussa, C. Pham, S. Bommireddy and G. Muller, Chirality, 2009, 497–506 CrossRef CAS PubMed.
- S. Kirschner, N. Ahmad, C. Munir and R. J. Pollock, Pure Appl. Chem., 1979, 51, 913–923 CrossRef CAS.
- J. P. Riehl and G. Muller, in Comprehensive chiroptical spectroscopy, volume 1: Instrumentation, methodologies, and theoretical simulations, ed. N. Berova, P. L. Polavarapu, K. Nakanishi and R. W. Woody, John Wiley & Sons, New Jersey, 2012, vol. 1, pp. 65–90 Search PubMed.
- B. T. Nguyen, A. J. Ingram and G. Muller, Chirality, 2016, 28, 325–331 CrossRef CAS PubMed.
- W. Hug, Appl. Spectrosc., 2003, 57, 1–13 CrossRef CAS PubMed.
- T. Wu, J. Kapitán, V. Mašek and P. Bouř, Angew. Chem., Int. Ed., 2015, 54, 14933–14936 CrossRef CAS PubMed.
- L. Nafie, Vibrational optical activity: Principles and applications, Wiley, Chichester, 2011 Search PubMed.
- L. D. Barron, Molecular Light Scattering and Optical Activity, Cambridge University Press, Cambridge, 2004 Search PubMed.
- J. Haesler, I. Schindelholz, E. Riguet, C. G. Bochet and W. Hug, Nature, 2007, 446, 526–529 CrossRef CAS PubMed.
- S. Luber and M. Reiher, ChemPhysChem, 2010, 11, 1876–1887 CAS.
- E. W. Blanch, L. Hecht, C. D. Syme, V. Volpetti, G. P. Lomonossoff, K. Nielsen and L. D. Barron, J. Gen. Virol., 2002, 83, 2593–2600 CrossRef CAS PubMed.
- E. W. Blanch, I. H. McColl, L. Hecht, K. Nielsen and L. D. Barron, Vib. Spectrosc., 2004, 35, 87–92 CrossRef CAS.
- Z. Q. Wen, L. D. Barron and L. Hecht, J. Am. Chem. Soc., 1993, 115, 285–292 CrossRef CAS.
- M. Vargek, T. B. Freedman, E. Lee and L. A. Nafie, Chem. Phys. Lett., 1998, 287, 359–364 CrossRef CAS.
- J. A. Koningstein, Russ. Chem. Rev., 1973, 42, 834–850 CrossRef.
- S. Yamamoto and P. Bouř, Angew. Chem., Int. Ed., 2012, 51, 11058–11061 CrossRef CAS PubMed.
- C. Merten, H. Li, X. Lu, A. Hartwiga and L. A. Nafie, J. Raman Spectrosc., 2010, 41, 1563–1565 CrossRef.
- T. Wu, J. Hudecová, X. Z. You, M. Urbanová and P. Bouř, Chem. – Eur. J., 2015, 21, 5807–5813 CrossRef CAS PubMed.
- J. L. Lunkley, D. Shirotani, K. Yamanari, S. Kaizaki and G. Muller, J. Am. Chem. Soc., 2008, 130, 13814–13815 CrossRef CAS PubMed.
- J. L. Lunkley, D. Shirotani, K. Yamanari, S. Kaizaki and G. Muller, Inorg. Chem., 2011, 50, 12724–12732 CrossRef CAS PubMed.
- S. Edvardsson and D. Åberg, Comput. Phys. Commun., 2001, 133, 396–406 CrossRef CAS.
- S. Kumar, D. Bouzida, R. H. Swendsen, P. A. Kollman and J. M. Rosenberg, J. Comput. Chem., 1992, 13, 1011–1021 CrossRef CAS.
- B. Roux, Comput. Phys. Commun., 1995, 91, 275–282 CrossRef CAS.
- K. Okutani, K. Nozaki and M. Iwamura, Inorg. Chem., 2014, 53, 5527–5537 CrossRef CAS PubMed.
- E. Deplazes, W. van Bronswijk, F. Zhu, L. D. Barron, S. Ma, L. A. Nafie and K. J. Jalkanen, Theor. Chem. Acc., 2008, 119, 155–176 CrossRef CAS.
- X. Li, K. H. Hopmann, J. Hudecová, W. Stensen, J. Novotná, M. Urbanová, J. S. Svendsen, P. Bouř and K. Ruud, J. Phys. Chem. A, 2012, 116, 2554–2563 CrossRef CAS PubMed.
- J. Šebestik and P. Bouř, Angew. Chem., Int. Ed., 2014, 53, 9236–9239 CrossRef PubMed.
- L. D. Barron and J. Vrbancich, J. Raman Spectrosc., 1983, 14, 118–125 CrossRef CAS.
- A. A. Kolomenskii and H. A. Schuessler, Spectrochim. Acta, Part A, 2005, 61, 647–651 CrossRef CAS PubMed.
- L. B. Kong, P. Setlow and Y. Q. Li, Analyst, 2012, 137, 3683–3689 RSC.
- D. R. Foster and F. S. Richardson, Inorg. Chem., 1983, 22, 3996–4002 CrossRef CAS.
- J. R. G. Thorne, M. Jones, C. S. McCaw, K. M. Murdoch, R. G. Denning and N. M. Khaidukov, J. Phys.: Condens. Matter, 1999, 11, 7851–7866 CrossRef CAS.
- A. Berthod, Anal. Chem., 2006, 78, 2093–2099 CrossRef PubMed.
- J. Kessler, M. Dračínský and P. Bouř, J. Phys. Chem. A, 2015, 119, 5260–5268 CrossRef CAS PubMed.
- P. Gawryszenska, J. Legendziewicz, Z. Ciunik, N. Esfandiari, G. Muller, C. Piguuet, M. Cantuel and J. P. Riehl, Chirality, 2006, 18, 406–412 CrossRef PubMed.
- J. Kessler, J. Kapitán and P. Bouř, J. Phys. Chem. Lett., 2015, 6, 3314–3319 CAS.
- L. D. Barron and J. Vrbancich, J. Raman Spectrosc., 1984, 15, 47–50 CrossRef CAS.
- M. J. Frisch, G. W. Trucks, H. B. Schlegel, G. E. Scuseria, M. A. Robb, J. R. Cheeseman, G. Scalmani, V. Barone, B. Mennucci, G. A. Petersson, H. Nakatsuji, M. Caricato, X. Li, H. P. Hratchian, A. F. Izmaylov, J. Bloino, G. Zheng, J. L. Sonnenberg, M. Hada, M. Ehara, K. Toyota, R. Fukuda, J. Hasegawa, M. Ishida, T. Nakajima, Y. Honda, O. Kitao, H. Nakai, T. Vreven, J. A. Montgomery, Jr., J. E. Peralta, F. Ogliaro, M. Bearpark, J. J. Heyd, E. Brothers, K. N. Kudin, V. N. Staroverov, R. Kobayashi, J. Normand, K. Raghavachari, A. Rendell, J. C. Burant, S. S. Iyengar, J. Tomasi, M. Cossi, N. Rega, J. M. Millam, M. Klene, J. E. Knox, J. B. Cross, V. Bakken, C. Adamo, J. Jaramillo, R. Gomperts, R. E. Stratmann, O. Yazyev, A. J. Austin, R. Cammi, C. Pomelli, J. W. Ochterski, R. L. Martin, K. Morokuma, V. G. Zakrzewski, G. A. Voth, P. Salvador, J. J. Dannenberg, S. Dapprich, A. D. Daniels, O. Farkas, J. B. Foresman, J. V. Ortiz, J. Cioslowski and D. J. Fox, Revision D.01., 2013 Search PubMed.
- A. Klamt, J. Phys. Chem., 1995, 99, 2224–2235 CrossRef CAS.
- W. T. Carnall, G. L. Goodman, K. Rajnak and R. S. Rana, J. Chem. Phys., 1989, 90, 3443–3457 CrossRef CAS.
- G. S. Ofelt, J. Chem. Phys., 1962, 37, 511–520 CrossRef CAS.
- B. R. Judd, Phys. Rev., 1962, 127, 750–761 CrossRef CAS.
- F. S. Richardson and T. R. Faulkner, J. Chem. Phys., 1982, 76, 1595–1606 CrossRef CAS.
- P. Štěpánek and P. Bouř, J. Comput. Chem., 2015, 36, 723–730 CrossRef PubMed.
- D. A. Pearlman, D. A. Case, J. W. Caldwell, W. S. Ross, T. E. Cheatham, S. Debolt, D. M. Ferguson, G. Seibel and P. A. Kollman, Comput. Phys. Commun., 1995, 91, 1–41 CrossRef CAS.
- J. Wang, R. M. Wolf, J. W. Caldwell, P. A. Kollman and D. A. Case, J. Comput. Chem., 2005, 25, 1157–1174 CrossRef PubMed.
- K. Lindorff-Larsen, S. Piana, K. Palmo, P. Maragakis, J. L. Klepeis, R. O. Dror and D. E. Shaw, Proteins, 2010, 78, 1950–1958 CAS.
- W. L. Jorgensen, J. Chandrasekhar and J. D. Madura, J. Chem. Phys., 1983, 79, 926–935 CrossRef CAS.
- P. Li, L. F. Song and K. M. Merz, J. Phys. Chem. B, 2015, 119, 883–895 CrossRef CAS PubMed.
Footnote |
| † Electronic supplementary information (ESI) available: Raman and ROA spectra of alanine, histidine and arginine, Raman and ROA spectra of the L-His/[Eu(DPA)3]3− complex at different temperatures, CID dependence on molar ratios of L-Arg/[Eu(DPA)3]3− at pH 7 and L-His/[Eu(DPA)3]3− at pH 2, calculated [Eu(DPA)3]3− electrostatic potential, Raman and degree of circularity spectra of [Eu(DPA)3]3− chelated with human milk lysozyme, and CID ratios for 5D0 → 7F1 transition of the [Eu(DPA)3]3− complex induced by amino acids. See DOI: 10.1039/c6cp03968e |
| This journal is © the Owner Societies 2016 |

