
 Open Access Article
 This Open Access Article is licensed under a Creative Commons Attribution-Non Commercial 3.0 Unported Licence
Highly stable SERS pH nanoprobes produced by co-solvent controlled AuNP aggregation†
Haoran
Wei
abc,
Marjorie R.
Willner
abc,
Linsey C.
Marr
 abc and
Peter J.
Vikesland
*abc
abc and
Peter J.
Vikesland
*abc
aDepartment of Civil and Environmental Engineering, Virginia Tech, Blacksburg, VA, USA. E-mail: pvikes@vt.edu; Fax: +1 540-231-7931; Tel: +1 540-231-3568
bInstitute for Critical Technology and Applied Science (ICTAS) Center for Sustainable Nanotechnology (VTSuN), Virginia Tech, Blacksburg, VA, USA
cNSF-EPA Center for the Environmental Implications of Nanotechnology (CEINT), Duke University, Durham, NC, USA
First published on 22nd April 2016
Abstract
Production of gold nanoparticle (AuNP) surface-enhanced Raman spectroscopy (SERS) nanoprobes requires replicable aggregation to produce multimers with high signal intensity. Herein, we illustrate a novel, yet simple, approach to produce SERS nanoprobes through control of co-solvent composition. AuNP multimers were produced by mixing AuNP monomers in water![[thin space (1/6-em)]](https://www.rsc.org/images/entities/char_2009.gif) :ethanol co-solvent for variable periods of time. By varying the water:ethanol ratio and the amount of 4-mercaptobenzoic acid (4-MBA) present, the aggregation rate can be systematically controlled. Thiolated poly(ethylene glycol) was then added to halt the aggregation process and provide steric stability. This approach was used to produce pH nanoprobes with excellent colloidal stability in high ionic strength environments and in complex samples. The pH probe exhibits broad pH sensitivity over the range 6–11 and we calculate that a single AuNP dimer in a 35 fL volume is sufficient to generate a detectable SERS signal. As a proof-of-concept, the probes were used to detect the intracellular pH of human prostate cancer cells (PC-3). The internalized probes exhibit a strong 4-MBA signal without any interfering bands from either the cells or the culture media and produce exceptionally detailed pH maps. pH maps obtained from 19 xy surface scans and 14 yz depth scans exhibit highly consistent intracellular pH in the range of 5 to 7, thus indicating the greater reliability and reproducibility of our pH probes compared with other probes previously reported in the literature. Our water:ethanol co-solvent production process is fast, simple, and efficient. Adjustment of solvent composition may become a powerful way to produce SERS tags or nanoprobes in the future.
:ethanol co-solvent for variable periods of time. By varying the water:ethanol ratio and the amount of 4-mercaptobenzoic acid (4-MBA) present, the aggregation rate can be systematically controlled. Thiolated poly(ethylene glycol) was then added to halt the aggregation process and provide steric stability. This approach was used to produce pH nanoprobes with excellent colloidal stability in high ionic strength environments and in complex samples. The pH probe exhibits broad pH sensitivity over the range 6–11 and we calculate that a single AuNP dimer in a 35 fL volume is sufficient to generate a detectable SERS signal. As a proof-of-concept, the probes were used to detect the intracellular pH of human prostate cancer cells (PC-3). The internalized probes exhibit a strong 4-MBA signal without any interfering bands from either the cells or the culture media and produce exceptionally detailed pH maps. pH maps obtained from 19 xy surface scans and 14 yz depth scans exhibit highly consistent intracellular pH in the range of 5 to 7, thus indicating the greater reliability and reproducibility of our pH probes compared with other probes previously reported in the literature. Our water:ethanol co-solvent production process is fast, simple, and efficient. Adjustment of solvent composition may become a powerful way to produce SERS tags or nanoprobes in the future.
Introduction
Gold nanoparticles (AuNPs) are widely used for surface-enhanced Raman scattering (SERS) based sensing due to their strong localized surface plasmon resonance (LSPR), low toxicity, and long-term stability.1–5 It is generally accepted that the largest SERS signals or “hot spots” are generated in the narrow gap between two AuNPs as a result of the strong electromagnetic coupling in that region.6,7 Reproducible production of SERS “hot spots” is non-trivial and requires that AuNP aggregation be neither too minimal (leaving too many monomers and a weak signal), nor too extensive (resulting in an unstable colloid). Controlled aggregation as a mechanism to produce “hot spots” has attracted extensive research attention and the use of small organic molecules as nanoparticle linkers has been deemed to be one of the more efficient ways to bridge nanoparticles.8–14 For example, Taylor et al. used a cucurbit [n]uril “glue” to produce reproducible and controlled AuNP aggregates with a gap distance of 0.9 nm.13 Aggregation inducers occupy a portion of the “hot spot” volume and generate peaks in the SERS spectrum. For this reason, SERS nanoprobes (defined as an AuNP multimer containing two or more AuNP monomers) are often produced using a Raman active linker. We and others have illustrated that malachite green isothiocyanate (MGITC), 2-aminothiolphenol (2-ATP), and 3,5-dimercaptobenzoic acid linkers can produce nanoprobes with intense, but reproducible SERS signals.8,11,15 One substantial challenge, however, is that not all desired SERS applications utilize organic molecules that induce aggregation and bridge nanoparticles.To date, a number of nanoparticles for SERS based determination of pH have been reported in the literature.8,14–22 The pH sensing capacity of these nanoparticles is generally realized via surface functionalization of the particle with a pH sensitive molecule whose SERS spectrum changes as a function of pH. For example, 4-aminothiolphenol, 2-aminothiolphenol, 3-amino-5-mercapto-1,2,4-triazole, and 4-mercaptobenzoic acid (4-MBA) are often employed due to the pH sensitivity of the SERS band of the amine or carboxyl groups of these molecules. Amongst these, 4-MBA exhibits a broad pH sensitive range, simple structure, high photochemical stability, and thiol mediated AuNP surface affinity.16,21–24 Arguably the most common way to synthesize 4-MBA-AuNPs is to dilute a concentrated 4-MBA ethanol solution in an aqueous AuNP suspension.16,23,25 Unfortunately, 4-MBA does not effectively induce AuNP aggregation and thus the SERS probes produced by this approach exhibit a weak and irreproducible signal. Lawson et al. improved probe reproducibility and signal intensity by utilizing 3,5-dimercaptobenzoic acid as both the pH indicator and aggregation inducer.8 However, the three step organic reaction required for the synthesis of 3,5-dimercaptobenzoic acid is mechanistically challenging and thus not feasible for widespread use. While there is substantial interest in the production and potential application of SERS based pH sensors, the syntheses reported to date have generally resulted in particles of only transient colloidal stability and weak signal due to the limited ability for the aforementioned molecules to induce nanoparticle aggregation and form stable nanoprobes.
Past studies have shown that AuNPs aggregate more rapidly in the presence of ethanol than in water due to the lower polarity of the alcohol.26 We hypothesized that addition of ethanol to an aqueous suspension of AuNPs would reproducibly change the solvent properties and thus enable controlled AuNP aggregation. Such an approach has three potential advantages: (1) coordinated changes in solvent properties should enable control of the aggregation rate such that reproducible aggregates can be produced both in the presence and absence of a SERS active organic molecule; (2) once stable aggregates are formed, excess ethanol can be removed by centrifugation; and (3) because no complicated organic syntheses are required, this method may be more sustainable and thus more cost-efficient than many extant methods. With this rationale, we set out to test whether a water:ethanol co-solvent system could be used to control AuNP aggregation and produce AuNP-based SERS nanoprobes.
Through the use of water:ethanol co-solvent mixtures we can systematically produce AuNP multimers of controlled size (Scheme 1). Multimers of size appropriate for SERS were formed in 50:50 water:ethanol co-solvent and then following functionalization with a protective HS-PEG layer a highly stable SERS pH probe was produced. Compared with previously used BSA and silica coatings, PEG has a long hydrophilic chain that does not inhibit proton diffusion to the SERS hot spots.19,25 This pH nanoprobe illustrates high SERS activity, high pH sensitivity, a broad pH sensitive range, and excellent stability in high ionic strength environments. To our knowledge this is the first time that co-solvents have been used for SERS pH probe production. This approach can be easily extended to produce numerous types of SERS probes through controlled adjustment of co-solvent type and concentration.
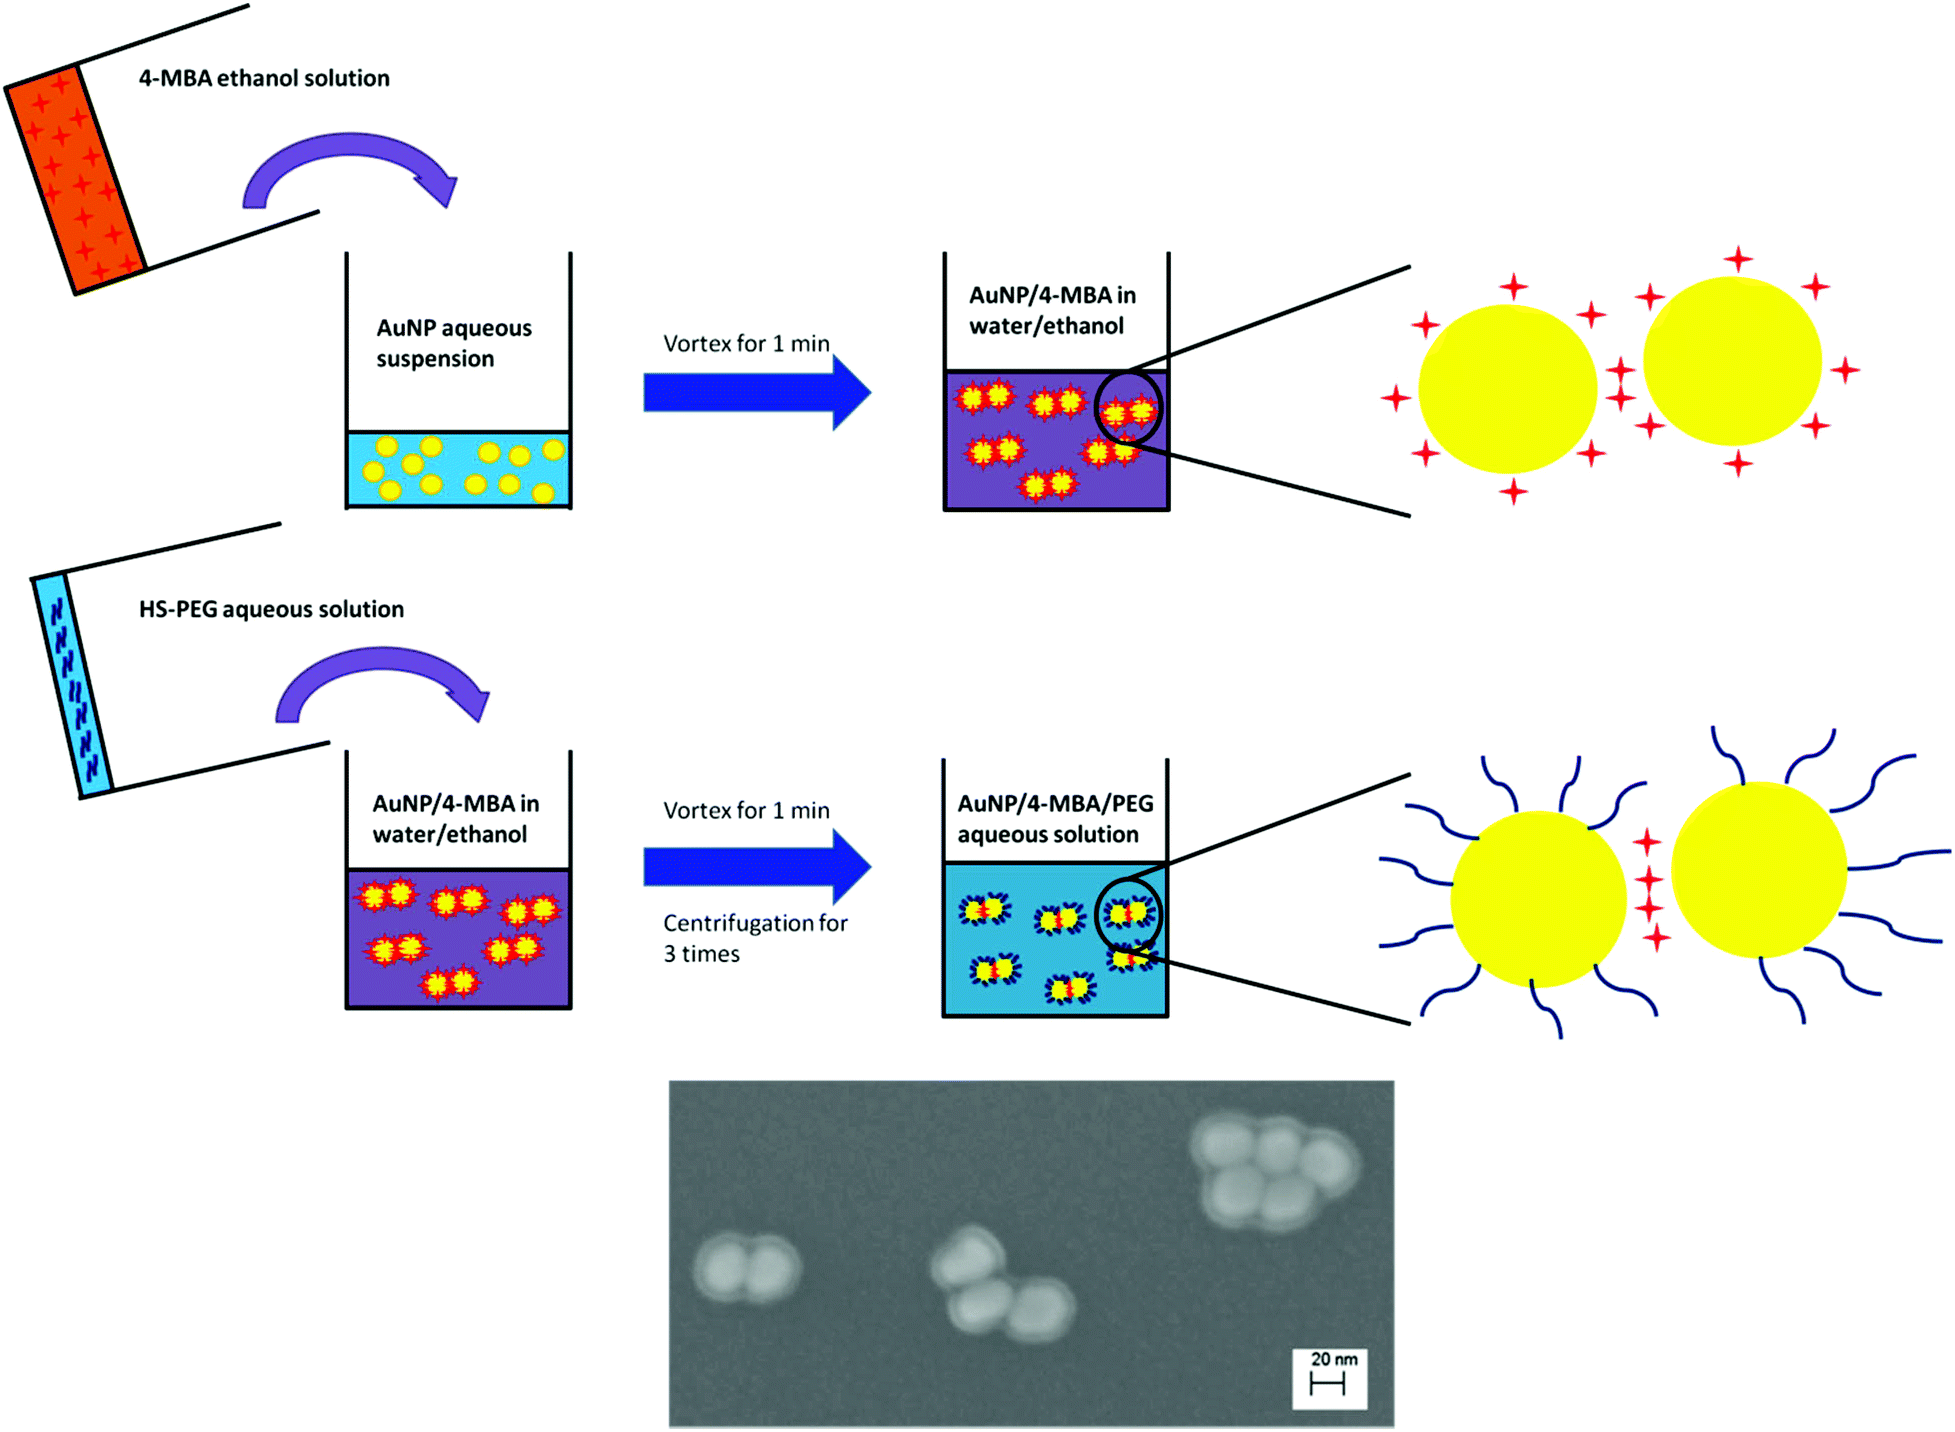 | ||
| Scheme 1 Production of AuNP/4-MBA/PEG nanosensor. | ||
Experimental section
Materials
Gold chloride trihydrate (HAuCl4·3H2O), sodium citrate tribasic dihydrate (Na3Citrate·2H2O), 4-mercaptobenzoic acid (4-MBA), and phosphate buffer (PB) solution were purchased from Sigma-Aldrich. Thiolated poly(ethylene glycol) (HS-PEG; 5 kDa) was purchased from Nanocs. Anhydrous ethanol was purchased from Fisher Scientific.AuNP synthesis
AuNPs were synthesized using the seed-mediated approach. Briefly, 13 nm gold nanoparticle seeds were synthesized according to Frens.27 Na3Citrate·2H2O (final concentration 3.88 mM) was added to 100 mL of boiling 1 mM HAuCl4·3H2O under vigorous mixing conditions. The reaction was allowed to run until the solution color changed to wine red, indicating completion. During seed synthesis the pH was controlled at 6.2–6.5 to improve their monodispersity.28 Following seed synthesis, 35 nm AuNPs were synthesized by seed-mediated growth.29 A 250 mL flask containing 100 mL of HAuCl4·3H2O solution (0.254 mM) was heated to boil under vigorous stirring. To this flask was added 2.02 mL seed suspension and 0.44 mL Na3Citrate·2H2O (final concentration 0.17 mM). After a 40 min reaction time the flask was cooled to room temperature.AuNP aggregation in water![[thin space (1/6-em)]](https://www.rsc.org/images/entities/h3_char_2009.gif) :ethanol co-solvent
:ethanol co-solvent
AuNPs suspended in water:ethanol mixtures of varying ethanol content were prepared by adding 0.5 mL of a water:ethanol mixture (ethanol content 0–100%) to 0.5 mL of aqueous AuNP suspension. The mixture was then vortexed for 1 min to ensure complete mixing of the components. The kinetics of AuNP aggregation in the water:ethanol mixtures were investigated by monitoring the variation in the UV-VIS extinction spectra and the DLS determined hydrodynamic diameter over a two day period. 4-MBA-AuNPs in water:ethanol co-solvent were prepared by adding 0.5 mL 4-MBA in ethanol (100 μM) to 0.5 mL AuNP aqueous suspension. We emphasize that the 4-MBA solution and the AuNP suspension were mixed at a 1:1 volumetric ratio. Equal volume mixing of the two components results in more homogeneous adsorption of 4-MBA and more highly controlled AuNP aggregation.30 The aggregation kinetics of 4-MBA functionalized AuNPs in water:ethanol co-solvent were investigated by both UV-VIS extinction spectra and DLS. SERS spectra of 4-MBA-AuNPs in solutions with different ethanol contents were collected at 100 min after the mixing of 0.5 mL of the AuNP suspension and 0.5 mL of 4-MBA solutions with ethanol contents of 12.5–100%.
Production of colloidally stable SERS pH probes
The procedure for production of our SERS probe is shown in Scheme 1. First, 0.5 mL of 100 μM 4-MBA in ethanol was added to 0.5 mL of aqueous AuNP suspension and then fully mixed by vortexing. After 10, 55, 100, or 140 min, 100 μL of HS-PEG aqueous solution (500 μM) was added to the mixture. The suspension was kept for 20 min at room temperature and subsequently washed by centrifugation 3× to remove excess 4-MBA, HS-PEG, and ethanol. Following centrifugation, the supernatant was discarded and the sediment was redispersed in 1 mL water.Evaluation of the sensitivity and stability of the pH probe
To evaluate the pH sensitivity of our probe, 1 mL of probe was added to 1 mL of PB solution (20 mM) with different pH. The pHs of the mixtures were also measured by a commercial pH meter (Accumet AB15 plus, Fisher Scientific) and their corresponding SERS spectra were recorded. A pH calibration curve was produced by plotting the change in the SERS spectra versus pH. To evaluate the colloidal stability of the probe, 1 mL probe was added to 1 mL PB solution (20 mM) and variations in DLS determined hydrodynamic diameter, UV-VIS extinction spectra, and pH indicator values were monitored for one hour. To further test the capacity of the probe (200 μL) it was also added to 800 μL of two different soft drinks (Fanta orange and club soda) and tap water. SERS spectra were acquired and the derived pH values were compared with those measured by the commercial pH meter.Intracellular pH monitoring
A human prostate cancer cell line, PC-3, was cultured in F-12K Medium (Kaighn's Modification of Ham's F-12 Medium) (ATCC) supplemented with 10% fetal calf serum and 1% penicillin/streptomycin. Cells were grown to confluence in an incubator at 37 °C with 5% CO2 prior to harvesting using trypsin/EDTA. A cell concentration of 2.4 × 10⁴ cells per mL was then seeded into a 6-well plate. Cells were then incubated overnight in an incubator at 37 °C with 5% CO2. Each well was then inoculated with 20 μl of nanoprobes and left in the incubator overnight. After approximately 24 hours the cells were washed three times with PBS before being imaged.Instrumentation
Pristine AuNP size (35 ± 1 nm, n = 40) was measured by field-emission scanning electron microscopy (FESEM, LEO (Zeiss) 1550) and transmission electron microscopy (TEM, JEOL JEM-1400) with the assistance of Image J (Fig. S1†). Pristine AuNP size (39 nm) was also measured by dynamic light scattering (DLS, Nano Zetasizer, Malvern). The LSPR of the AuNPs as well as AuNP aggregates was characterized by UV-VIS spectroscopy (Cary 5000, Agilent). Raman spectra were acquired by a Raman spectrometer (Alpha500R, WITec) with a 10× objective and 0.5 s integration time. The 785 nm laser light was dispersed by a 300 gr mm−1 grating and detected by a Peltier CCD. Each Raman spectrum reported (unless noted otherwise) was an average of 400 single spectra acquired across a 1000 μm × 1000 μm Raman map. The cells were directly imaged in the 6-well plate using a 785 nm laser, 50× objective and a 0.05 second integration time.SERS data processing
The SERS data for the calibration curve and cell experiments was imported into MATLAB® 2015b (The Mathworks, USA). The spectra were first baseline corrected using an asymmetric least squares fitting,31 the intensities of the peaks of interest (1084 cm−1, 1410 cm−1 and 1710 cm−1) were tracked and ultimately ratios between the pH insensitive and pH sensitive peaks were plotted (Fig. 3B and S-13†). A calibration curve with a Boltzmann fit was established using Origin 8.0 to describe the relationship between the pH and SERS peak ratios. The pH was then calculated at each of the points in the SERS maps and a visual representation was rendered in Matlab (Fig. 4). The data from all the cell experiments was further compiled and analyzed in Matlab.Results and discussion
Controlled AuNP aggregation in water:ethanol co-solvent
AuNPs synthesized by sodium citrate reduction are stable in the absence of salt due to the negative charge imparted by surface associated citrate and its degradation products.28,32 Ethanol, however, is known to induce AuNP aggregation due to dipole–dipole attractive interactions.26 Herein, we observed that changes in the ethanol co-solvent concentration greatly affected AuNP size and colloidal stability. For ethanol co-solvent concentrations of 0–25% the hydrodynamic diameter proportionally increased with the ethanol content (Fig. S2†). AuNP multimers produced in water:ethanol co-solvent mixtures below 50:50 were stable over a two day period, while those produced at a 50:50 water:ethanol ratio exhibited more extensive aggregation. Because aggregate formation is vitally important for “hot spot” formation and SERS nanoprobe production, we focused on the 50:50 water:ethanol mixture (referred to as a water:ethanol co-solvent hereafter).
An immediate increase in the AuNP hydrodynamic diameter from 39 to 150 nm was observed in water:ethanol co-solvent, while no change was observed in water alone (Fig. 1A). In co-solvent, the AuNP hydrodynamic diameter increased slowly from 150 to 188 nm during the first hour. After two days the AuNP size ultimately reached 236 nm and the colloid was colloidally stable (Fig. S2† and inset of Fig. 1A). We attribute the rapid AuNP aggregation in water:ethanol co-solvent to the systematic variation of the solvent dielectric constant. As shown in eqn (1), the electrostatic repulsive force (Velec) supporting AuNP stability is proportional to the solvent dielectric constant ε when other parameters (φ is the surface potential, h is the gap between two particles, and k is the inverse of Debye length) remain constant.33 Addition of ethanol (ε = 24.4) to water (ε = 80.1) leads to a smaller dielectric constant in co-solvent than in water alone, which in turn decreases the electrostatic repulsive force between AuNPs.
| Velec = 2πεaφ2ln(1 + e−kh) | (1) |
 | ||
| Fig. 1 (A) Temporal variation of the DLS determined hydrodynamic diameter of AuNPs dispersed in water and 50:50 water:ethanol in the presence and absence of 4-MBA; inset photos are of AuNPs in water and 50:50 water:ethanol after two days; (B) temporal variation in the extinction of the primary LSPR band for AuNPs dispersed in water and 50:50 water:ethanol in the presence and absence of 4-MBA; (C) extinction spectra of AuNPs in water:ethanol as a function of time, and (D) extinction spectra of AuNPs in water:ethanol:4-MBA as a function of time. | ||
4-MBA functionalized AuNPs exhibited completely different aggregation kinetics compared with the pristine AuNPs. The 4-MBA-AuNP hydrodynamic diameter slightly decreased in the initial ∼40 min and then increased from 40 to 180 min, thus indicating that aggregation is minimal for the first ∼40 min and then proceeded more rapidly until the colloids were no longer colloidally stable. Control suspensions of AuNPs and 4-MBA-AuNPs in DI water exhibited no sign of aggregation (Fig. 1A).
UV-VIS spectroscopy results are consistent with the DLS data. The extinction spectra of AuNPs in water:ethanol co-solvent exhibited a primary LSPR band at 535 nm and a secondary LSPR band at ∼650 nm, thus indicating AuNP aggregation (Fig. 1C). As time increased from 0 to 60 min, the primary LSPR band gradually decreased in magnitude, while the secondary band simultaneously increased (Fig. 1C). To quantitatively illustrate this change we plot the height variation of the primary LSPR band as a function of time in Fig. 1B. This figure demonstrates that AuNP aggregation in water:ethanol co-solvent occurs rapidly at the beginning and then occurs more slowly, thus resulting in the long-term stability of the suspension.
Similar to the DLS results, the extinction spectra of 4-MBA-AuNPs in water:ethanol co-solvent exhibited different time-dependent variation relative to pristine AuNPs (Fig. 1B & D). Over the first 40 min, the spectra remained almost constant, thus indicating no obvious aggregation. Following this short delay, the LSPR band at 535 nm decreased at a rate comparable to the increase in the intensity of the band at 650 nm until 2 h. After 2 h, the bands at 535 nm and 650 nm decreased, while a third band at 750 nm developed. Unlike pristine AuNPs, the 4-MBA-AuNPs in water:ethanol co-solvent were initially stable and then once aggregation was initiated it proceeded until the colloidal stability was completely lost by 12 h (data not shown). We attribute the delay in aggregation to the increase in solvent dielectric constant that occurs due to addition of a high concentration of 4-MBA (100 μM), which in turn results in an increase in Velec (eqn (1)). At extended reaction times increasingly larger amounts of 4-MBA have adsorbed onto the AuNPs and this leads to a decrease in the local dielectric followed by the onset of aggregation. Such speculation is supported by the fact that no delay in the onset of aggregation was observed when the 4-MBA concentration was decreased by 10×, 100×, or 1000×, thus suggesting that low 4-MBA concentrations are insufficient to change the local dielectric (Fig. S3†). For low 4-MBA concentrations, the initial AuNP size is highly dynamic because of rapid initial aggregation (data not shown). Because of the delay in the onset of aggregation that occurs in the presence of high 4-MBA concentrations, the point at which aggregation is initiated can be easily pinpointed and the entire aggregation process can be well controlled.
The extinction spectra of the AuNPs and 4-MBA-AuNPs in water remain stable over a three-hour period (Fig. S4†), thus demonstrating the important role of ethanol to accelerate aggregation. The role of 4-MBA in AuNP aggregation in water:ethanol co-solvent can thus be concluded: (1) to stabilize the colloid in the first 40 min due to the increase in solvent dielectric constant; (2) to promote aggregation after 40 min due to the decreased stabilizing capacity of 4-MBA relative to the citrate AuNP surface coating. The synergistic interplay between the ethanol and 4-MBA concentrations in dictating AuNP aggregation enables reproducible and stable pH probe production, as shown in the following sections.
SERS of 4-MBA-AuNPs in water:ethanol co-solvent
The variation in the SERS spectra for 4-MBA-AuNPs in water:ethanol co-solvent was monitored every 6 min for 3 h (Fig. 2). At t = 0, only the ethanol spectrum was apparent with a prominent band at 886 cm−1. The intensity of this band remained constant over the 3 h reaction period because of the fixed ethanol content. With time, the characteristic bands of 4-MBA (528, 698, 1084, 1286, and 1597 cm−1) appeared and increased in magnitude from 0 to 168 min (Fig. 2A). In comparison, the Raman bands of 4-MBA-AuNPs in water alone were approximately 260× weaker than in water:ethanol co-solvent. Such a result highlights the importance of producing multimers containing “hot spots” to achieve an intense SERS signal and succinctly illustrates the important role that ethanol plays in AuNP aggregation and in the generation of a strong 4-MBA SERS signal.
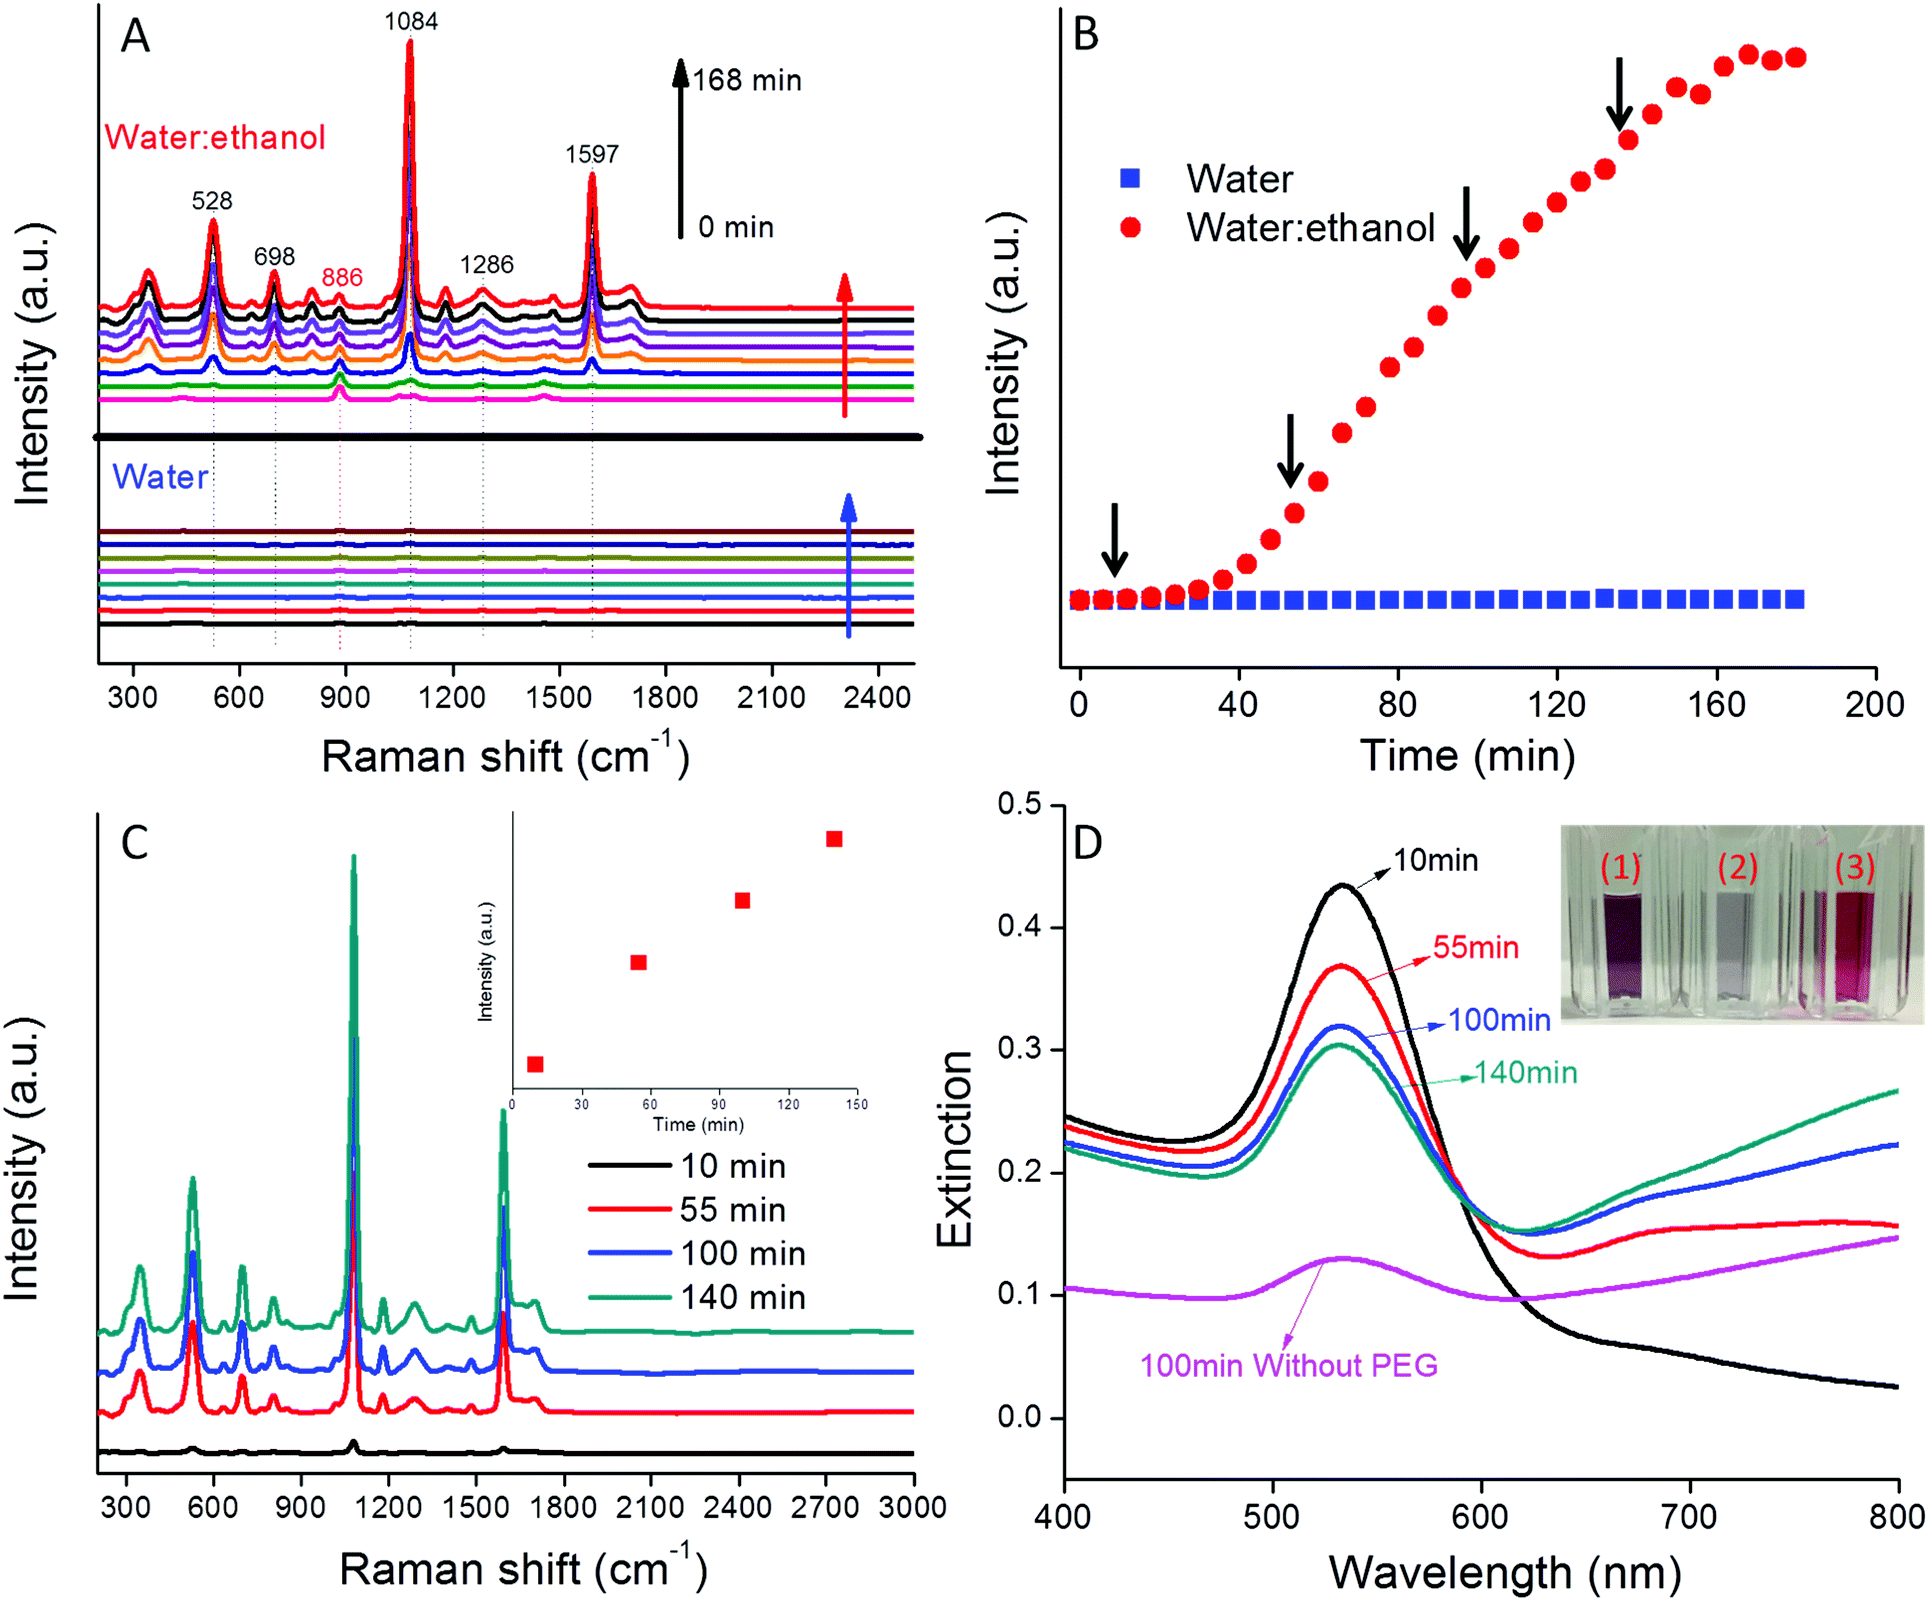 | ||
| Fig. 2 (A) Selected SERS spectra of 4-MBA-AuNPs in water and water:ethanol mixture over three hours; (B) SERS intensity variation of band at 1084 cm−1 as a function of time; (C) SERS spectra of 4-MBA-AuNPs after PEG coating at different times; (D) UV-VIS extinction spectra of 4-MBA-AuNPs coated with HS-PEG at different times as well as without the HS-PEG coating; inset is the photo of (1) AuNP monomer colloid, (2) 4-MBA-AuNPs without HS-PEG coating after centrifugation; and (3) 4-MBA-AuNPs with HS-PEG coating after centrifugation. | ||
To quantitatively show the time-dependent variation in SERS signal, the intensities of the Raman band at 1084 cm−1 for 4-MBA-AuNPs in water and in water:ethanol co-solvent were compared (Fig. 2B). In water:ethanol co-solvent, the SERS intensity was constant for the initial 40 min, a period that corresponds to the aggregation delay depicted in Fig. 1A & B. This result demonstrates that AuNP aggregation is crucial for the generation of a strong SERS signal. Between 40 and 160 min, the SERS intensity increased steadily, due to enhanced coupling between the developing LSPR band in the NIR region and the 785 nm incident laser wavelength (Fig. 1D).11 Between 160 and 180 min the SERS intensity plateaued, a result that may be due to the depletion of sufficient numbers of AuNP monomers to feed the growing multimer population (Fig. 2B). We note that all the 4-MBA Raman bands varied simultaneously with a change in aggregation state, thus indicating aggregation state had no influence on the peak ratios, a result that is consistent with the literature.19
The SERS spectra of 4-MBA-AuNPs in suspensions with different ethanol contents were also collected. As shown in Fig. S5,† the SERS signal generally decreased with a decrease in ethanol content, which was attributed to the ineffective aggregation of AuNPs in solutions with lower ethanol. There is a substantial SERS signal enhancement when the ethanol content increased from 25–50%. This result indicates that the ethanol content threshold that can effectively induce AuNP aggregation lies in between 25–50%, a conclusion which is supported by the results in Fig. S2.† Overall, these results suggest that the change of solution dielectric constant induced by ethanol can be effectively applied to control AuNP aggregation and thus enhance SERS signal development.
Production of colloidally stable SERS pH probe
Uncontrolled aggregation and flocculation limit the broad application and use of most of the currently described SERS pH probes.15,16,23 A stable pH probe with broad pH sensitivity is desired to enhance reproducibility and enable real world applications. HS-PEG is recognized for its capacity to sterically stabilize AuNPs and thus we used it as a means to stabilize our nanoprobes.34 We specifically investigated the addition of HS-PEG to arrest nanoprobe aggregation. Accordingly, HS-PEG was added to aliquots of the reacting system depicted in Fig. 2B at the times denoted by the black arrows (10, 55, 100, and 140 min). Each of these times corresponds to a different extent of aggregation and thus variable SERS intensity. Two days after adding HS-PEG, the 4-MBA-AuNP extinction spectra remained virtually unchanged, thus indicating that HS-PEG can effectively quench the aggregation of the 4-MBA-AuNPs in water:ethanol (Fig. S6†).
After addition of HS-PEG, the nanoprobes were washed by centrifugation three times to remove excess 4-MBA, HS-PEG, and ethanol. Following each centrifugation, the supernatant was discarded and the solids were redispersed in water. Assuming each 4-MBA molecule occupies a 0.2 nm2 area on the AuNP surface, the maximum number of 4-MBA molecules each AuNP can hold is 24000.22 Under our synthesis conditions the concentration of 4-MBA exceeded 300000 molecules per AuNP and thus the AuNP surface should be saturated by 4-MBA. The added amount of HS-PEG was of similar concentration to that of 4-MBA and there was some concern that HS-PEG could replace 4-MBA on the AuNP surface and thus lower the SERS intensity. However, as shown in Fig. S7,† the addition of HS-PEG had no detrimental effect on the measured SERS intensity. This result suggests that HS-PEG either does not replace surface associated 4-MBA or does so only on the periphery of the AuNP clusters and not within the “hot spots” responsible for the intense SERS signal. Of these two hypotheses, the latter is supported by SEM images that illustrate 4-MBA-AuNP clusters consistently wrapped by a ∼5.6 nm thick PEG layer (a thickness consistent with the 5k molecular weight35), but with interparticle junctions of only a few angstroms that are consistent with the expected spacing for SERS “hot spots” (Scheme 1). These results are corroborated by TEM images that show small AuNP clusters with PEG coatings (Fig. S1C & D†).
The absence of a peak at 886 cm−1 in the spectra for the washed probes (Fig. 2C) indicates that a majority of the ethanol initially present in the system was removed by centrifugation. We note that it is highly advantageous that the reagent used to induce AuNP aggregation can be easily removed following probe synthesis since it then does not occupy the SERS “hot spot” volume. The SERS intensity increased almost linearly with the coating time (inset of Fig. 2C), which is consistent with the trend observed in the absence of the HS-PEG coating (Fig. 2B).
UV-VIS extinction spectra of HS-PEG coated 4-MBA-AuNPs after centrifugation are shown in Fig. 2D. With an increase in the HS-PEG coating time, the LSPR band at 535 nm gradually decreased while the band in the NIR region gradually increased, leading to the increase in SERS intensity (Fig. 2C). As a negative control, 4-MBA-AuNPs without HS-PEG were also washed by centrifugation. After washing, the extinction spectrum became almost flat (Fig. 2D) and the colloid color significantly faded (inset of Fig. 2D), thus indicating that most of the 4-MBA-AuNPs were lost by the irreversible formation of large aggregates during centrifugation. As a comparison, the colloid with a HS-PEG coating showed dark purple color (inset of Fig. 2D), highlighting the important role of HS-PEG for colloid stability. An ideal pH probe should be able to generate high SERS intensity as well as stay suspended in water for an extended period of time (i.e., the aggregates cannot be too large). Balancing these two aspects, 4-MBA-AuNPs coated with HS-PEG at 100 min were selected as the best pH probe and further tested.
pH nanoprobe sensitivity and stability
The pH sensitivity of our nanoprobe was tested in phosphate buffer (PB) solutions of different pH. As shown in Fig. 3A, the SERS spectra varied with pH. The bands at 1410 (–COO−) and 1710 cm−1 (–COOH) increased or decreased in intensity, respectively, as well as slightly shifted with an increase of solution pH, while the Raman band at 1084 cm−1 (benzene ring) remained constant. This result indicates that the protective PEG layer is permeable to H+ and does not detrimentally affect the pH sensitivity of the probe. We note that this probe exhibits high SERS intensity at both extremely acidic (pH = 1.2) and basic (pH = 12.6) conditions. These high ionic strength conditions normally result in colloidal instability, thus the high signal intensities demonstrate the excellent stability conferred by the PEG coating (Fig. S8†).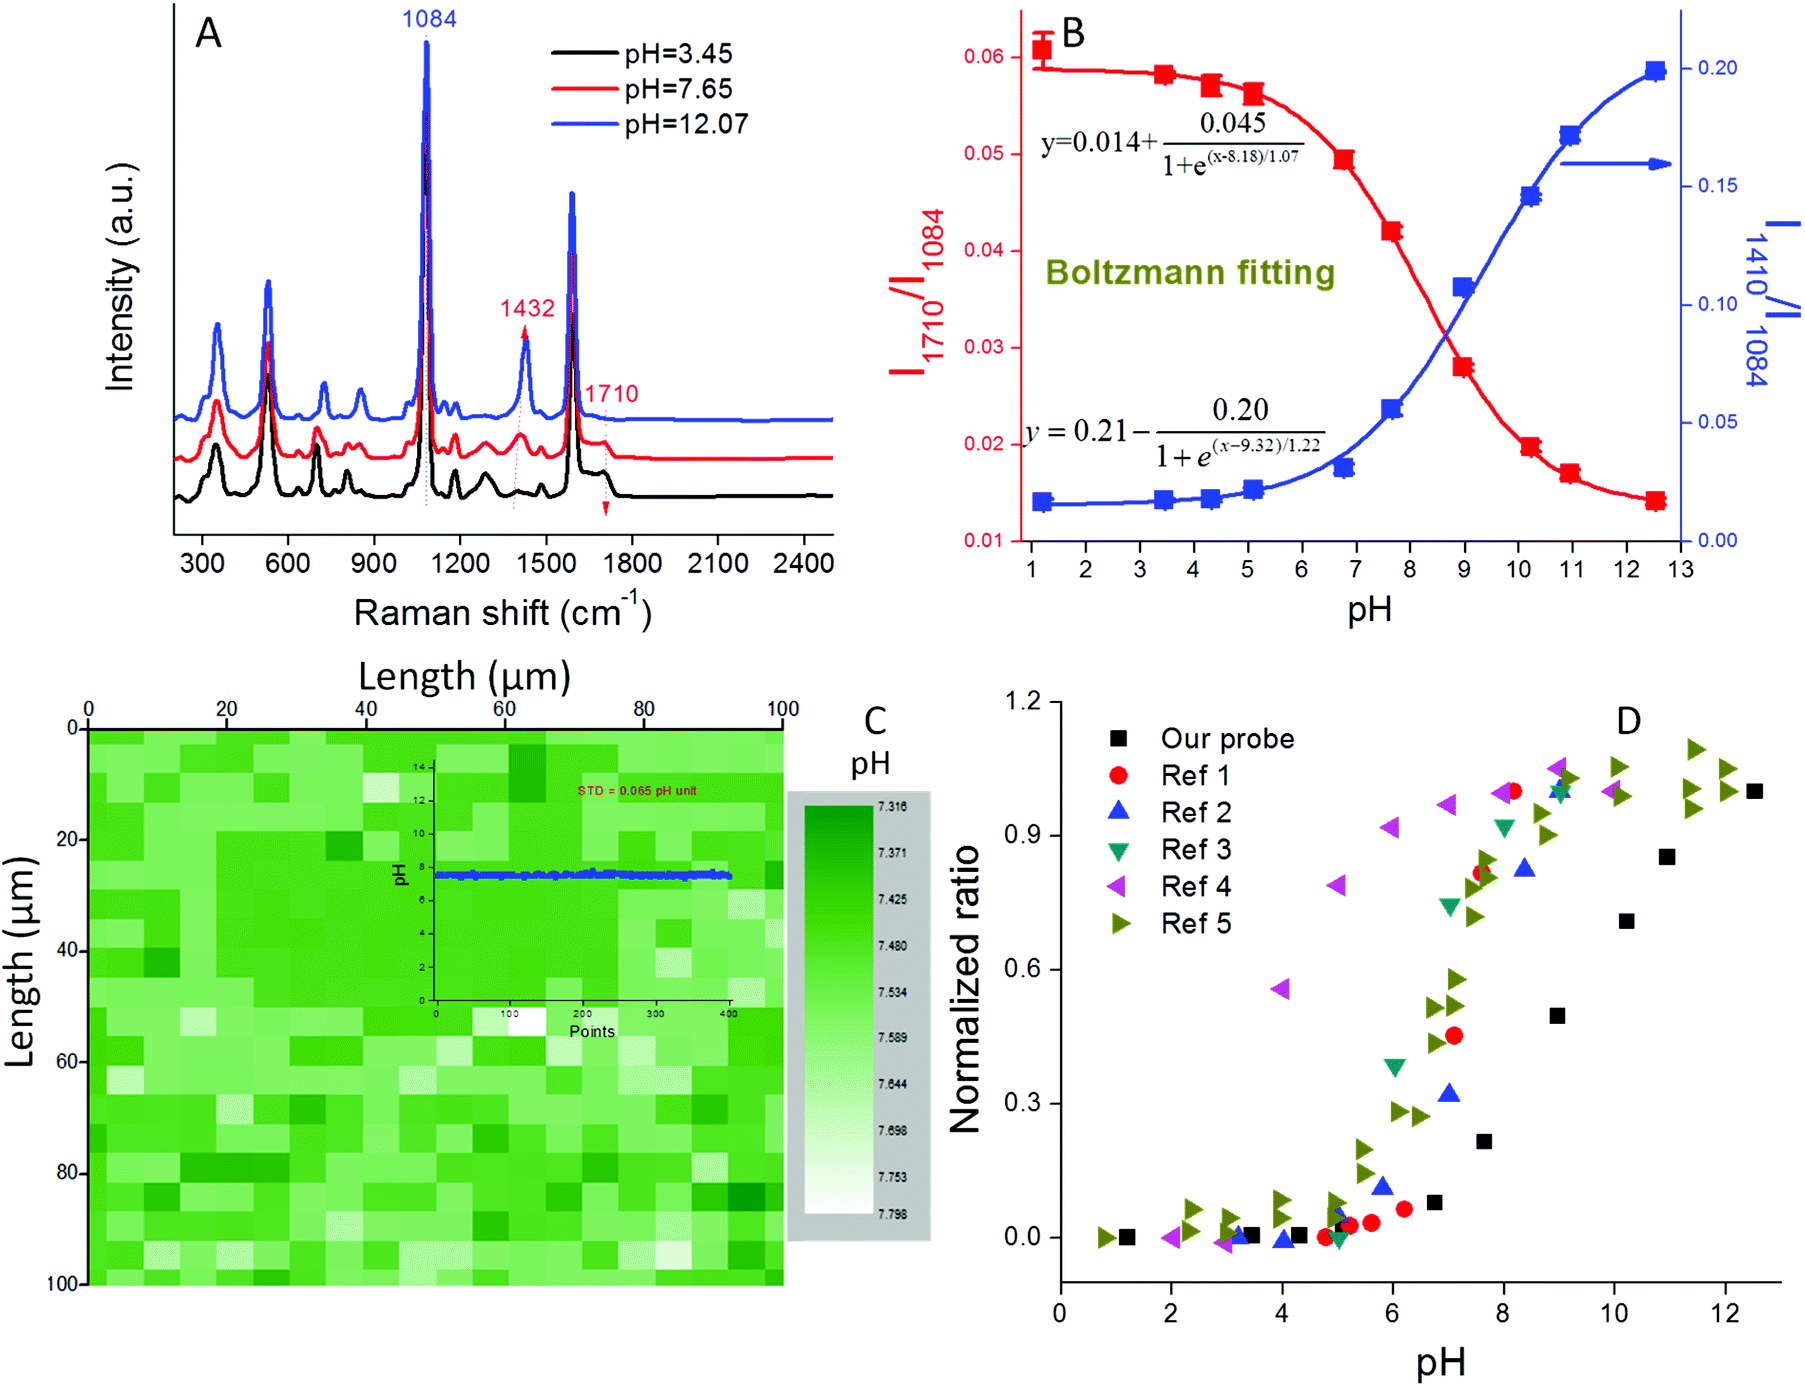 | ||
| Fig. 3 (A) SERS spectra of pH probe in PB buffer of different pH; (B) pH calibration curve in the range 1–13; (C) a Raman map containing 400 pixels, each pixel shows a pH value for a 3.5 × 10⁻¹¹ mL volume; inset figure: pH value variation of the 400 pixels from the Raman map; (D) pH calibration curves from both our study and the literature for 4-MBA functionalized pH probes. The curves are normalized to their maximum values.14,16,21,23,25 | ||
Ratios of each of the pH-sensitive peaks (1410 cm−1 or 1710 cm−1) relative to the pH-insensitive peak (1084 cm−1) were plotted as a function of pH from 1 to 13 (Fig. 3B). In the acidic pH range of 1–6 and the basic range of 11–13, the intensity ratios (I1410/I1084 and I1710/I1084) increase or decrease minimally, while in the 6–11 pH range, the ratios change much more dramatically, thus indicating that this is the most sensitive pH range for this probe. The pH calibration curves could be perfectly fitted using the Boltzmann expression (Fig. 3B) that has been previously applied to fit sigmoid shaped pH curves.24 The linear portion of the curve covers five pH units, a range that is much broader than those reported in the literature for other 4-MBA based nanoprobes (Fig. 3D). This result can be attributed to both the high SERS intensity of our probes and their unique colloidal stability. We note that the derived pKa value (8.75) is nearly 4 pH units higher than that of bulk 4-MBA (4.79). Such a large pKa discrepancy between nanostructure associated 4-MBA and its bulk value has been previously reported and can be attributed to changes in surface topography and electron density.36,37 pH measurements obtained with this nanoprobe are highly reproducible (STD < 5% for three parallel measurements) due to their well controlled aggregation and stability (Fig. 3B).
Most recently, Zheng et al. utilized bovine serum albumin (BSA) to stabilize their pH nanoprobes.19 However, due to the nonspecific mechanism by which BSA associates with the nanoprobes, the resulting nanoprobes were difficult to reproduce and had limited shelf stability. Importantly, Zheng et al. attributed the majority of their SERS signal to the presence of small numbers of dimer and trimer AuNP aggregates that formed following BSA addition. Such a result supports our focus on the systematic production of colloidally stable AuNP aggregates of fixed size. Wang et al. developed silica shell-coated AgNP pH probes and successfully prevented BSA from contaminating the AgNP surface.25 However, the reverse microemulsion method utilized for this synthesis is chemical-intensive and time-consuming. Also the silica shell limited the diffusion of protons to the AgNP surface, making the pH sensitive range very narrow (pH 3–6). We note that none of the previously reported probes exhibit stability over the broad pH range of 1–13 that we report here.
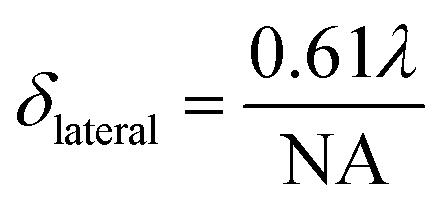
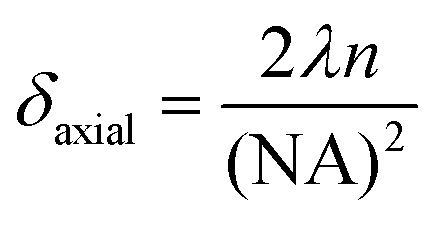
A significant advantage of nano-sized pH probes is their capacity to provide high spatial resolution and their potential to quantify pH within microenvironments. The laser spot size of a Raman microscopy system limits the resolution that can be achieved by a SERS probe. For our probe and our microscope objective this spot size is described in the lateral (δlateral = 1.6 μm) and axial (vertical) dimensions (δaxial = 17.4 μm) using eqn (2) and (3), where λ is the laser wavelength, and NA (numerical aperture) is the characteristic parameter of an objective. Assuming a cylindrical laser spot, the minimum volume that can be detected is 35 fL. This volume is much smaller than that can be detected by commercial pH meter.
 | (2) |
 | (3) |
A 1000 μm × 1000 μm Raman map collected in PB solution contains 400 pixels as shown in Fig. 3C. Using the pH calibration curve in Fig. 3D, a pH map illustrates the pH value within the 35 fL volume derived from a single Raman spectrum. As shown in Fig. S9,† such a single spectrum exhibits an excellent signal-to-noise ratio. Because the concentration of AuNPs used in this study is known (1.3 × 10¹¹ mL−1) each detection volume contained on average 2.3 NPs. This result demonstrates that each multimer exhibits extremely high SERS intensity. When all 400 pH values from the Raman map were plotted (inset to Fig. 3C), an extremely flat line was obtained. The small standard deviation (STD = 0.065 pH units) demonstrated the high pixel-to-pixel reproducibility of the SERS spectra. The pH sensitivity of our probe is defined as three fold of the STD,38i.e., about 0.2 pH units.
Probe stability is important for real world application of AuNP-based pH probes. The HS-PEG coating is expected to prevent AuNP aggregation and nonspecific chemical adsorption on the AuNP probes, thus improving both the spatial and temporal reproducibility of the probe response. To evaluate their stability, the probes were suspended in PB solution (0.01 M) and the variation of their extinction spectra, size, and pH indicator values (I1410/I1084 and I1710/I1084) were monitored for one hour. As shown in Fig. S10A–C,† the extinction spectra, hydrodynamic diameter, and pH indicator values each remained constant during one hour thus indicating that the probes were highly stable in pH buffer. In addition, the stability of the probe was tested in two soft drinks (Fanta orange and club soda) and tap water. As shown in Fig. S10D,† the pH values measured by our pH probe are consistent with those measured by a commercial pH meter. Impressively, the probes generated high quality and reproducible SERS spectra in each of these matrices, thus indicating that they were very stable in these complex matrices and that the other constituents present exhibited no interferences to probe response (Fig. S11†).
Intracellular pH monitoring
As a proof-of-concept, we utilized our pH probes to detect the intracellular pH of the clinically relevant PC-3 human prostate cancer cell line. Nanoparticle uptake by PC-3 cells has been demonstrated numerous times in the literature39 with endocytosis, a broad term encompassing many distinct pathways, considered the predominant method of AuNP uptake.40,41 Briefly, our pH probes were incubated with PC-3 cells for 24 hours, washed, and then imaged using Raman spectroscopy. As shown in Fig. 4A, the sizes and shapes of the cancer cells were heterogeneous, as expected for an adherent cell-line incubated for nearly two days.42 The most prominent 4-MBA Raman band (1084 cm−1) was used to identify the internalized nanoprobe locations and as shown in Fig. 4B, the probe position was co-located with that of the cancer cells. Intracellular localization of the nanoprobes was verified by depth scanning (Fig. S12†). The nearly uniform SERS intensity within the cell, ∼25 μm in depth, provides evidence that the probes were located inside the cell and not on the cell surface. These results demonstrate that the cancer cells can easily take up the pH sensitive PEG-4-MBA-AuNP probes described herein and can be readily imaged.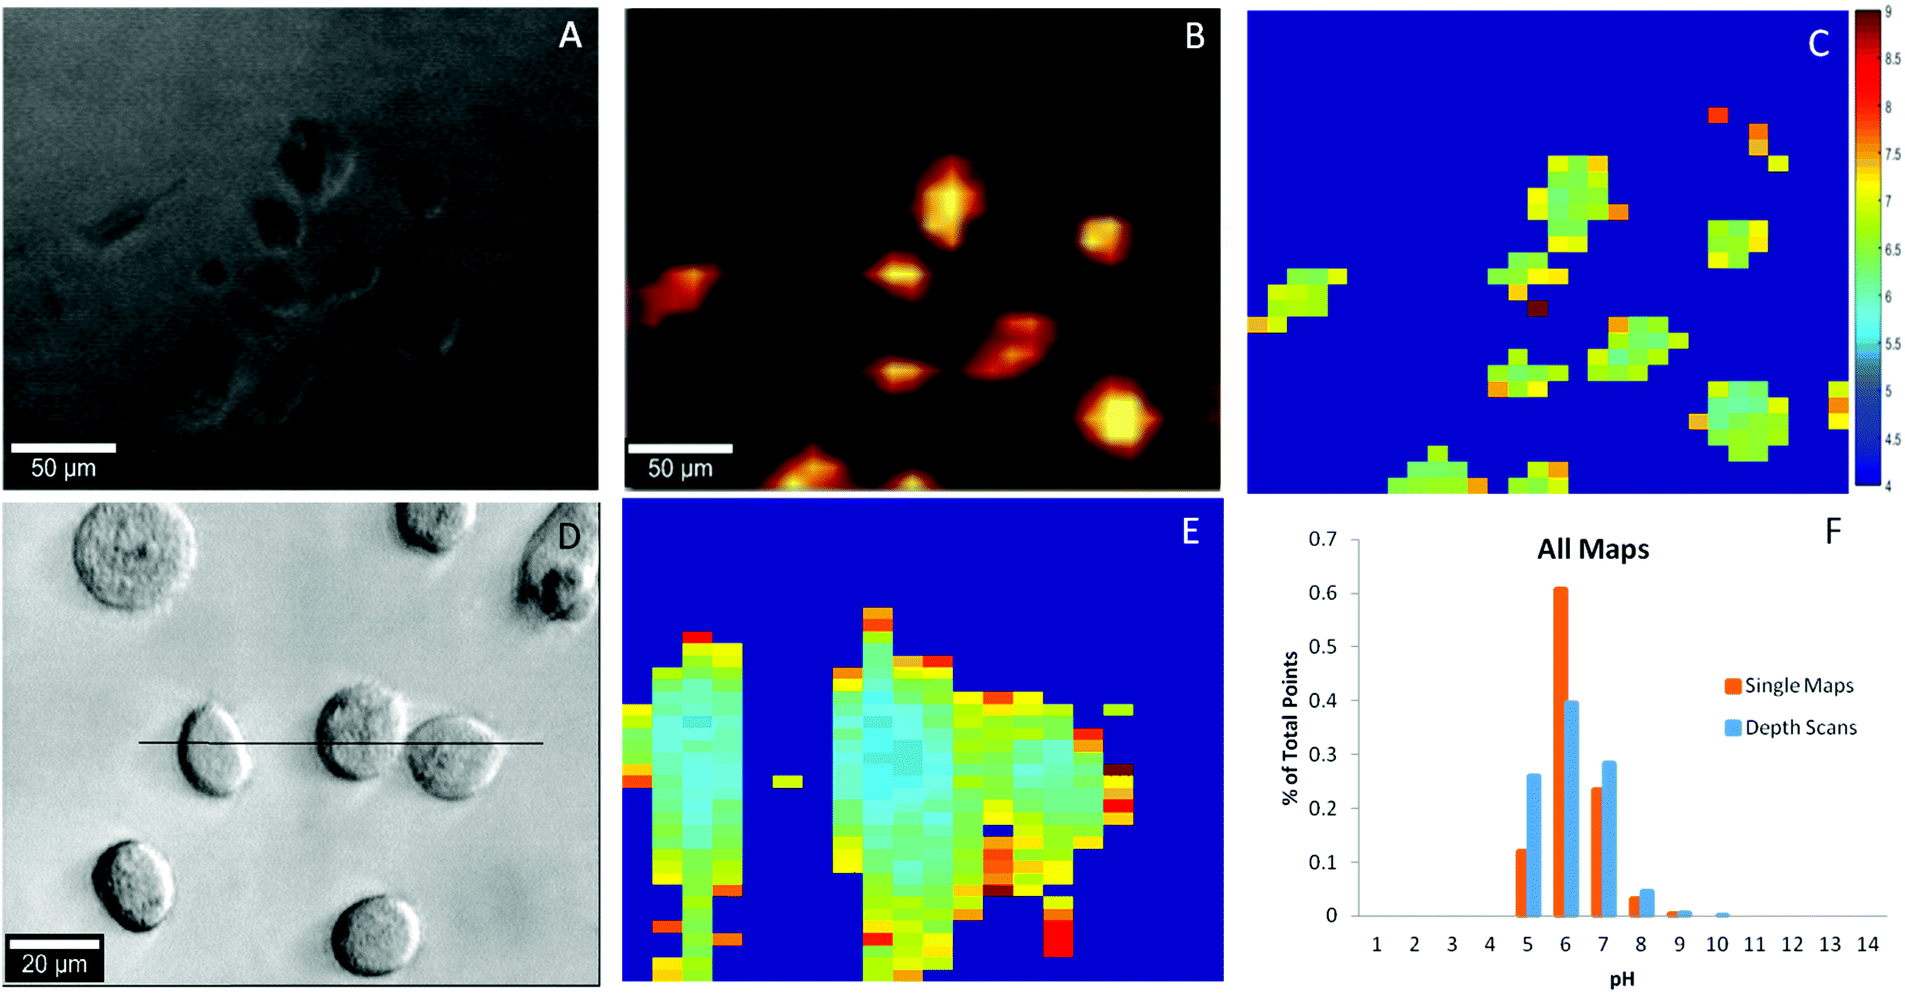 | ||
| Fig. 4 (A) Optical 10× image of PC3 cancer cells; (B) SERS map of A based on intensity of the 1084−1 cm peak; (C) pH map rendered in MATLAB of A derived from the signal of B. (D) Optical 50× image of PC3 cancer cells with black line indicating position of YZ plane; (E) in-depth pH map indicated by the black line in D and (F) summary of pH distribution for single maps and depth scans. | ||
To determine the intracellular pH of the cancer cells in rapid and automated fashion, the collected SERS maps were imported into Matlab and baseline corrected and analyzed using in-house scripts. At each point in every SERS map, the ratio between the pH insensitive peak (1084 cm−1) and the pH sensitive peak (1410 cm−1) was determined. Using a calibration curve established in cell culture media (Fig. S13†), the pH was calculated at each point and then rendered into a XY map (Fig. 4C). The SERS spectrum of the internalized pH probes includes the 4-MBA Raman bands with good signal-to-noise ratio with no interference from either the cell or the culture medium, thus indicating the excellent stability and protection capability of the PEG layer. A typical SERS spectrum is shown in Fig. S14.† Ultimately, 19 unique pH maps were collected. The intracellular pH range calculated over the whole sample set, Fig. 4F, agrees with the intracellular pH range reported in the literature of pH 4 to 9.14,16,23,24 Additionally, fourteen depth scans, YZ cross sections, were collected and demonstrate the three-dimensional spatial consistency of our probes (Fig. 4D & E). Again, for both single maps and depth scans across the dataset (Fig. 4F) more than 95% of the pH points fall between pH 5–7 and 99% of the points fall within the expected range for intracellular pH.
We found it necessary to develop a pH calibration curve in cell culture media. As shown in Fig. S13,† there is a substantial difference in both the shape of the calibration curve and pH sensitive range in cell culture media relative to PB. We attribute this fact to the presence of proteins in the culture media as we observed a similar phenomenon in milk (data not shown). To our knowledge the observation that pH nanoprobes should be calibrated in culture media has not been addressed in a majority of the prior studies detailing their development. In Fig. S15† we compare internal cell pH values measured using a calibration curve obtained in cell culture media relative to PB media alone. The lack of consideration of this effect may be partially responsible for many of the extant reports of low pH zones in cells mapped using nanoprobes.
Compared to previously reported intracellular pH probes, our probe exhibits several advantages: (1) the Raman spectrum exhibits higher signal-to-noise ratio than those produced by uncontrolled aggregation (Fig. 2A and S14†)16,23 due to our use of co-solvents to control the extent of aggregation. (2) The SERS spectra collected from probes internalized by PC3 cells only contain Raman bands for 4-MBA (Fig. S14†) because the PEG protective layer prevents cellular components from reaching the surface. In contrast, many reported probes that do not have a protective layer exhibit potentially interferent Raman bands due to the biomolecules inside the cells.15 (3) This paper demonstrates clear evidence that the probes are internalized by the PC3 cells by providing co-located optical and SERS images and is the first to present depth scans (Fig. 4 and S12†), while none of extent literature provides this information.16,21,23,25 As a comparison, in a recently published paper, 4-MBA-coated AuNPs produced without controlled aggregation and PEG protection were applied for detecting pH in EA.hy926 cells.23 However, due to the lack of SERS signal optimization, through controlled aggregation and stability via PEG protection, the probes exhibited a much lower signal-to-noise ratio in cells compared to the probes reported herein. Additionally, the reported intracellular pH SERS maps showed that the localization of their probes was limited to select areas inside the cells and included reports of several abnormally high pH values. A result which could be attributed to the severe aggregation of the unprotected probes or interference from the biomolecules inside the cells or in the culture media.
Conclusions
Herein we have described a novel, highly reproducible approach to control AuNP aggregation using water:ethanol co-solvent and 4-MBA mixtures. By using this approach, and by coating the resulting multimers with PEG to provide steric stability we were able to produce highly stable pH nanoprobes. Because of their colloidal stability these nanoprobes exhibit a broader pH sensitive range of 6–11 than existing pH nanoprobes described in the literature. An individual dimer within a 3.5 fL volume generates high SERS intensity, which is ideal for detecting pH changes within microenvironments. To provide proof of concept, we utilized the pH nanoprobes to detect the intracellular pH of PC-3 cancer cells. Using a Raman mapping approach and data processing we establish that intra-cellular pH is highly consistent across multiple cells and we have produced the most robust database of intracellular pH obtained by SERS to date. Because the protective PEG layer can be replaced with bifunctional PEG (i.e., both thiol and carboxy terminated) our nanoprobes can be further functionalized to provide multiplex sensing capacity. In our ongoing studies we seek to utilize this capacity to measure not only pH, but also to detect and quantify cells.
Acknowledgements
This research was supported by the National Institutes of Health (NIH) through the NIH Director's New Innovator Award Program (1-DP2-A1112243). Additional support for H. W. and M. W. was provided by the Virginia Tech Graduate School through the Sustainable Nanotechnology Interdisciplinary Graduate Education Program (VT-SuN IGEP). We thank Dr Weinan Leng for his help with the Raman microscope and the laboratory of Dr Lissett Bickford for supplying the PC-3 cells.References
- H. Wei and P. J. Vikesland, Sci. Rep., 2015, 5, 18131 CrossRef CAS PubMed
.
- R. A. Halvorson and P. J. Vikesland, Environ. Sci. Technol., 2010, 44, 7749–7755 CrossRef CAS PubMed
- H. Wei, S. M. H. Abtahi and P. J. Vikesland, Environ. Sci.: Nano, 2015, 2, 120–135 RSC
- H. Wei, K. Rodriguez, S. Renneckar, W. Leng and P. J. Vikesland, Analyst, 2015, 140, 5640–5649 RSC
- K. L. Rule and P. J. Vikesland, Environ. Sci. Technol., 2009, 43, 1147–1152 CrossRef CAS PubMed
- G. Braun, I. Pavel, A. R. Morrill, D. S. Seferos, G. C. Bazan, N. O. Reich and M. Moskovits, J. Am. Chem. Soc., 2007, 129, 7760–7761 CrossRef CAS PubMed
- S. L. Kleinman, R. R. Frontiera, A. I. Henry, J. A. Dieringer and R. P. Van Duyne, Phys. Chem. Chem. Phys., 2013, 15, 21–36 RSC
- L. S. Lawson, J. W. Chan and T. Huser, Nanoscale, 2014, 6, 7971–7980 RSC
- G. B. Braun, S. J. Lee, T. Laurence, N. Fera, L. Fabris, G. C. Bazan, M. Moskovits and N. O. Reich, J. Phys. Chem. C, 2009, 113, 13622–13629 CAS
- J. M. Romo-Herrera, R. A. Alvarez-Puebla and L. M. Liz-Marzán, Nanoscale, 2011, 3, 1304–1315 RSC
- W. Leng and P. J. Vikesland, Langmuir, 2014, 30, 8342–8349 CrossRef CAS PubMed
- D. K. Lim, K. S. Jeon, J. H. Hwang, H. Kim, S. Kwon, Y. D. Suh and J. M. Nam, Nat. Nanotechnol., 2011, 6, 452–460 CrossRef CAS PubMed
- R. W. Taylor, T. C. Lee, O. A. Scherman, R. Esteban, J. Aizpurua, F. M. Huang, J. J. Baumberg and S. Mahajan, ACS Nano, 2011, 5, 3878–3887 CrossRef CAS PubMed
- A. Pallaoro, G. B. Braun, N. Reich and M. Moskovits, Small, 2010, 6, 618–622 CrossRef CAS PubMed
- Z. Wang, A. Bonoiu, M. Samoc, Y. Cui and P. N. Prasad, Biosens. Bioelectron., 2008, 23, 886–891 CrossRef CAS PubMed
- C. E. Talley, L. Jusinski, C. W. Hollars, S. M. Lane and T. Huser, Anal. Chem., 2004, 76, 7064–7068 CrossRef CAS PubMed
- S. W. Bishnoi, C. J. Rozell, C. S. Levin, M. K. Gheith, B. R. Johnson, D. H. Johnson and N. J. Halas, Nano Lett., 2006, 6, 1687–1692 CrossRef CAS PubMed
- P. Piotrowski, B. Wrzosek, A. Królikowska and J. Bukowska, Analyst, 2014, 139, 1101–1111 RSC
- X. S. Zheng, P. Hu, Y. Cui, C. Zong, J. M. Feng, X. Wang and B. Ren, Anal. Chem., 2014, 86, 12250–12257 CrossRef CAS PubMed
- S. Zong, Z. Wang, J. Yang and Y. Cui, Anal. Chem., 2011, 83, 4178–4183 CrossRef CAS PubMed
- Y. Liu, H. Yuan, A. M. Fales and T. Vo-Dinh, J. Raman Spectrosc., 2013, 44, 980–986 CrossRef CAS
- M. Gühlke, Z. Heiner and J. Kneipp, Phys. Chem. Chem. Phys., 2015, 17, 26093–26100 RSC
- A. Jaworska, L. E. Jamieson, K. Malek, C. J. Campbell, J. Choo, S. Chlopicki and M. Baranska, Analyst, 2015, 140, 2321–2329 RSC
- L. Jamieson, A. Jaworska, J. Jiang, M. Baranska, D. Harrison and C. Campbell, Analyst, 2015, 140, 2330–2335 RSC
- F. Wang, R. G. Widejko, Z. Yang, K. T. Nguyen, H. Chen, L. P. Fernando, K. A. Christensen and J. N. Anker, Anal. Chem., 2012, 84, 8013–8019 CrossRef CAS PubMed
- J. Liao, Y. Zhang, W. Yu, L. Xu, C. Ge, J. Liu and N. Gu, Colloids Surf., A, 2003, 223, 177–183 CrossRef CAS
- G. Frens, Nature, 1973, 241, 20–22 CAS
- X. Ji, X. Song, J. Li, Y. Bai, W. Yang and X. Peng, J. Am. Chem. Soc., 2007, 129, 13939–13948 CrossRef CAS PubMed
- K. R. Brown, D. G. Walter and M. J. Natan, Chem. Mater., 2000, 12, 306–313 CrossRef CAS
- B. L. Darby and E. C. Le Ru, J. Am. Chem. Soc., 2014, 136, 10965–10973 CrossRef CAS PubMed
-
P. H. Eilers and H. F. M. Boelens, Baseline Correction with Asymmetric Least Squares Smoothing, 2005 Search PubMed
- W. Leng, P. Pati and P. J. Vikesland, Environ. Sci.: Nano, 2015, 2, 440–453 RSC
- Y. Zhang, X. Li, B. Xue, X. Kong, X. Liu, L. Tu and Y. Chang, Sci. Rep., 2015, 5, 14934 CrossRef CAS PubMed
- X. Qian, X. H. Peng, D. O. Ansari, Q. Yin-Goen, G. Z. Chen, D. M. Shin, L. Yang, A. N. Young, M. D. Wang and S. Nie, Nat. Biotechnol., 2008, 26, 83–90 CrossRef CAS PubMed
- J. V. Jokerst, T. Lobovkina, R. N. Zare and S. S. Gambhir, Nanomedicine, 2011, 6, 715–728 CrossRef CAS PubMed
- M. C. Leopold, J. A. Black and E. F. Bowden, Langmuir, 2002, 18, 978–980 CrossRef CAS
- C. Ma and J. M. Harris, Langmuir, 2011, 27, 3527–3533 CrossRef CAS PubMed
- M. Rezaee, Y. Assadi, M. R. M. Hosseini, E. Aghaee, F. Ahmadi and S. Berijani, J. Chromatogr., A, 2006, 1116, 1–9 CrossRef CAS PubMed
- M. K. Gregas, J. P. Scaffidi, B. Lauly and T. Vo-Dinh, Appl. Spectrosc., 2010, 64, 858–866 CrossRef CAS PubMed
- B. D. Chithrani, A. A. Ghazani and W. C. W. Chan, Nano Lett., 2006, 6, 662–668 CrossRef CAS PubMed
- L. Y. T. Chou, K. Ming and W. C. W. Chan, Chem. Soc. Rev., 2011, 40, 233–245 RSC
- ATCC.
Footnote |
| † Electronic supplementary information (ESI) available. See DOI: 10.1039/c6an00650g |
| This journal is © The Royal Society of Chemistry 2016 |