 Open Access Article
Creative Commons Attribution 3.0 Unported Licence
Fluorescent/phosphorescent dual-emissive conjugated polymer dots for hypoxia bioimaging†
Qiang
Zhao
*a,
Xiaobo
Zhou
a,
Tianye
Cao
c,
Kenneth Yin
Zhang
a,
Lijuan
Yang
a,
Shujuan
Liu
a,
Hua
Liang
a,
Huiran
Yang
a,
Fuyou
Li
*c and
Wei
Huang
*ab
aKey Laboratory for Organic Electronics and Information Displays & Institute of Advanced Materials (IAM), Jiangsu National Synergistic Innovation Center for Advanced Materials (SICAM), Nanjing University of Posts & Telecommunications, 9 Wenyuan Road, Nanjing 210023, China. E-mail: iamqzhao@njupt.edu.cn; wei-huang@njtech.edu.cn; Fax: +86-25-85866396
bKey Laboratory of Flexible Electronics (KLOFE) & Institute of Advanced Materials (IAM), Jiangsu National Synergistic Innovation Center for Advanced Materials (SICAM), Nanjing Tech University (NanjingTech), 30 South Puzhu Road, Nanjing 211816, China
cDepartment of Chemistry & State Key Laboratory of Molecular Engineering of Polymers & Institute of Biomedicine Science, Fudan University, Shanghai 200433, China. E-mail: fyli@fudan.edu.cn; Fax: +86-21-55664621
First published on 12th January 2015
Abstract
A kind of fluorescent/phosphorescent dual-emissive conjugated polyelectrolyte has been prepared by introducing phosphorescent platinum(II) porphyrin (O2-sensitive) into a fluorene-based conjugated polyelectrolyte (O2-insensitive), which can form ultrasmall conjugated polymer dots (FP-Pdots) in the phosphate buffer solution (PBS) via self-assembly caused by their amphiphilic structures with hydrophobic backbones and hydrophilic side chains. These FP-Pdots can exhibit an excellent ratiometric luminescence response to O2 content with high reliability and full reversibility for measuring oxygen levels, and the excellent intracellular ratiometric O2 sensing properties of the FP-Pdots nanoprobe have also been confirmed by the evident change in the Ired/Iblue ratio values in living cells cultured at different O2 concentrations. To confirm the reliability of the O2 sensing measurements of the FP-Pdots nanoprobe, O2 quenching experiments based on lifetime measurements of phosphorescence from Pt(II) porphyrin moieties have also been carried out. Utilizing the sensitivity of the long phosphorescence lifetime from Pt(II) porphyrins to oxygen, the FP-Pdots have been successfully applied in time-resolved luminescence imaging of intracellular O2 levels, including photoluminescence lifetime imaging and time-gated luminescence imaging, which will evidently improve the sensing sensitivity and reliability. Finally, in vivo oxygen sensing experiments were successfully performed by luminescence imaging of tumor hypoxia in nude mice.
Introduction
Hypoxia has been found to be closely related to various diseases, such as solid tumors,1 brain abnormalities2 and retinal diseases.3 Especially, hypoxia is a feature of tumor tissues, and the median oxygen (O2) concentration in some solid tumors is around 4% and may even decrease to 0% locally.4 The real-time monitoring of O2 concentration in living cells and tissue can not only lead to accurate diagnosis of cancer, but can also be used to evaluate therapeutic effects. Thus far, enormous efforts have been focused on the development of hypoxia sensing. Hypoxia can be selectively detected by utilizing immunostaining,5 magnetic resonance imaging,6 positron emission tomography imaging,7 and optical imaging techniques.8–10 Among them, non-invasive optical imaging offers a powerful approach to map oxygen in living cells and tissues with high sensitivity and spatial resolution. Many fluorescence probes for optical imaging that employ organic dyes containing a nitro group, quinone group, or azo group as the hypoxia-sensing moiety have been developed.10 Most of these probes, however, usually show an irreversible fluorescence change upon bioreduction reaction under hypoxia, which limits their applications in real-time fluorescence monitoring of oxygen concentration.Phosphorescent probes based on transition-metal complexes can be used for fully reversible real-time monitoring of O2 levels in vitro with high-resolution by utilizing the energy transfer between the triplet excited state of the metal complex and the triplet ground state of O2.8,11 Thus, phosphorescent metal complexes with a long-lived triplet excited state, such as platinum(II),12 palladium(II),13 ruthenium(II),14 and iridium(III)15 complexes, have been regarded as a kind of fascinating hypoxia probe. The phosphorescence intensities of these complexes are reversibly dependent on the change in O2 concentration. However, most of these reported probes are based on the variation in single phosphorescent emission (“ON–OFF” or “OFF–ON” type). The single intensity-based reporting signal is easily influenced by the external environment, such as the probe's concentration, temperature, or pH value. The standardization and use of accurate readout of O2 concentration are also difficult. Therefore, an advisable choice is to develop ratiometric O2 probes that can allow for accurate measurement of O2 concentration through the ratio change of the emission intensities at two different wavelengths.
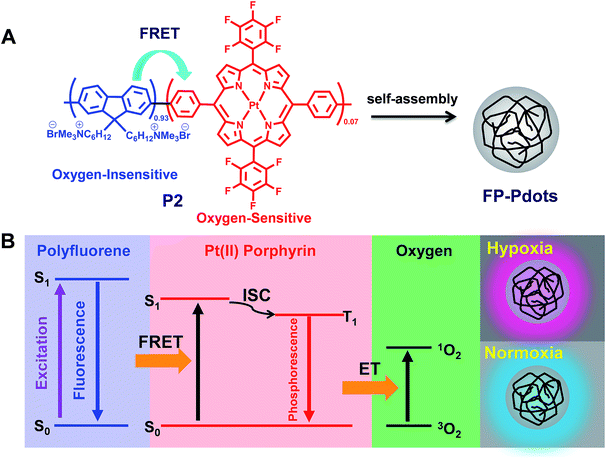
For the design of ratiometric O2 probes, herein, we hope to demonstrate an effective way to construct a Förster resonance energy transfer (FRET) system with an O2-insensitive fluorophore as the energy donor and an O2-sensitive phosphorescent metal complex as the acceptor (Fig. 1). The occurrence of FRET can significantly improve the sensitivity of sensing by promoting the population of the oxygen-sensitive triplet excited state of the acceptor. We introduced phosphorescent platinum(II) porphyrin (O2-sensitive) into a fluorene-based conjugated polyelectrolyte (O2-insensitive). Fluorescent/phosphorescent dual-emissive polymer dots (FP-Pdots, see Fig. 1A) were successfully prepared as excellent O2 probes. The as-prepared FP-Pdots enabled ratiometric measurements of hypoxia in living cells with the advantages of eliminating photobleaching and excitation power fluctuation by using the O2-insensitive fluorescence from polyfluorene moieties as a reference and O2-sensitive phosphorescence from Pt(II) porphyrins as the sensing signal.16 Taking advantage of the long excited-state lifetime of phosphorescent Pt(II) porphyrins, time-resolved luminescence imaging of O2 levels in living cells, including photoluminescence lifetime imaging microscopy (PLIM) and time-gated luminescence imaging (TGLI), was realized. These techniques can eliminate external influences and autofluorescence interferences from biological samples.17,18 Furthermore, we applied the FP-Pdots probe to nude mice for the luminescence imaging of tumor hypoxia. These experiments have shown that FP-Pdots are an excellent class of luminescent probes for practical application in determining O2 concentrations in living samples.
Results and discussion
Design, synthesis and properties of the FP-Pdots
We chose conjugated polymer as the oxygen-insensitive energy donor to construct FRET-based ratiometric O2 probes (Fig. 1) because of their high light absorptivity, extraordinary fluorescence brightness, excellent photostability, and good water-dispersibility.19,20 The synthetic route and chemical structures of the conjugated polyfluorene electrolyte are shown in Scheme 1. The Pt(II) complex–polymer precursor P1 was prepared via a Suzuki polycondensation reaction, and its structure was characterized via1H NMR and 13C NMR. The number-average molecular weight of the polymer was determined to be 25![[thin space (1/6-em)]](https://www.rsc.org/images/entities/char_2009.gif) 400 with a polydispersity index of 2.49, measured via gel permeation chromatography (GPC) in THF by using the calibration curve of polystyrene standards. The target Pt(II) complex–polymer P2 was obtained by the quarternization of the precursor P1 (Scheme 1). The initial feed ratio of Pt(II) porphyrins to the total monomers was 10 mol%. The actual Pt(II) porphyrin content in the copolymer, which was estimated via1H NMR, was about 7 mol%. This value is lower than that of the feed ratio probably because of the reaction activity or steric hindrance.
400 with a polydispersity index of 2.49, measured via gel permeation chromatography (GPC) in THF by using the calibration curve of polystyrene standards. The target Pt(II) complex–polymer P2 was obtained by the quarternization of the precursor P1 (Scheme 1). The initial feed ratio of Pt(II) porphyrins to the total monomers was 10 mol%. The actual Pt(II) porphyrin content in the copolymer, which was estimated via1H NMR, was about 7 mol%. This value is lower than that of the feed ratio probably because of the reaction activity or steric hindrance.
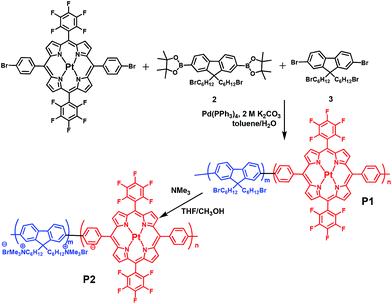 | ||
| Scheme 1 Synthetic route of the target conjugated Pt(II) complex–polyelectrolyte P2 and the intermediate P1. | ||
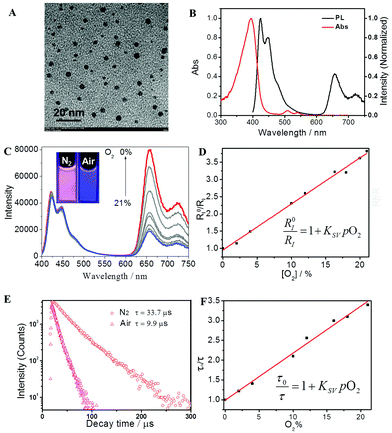
The morphology of P2 in the phosphate buffer solution (PBS) was investigated via transmission electron microscopy (TEM) and dynamic light scattering (DLS), as shown in Fig. 2A and S1.† Each of the FP-Pdots have a diameter of approximately 5 nm and they were formed via self-assembly caused by their amphiphilic structures with hydrophobic backbones and hydrophilic side chains. Thus, the as-prepared FP-Pdots were well dispersed in PBS. In addition, the zeta-potential of P2 was measured to be 54.00 mV, which further demonstrated the good dispersibility and stability of the FP-Pdots in PBS.
A particular degree of spectral overlap between the emission spectrum of Pt(II)-free polyfluorene P3 (see Scheme S1†) and the absorption spectrum of Pt(II) porphyrin ensures the efficient energy transfer from polyfluorene segments as host to Pt(II) porphyrin moieties as guest (Fig. S4†). The photophysical properties of P2, specifically of the FP-Pdots, are shown in Fig. 2B. The UV-vis absorption spectrum of the FP-Pdots is dominated by a strong featureless transition centered at 395 nm, which consists of a mixture of Soret bands of Pt(II) porphyrin21 and the π–π* transition of fluorene units. An additional two weak and broad absorptions, which peaked at 510 and 540 nm, respectively, were also found. These results correspond to Q(1,0) and Q(0,0) of the Pt(II) porphyrin moieties.21 FP-Pdots excited at 375 nm exhibit strong blue fluorescence, attributed to the π–π* emission of the fluorene moieties, as well as relatively weak red phosphorescence of the Pt(II) porphyrin moieties (Fig. 2B). In addition, the FP-Pdots of P2 also show more efficient FRET than the blend of Pt(II) porphyrin (1) and Pt(II)-free polyelectrolyte P3 according to the PL spectra (Fig. S5†). Although the mixture of 1 and P3 showed the same molar ratio of Pt(II) porphyrin and fluorene to P2, the emission from the Pt(II) porphyrin was weaker than that in P2. The Förster radius is calculated to be 4.7 nm,15a demonstrating the effectiveness of covalent incorporation of Pt(II) porphyrin into P2. It also indicated that the dose of Pt(II) porphyrin was reduced when FRET was present. Therefore, the nanoprobe will be less toxic to cells and animals. Furthermore, due to the high molar absorption coefficient and quantum yield of polyfluorene, the FRET from polyfluorene to Pt(II) porphyrin will be of benefit for better O2-sensitivity than for non-FRET systems.
Luminescence response to O2 content
The PL spectra of the FP-Pdots at various O2 concentrations in water at room temperature are shown in Fig. 2C. Under an atmosphere of 21% O2, the FP-Pdots showed strong emission centered at 425 nm with a shoulder peak at 450 nm attributed to polyfluorene moieties as well as weak emission at 656 nm with a shoulder peak at 721 nm from Pt(II) porphyrins. The solution exhibited very bright blue emission under UV excitation (Fig. 2C, inset). With decreasing O2 content, the blue fluorescence intensities showed little change, but the red phosphorescence intensities grew progressively. This result is in agreement with the O2 sensitivity of the Pt(II) porphyrin complexes. The red phosphorescence became dominant under an atmosphere of 0% O2. Thus, the color of the emission changed from very bright blue to red under UV excitation (Fig. 2C, inset).The ratiometric oxygen sensing of the FP-Pdots was analyzed quantitatively based on the data of phosphorescence intensities shown in Fig. 2C, according to the Stern–Volmer equation:22
 | (1) |
A good linearity of RI0/RI as a function of O2 concentration was observed (Fig. 2D and S6†), according to eqn (1). The Ksv value is 1.67 × 10⁻² mmHg−1. At the same time, no change in the fluorescence intensities of the FP-Pdots monitored at 425 nm from the polyfluorene moiety was observed at various O2 concentrations (Fig. 2C), which means that the ratio of the phosphorescence intensity at 656 nm to the fluorescence intensity at 422 nm for the FP-Pdots is dependent on O2 concentration. Therefore, the FP-Pdots can be used as a ratiometric phosphorescent probe with high reliability for measuring oxygen levels. The limit of detection of the FP-Pdots was determined to be 0.5 mmHg.
Lifetime response to O2
To confirm the reliability of the O2 sensing measurements of the FP-Pdots nanoprobe, we performed similar O2 quenching experiments based on lifetime measurements of phosphorescence from Pt(II) porphyrin moieties, according to eqn (2): | (2) |
The lifetime (τ) monitored at 656 nm decreased evidently with increasing O2 concentration, as shown in Fig. 2E. For example, the phosphorescence lifetimes of the FP-Pdots in N2 and air were 33.7 and 9.9 μs, respectively. As illustrated in Fig. 2F, a good linear relationship between τ0/τ and pO2 was observed. The constant Ksv based on the excited state lifetime was 1.57 × 10⁻² mmHg−1, which is very close to that (1.54 × 10⁻² mmHg−1) obtained from luminescence intensity measurements. However, the fluorescence lifetime of the FP-Pdots monitored at 425 nm from the polyfluorene moiety remains constant at various O2 concentrations (Fig. S7†). Therefore, the FP-Pdots can be used as a lifetime-based phosphorescent probe with high reliability for measuring oxygen levels.
Ratiometric imaging of intracellular O2 levels
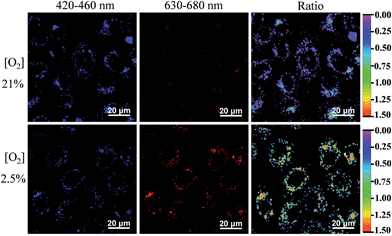
We then used the FP-Pdots as a ratiometric luminescence nanoprobe to investigate intracellular O2 levels. The cells were cultured for 24 h at 37 °C at 21% and 2.5% O2 concentrations. The excitation wavelength was 405 nm. As shown in Fig. 3, the emission intensities collected at wavelengths from 420 nm to 460 nm (Iblue), which correspond to the reference fluorescence of polyfluorene moieties, are almost the same at 21% and 2.5% O2 concentrations. By contrast, the emission images taken in the wavelength range of 630 nm to 680 nm (Ired), which corresponds to the phosphorescence of Pt(II) porphyrin complexes, show a much brighter image at a condition of 2.5% O2 than at 21% O2. The excellent intracellular ratiometric O2 sensing properties of the FP-Pdots nanoprobe can also be confirmed by the evident change in the Ired/Iblue ratio values in living cells cultured at different O2 concentrations, as shown in ratio images in Fig. 3.Time-resolved luminescence imaging of intracellular O2 levels
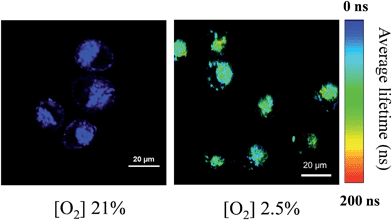
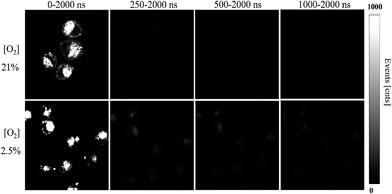
Considering the response of long phosphorescence lifetime from Pt(II) porphyrins to oxygen, we have applied our FP-Pdots in time-resolved luminescence imaging of intracellular O2 levels. First, the PLIM of intracellular O2 level was performed using the FP-Pdots as a lifetime-based nanoprobe, as shown in Fig. 4. The average emission lifetime τ was about 17 ns at 21% O2 concentration and increased to about 95 ns when the O2 concentration was lowered to 2.5%. The interference from short-lived autofluorescence was eliminated because of the relatively long average lifetime of FP-Pdots. This result demonstrated that the FP-Pdots probe exhibits an evident difference in emission lifetime at different O2 concentrations and it can be applied as an excellent PLIM probe for sensing intracellular O2 levels.To further demonstrate the ability of anti-interference when the FP-Pdots were applied for O2 sensing in living cells, we performed TGLI measurements, and the luminescence intensity images at different time ranges were collected (Fig. 5). When the signal was collected at a time range of 0 ns to 2000 ns, the images of FP-Pdot-treated HepG2 cells exhibited a high signal intensity at 21% and 2.5% O2 concentrations because of the presence of reference fluorescence from polyfluorene moieties. Once a particular time delay was exerted, such as in the image collected at a time range of 250 ns to 2000 ns, the signal intensity of the FP-Pdot-treated HepG2 cells at 21% O2 concentration could not be observed. By contrast, the signal intensity collected at a time range of 250 ns to 2000 ns at 2.5% O2 concentration was still high enough to be observed, although the decrease in the luminescence intensity of the FP-Pdot-treated HepG2 cells is reasonable. When the time delay was increased to 500 ns, the TGLI image of the FP-Pdot-treated HepG2 cells can still be measured. This phenomenon is attributed to the long phosphorescence lifetime of the FP-Pdots. The difference in the emission intensity at O2 concentrations of 21% and 2.5% became increasingly more evident, which indicated that O2 sensing can be made more sensitive by collecting the signal at a long time range via the TGLI technique. As far as we know, this study is the first to use Pdots-based TGLI for intracellular oxygen detection.
Luminescence imaging of tumor hypoxia in nude mice
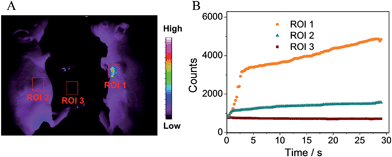
To further confirm the potential of the probe for practical application, we applied the FP-Pdots probe for luminescence imaging of tumor hypoxia in nude mice. In vivo and ex vivo luminescence imaging were performed using a modified Kodak in vivo imaging system. The luminescence signals were collected at 660 ± 13 nm. The mice were intratumorally injected with the FP-Pdots solution (10 μL, 2 mg mL−1) without being deoxygenized. For the purpose of comparison, the mice were subcutaneously injected with the FP-Pdots probe under the same conditions. As shown in Fig. 6A, a very intense signal from the area of the tumor (ROI 1) was detected. When compared to the area of the subcutaneous injection (ROI 2), an obviously high signal-to-noise ratio in the emission intensity within the tumor area can be observed. To intuitively estimate the change in luminescence intensity, imaging dynamic curves were plotted, as shown in Fig. 6B. The luminescence intensity of the FP-Pdots located in tumor ROI 1 increased abruptly following 3 seconds of injection into the tumor and subsequently increased. The intensity was up to 3.3 times greater than that at 660 ± 13 nm of the FP-Pdots (ROI 3) compared with the phosphorescence intensity at ROI 2. Therefore, the FP-Pdots exhibited excellent oxygen-sensitivity and can be applied as tumor hypoxia probes in vivo.Lastly, the cytotoxicity of the FP-Pdots nanoprobe toward HepG2 cells was determined via an MTT 3-(4,5-dimethylthiazol-2-yl)-2,5-diphenyltetrazolium bromide assay. The plot of cellular viabilities (%) vs. incubation concentrations (0–50 μg mL−1) of the probe in PBS buffer at 37 °C for 24 h is illustrated in Fig. S8.† The viabilities of the HepG2 cells still retained a value higher than 70% even after incubation with a high concentration (50 μg mL−1) of the nanoprobe. Under the living cell imaging experimental conditions (10 μg mL−1 concentration, 2 h incubation time), the FP-Pdots nanoprobe showed negligible cytotoxicity toward HepG2 cells with cell viabilities of more than 95%. These data demonstrated that the use of the FP-Pdots as a hypoxia probe shows excellent biocompatibility.
Conclusions
In conclusion, we have presented a hypoxia nanoprobe based on fluorescent/phosphorescent dual-emissive FP-Pdots, which was prepared from conjugated polyelectrolyte by using polyfluorenes as an O2-insensitive fluorophore and Pt(II) porphyrins as an O2-sensitive phosphor. The FP-Pdots nanoprobe was demonstrated to be a kind of excellent ratiometric O2 nanoprobe with full reversibility and low toxicity toward living cells. Importantly, the FP-Pdots can perform excellently in PLIM and TGLI techniques, which will evidently improve the sensing sensitivity and reliability. In addition, the FP-Pdots nanoprobe was applied to tumor-bearing mice for luminescence imaging of tumor hypoxia. These initial studies showed that the fluorescent/phosphorescent dual-emissive FP-Pdots are a promising kind of hypoxia nanoprobe, which will be helpful in designing a ratiometric and time-resolved luminescent probe for monitoring tumor hypoxia.Acknowledgements
We thank the National Basic Research Program of China (2012CB933301), National Natural Science Foundation of China (51473078, 21171098 and 21174064), Program for New Century Excellent Talents in University (NCET-12-0740), and Priority Academic Program Development of Jiangsu Higher Education Institutions for financial support.Notes and references
- (a) G. L. Semenza, Science, 2007, 318, 62 CrossRef CAS PubMed; (b) P. Carmeliet, Y. Dor, J. M. Herbert, D. Fukumura, K. Brusselmans, M. Dewerchin, M. Neeman, F. Bono, R. Abramovitch, P. Maxwell, C. J. Koch, P. Ratcliffe, L. Moons, R. K. Jain, D. Collen and E. Keshet, Nature, 1998, 394, 485 CrossRef CAS PubMed.
- (a) D. J. Heeger and D. Ress, Nat. Rev. Neurosci., 2002, 3, 142 CrossRef CAS PubMed; (b) C. Iadecola, Nat. Rev. Neurosci., 2004, 5, 347 CrossRef CAS PubMed.
- R. N. Frank, N. Engl. J. Med., 2004, 350, 48 CrossRef CAS PubMed.
- P. Vaupel, K. Schlenger, C. Knoop and M. Hçckel, Cancer Res., 1991, 51, 3316 CAS.
- (a) S. Kizaka-Kondoh, M. Inoue, H. Harada and M. Hiraoka, Cancer Sci., 2003, 94, 1021 CrossRef CAS PubMed; (b) A. L. Harris, Nat. Rev. Cancer, 2002, 2, 38 CrossRef CAS PubMed; (c) E. K. Rofstad, H. Rasmussen, K. Galappathi, B. Mathiesen, K. Nilsen and B. A. Graff, Cancer Res., 2002, 62, 1847 CAS.
- (a) J. Pacheco-Torres, P. Lopeź-Larrubia, P. Ballesteros and S. Cerdán, NMR Biomed., 2011, 24, 1 CrossRef CAS PubMed; (b) S. Iwaki, K. Hanaoka, W. Piao, T. Komatsu, T. Ueno, T. Terai and T. Nagano, Bioorg. Med. Chem. Lett., 2012, 22, 2798 CrossRef CAS PubMed.
- (a) D. J. Yang, S. Wallace, A. Cherif, C. Li, M. B. Gretzer, E. E. Kim and D. A. Podoloff, Radiology, 1995, 194, 795 CrossRef CAS PubMed; (b) J. L. J. Dearlin, J. S. Lewis, G. E. D. Mullen, M. J. Welch and P. J. J. Blower, Biol. Inorg. Chem., 2002, 7, 249 CrossRef PubMed.
- (a) D. B. Papkovsky and R. I. Dmitriev, Chem. Soc. Rev., 2013, 42, 8700 RSC; (b) X.-D. Wang and O. S. Wolfbeis, Chem. Soc. Rev., 2014, 43, 3666 RSC.
- (a) S. Zhang, M. Hosaka, T. Yoshihara, K. Negishi, Y. Iida, S. Tobita and T. Takeuchi, Cancer Res., 2010, 70, 4490 CrossRef CAS PubMed; (b) S. Sakadžić, E. Roussakis, M. A. Yaseen, E. T. Mandeville, V. J. Srinivasan, K. Arai, S. Ruvinskaya, A. Devor, E. H. Lo, S. A. Vinogradov and D. A. Boas, Nat. Methods, 2010, 7, 755 CrossRef PubMed.
- (a) K. Kiyose, K. Hanaoka, D. Oushiki, T. Nakamura, M. Kajimura, M. Suematsu, H. Nishimatsu, T. Yamane, T. Terai, Y. Hirata and T. Nagano, J. Am. Chem. Soc., 2010, 132, 15846 CrossRef CAS PubMed; (b) L. Cui, Y. Zhong, W. P. Zhu, Y. F. Xu, Q. S. Du, X. Wang, X. H. Qian and Y. Xiao, Org. Lett., 2011, 13, 928 CrossRef CAS PubMed; (c) J. N. Liu, Y. Liu, W. B. Bu, J. W. Bu, Y. Sun, J. L. Du and J. L. Shi, J. Am. Chem. Soc., 2014, 136, 9701 CrossRef CAS PubMed.
- (a) Q. Zhao, F. Y. Li and C. H. Huang, Chem. Soc. Rev., 2010, 39, 3007 RSC; (b) Q. Zhao, C. H. Huang and F. Y. Li, Chem. Soc. Rev., 2011, 40, 2508 RSC; (c) Y. M. You and W. W. Nam, Chem. Soc. Rev., 2012, 41, 7061 RSC.
- (a) R. P. Briñas, T. Troxler, R. M. Hochstrasser and S. A. Vinogradov, J. Am. Chem. Soc., 2005, 127, 11851 CrossRef PubMed; (b) X. D. Wang, X. Chen, Z. X. Xie and X. R. Wang, Angew. Chem., Int. Ed., 2008, 47, 7450 CrossRef CAS PubMed; (c) X. Wang, J. A. Stolwijk, T. Lang, M. Sperber, R. J. Meier, J. Wegener and O. S. Wolfbeis, J. Am. Chem. Soc., 2012, 134, 17011 CrossRef CAS PubMed.
- S. M. Borisov, R. Saf, R. Fischer and I. Klimant, Inorg. Chem., 2013, 52, 1206 CrossRef CAS PubMed.
- K. A. McGee, D. J. Veltkamp, B. J. Marquardt and K. R. Mann, J. Am. Chem. Soc., 2007, 129, 15092 CrossRef CAS PubMed.
- (a) T. Yoshihara, Y. Yamaguchi, M. Hosaka, T. Takeuchi and S. Tobita, Angew. Chem., Int. Ed., 2012, 51, 4148 CrossRef CAS PubMed; (b) D.-L. Ma, H.-Z. He, K.-H. Leung, D. S.-H. Chan and C.-H. Leung, Angew. Chem., Int. Ed., 2013, 52, 7666 CrossRef CAS PubMed; (c) D.-L. Ma, H.-Z. He, H.-J. Zhong, S. Lin, D. S.-H. Chan, L. Wang, S. M.-Y. Lee, C.-H. Leung and C.-Y. Wong, ACS Appl. Mater. Interfaces, 2014, 6, 14008 CrossRef CAS PubMed; (d) K. K.-W. Lo, A. W.-T. Choi and W. H. T. Law, Dalton Trans., 2012, 41, 6021 RSC; (e) K. K.-W. Lo, K. Y. Zhang, S.-K. Leung and M.-C. Tang, Angew. Chem., Int. Ed., 2008, 47, 2213 CrossRef CAS PubMed.
- I. Sanchez-Barragan, J. M. Costa-Fernandez, M. Valledor, J. C. Campo and A. Sanz-Medel, Trends Anal. Chem., 2006, 25, 958 CrossRef CAS PubMed.
- (a) S. W. Botchway, M. Charnley, J. W. Haycock, A. W. Parker, D. L. Rochester, J. A. Weinstein and J. A. G. Williams, Proc. Natl. Acad. Sci. U. S. A., 2008, 105, 16071 CrossRef CAS PubMed; (b) Y. You, S. Lee, T. Kim, K. Ohkubo, W. S. Chae, S. Fukuzumi, G. J. Jhon, W. Nam and S. J. Lippard, J. Am. Chem. Soc., 2011, 133, 18328 CrossRef CAS PubMed; (c) H. Shi, H. Sun, H. Yang, S. Liu, G. Jenkins, W. Feng, F. Li, Q. Zhao, B. Liu and W. Huang, Adv. Funct. Mater., 2013, 23, 3268 CrossRef CAS; (d) C. Shi, H. Sun, X. Tang, W. Lv, H. Yan, Q. Zhao, J. Wang and W. Huang, Angew. Chem., Int. Ed., 2013, 52, 13434 CrossRef CAS PubMed; (e) K. Y. Zhang, J. Zhang, Y. Liu, S. Liu, P. Zhang, Q. Zhao, Y. Tang and W. Huang, Chem. Sci., 2015, 6, 301 RSC.
- (a) A. V. Kondrashina, R. I. Dmitriev, S. M. Borisov, I. Klimant, I. O'Brien, Y. M. Nolan, A. V. Zhdanov and D. B. Papkovsky, Adv. Funct. Mater., 2012, 22, 4931 CrossRef CAS; (b) A. Grichine, A. Haefele, S. Pascal, A. Duperray, R. Michel, C. Andraud and O. Maury, Chem. Sci., 2014, 5, 3475 RSC; (c) E. Baggaley, S. W. Botchway, J. W. Haycock, H. Morris, I. V. Sazanovich, J. A. G. Williams and J. A. Weinstein, Chem. Sci., 2014, 5, 879 RSC.
- (a) C. Zhu, L. Liu, Q. Yang, F. Lv and S. Wang, Chem. Rev., 2012, 112, 4687 CrossRef CAS PubMed; (b) H. N. Kim, Z. Guo, W. Zhu, J. Yoon and H. Tian, Chem. Soc. Rev., 2011, 40, 79 RSC.
- (a) C. Wu and D. T. Chiu, Angew. Chem., Int. Ed., 2013, 52, 3086 CrossRef CAS PubMed; (b) L. Xiong, A. J. Shuhendler and J. Rao, Nat. Commun., 2012, 3, 1193 CrossRef PubMed; (c) W. Sun, J. Yu, R. Deng, Y. Rong, B. Fujimoto, C. Wu, H. Zhang and D. T. Chiu, Angew. Chem., Int. Ed., 2013, 52, 11294 CrossRef CAS PubMed; (d) E. Ahmed, S. W. Morton, P. T. Hammond and T. M. Swager, Adv. Mater., 2013, 25, 4504 CrossRef CAS PubMed; (e) T. Adachi, L. Tong, J. Kuwabara, T. Kanbara, A. Saeki, S. Seki and Y. Yamamoto, J. Am. Chem. Soc., 2013, 135, 870 CrossRef CAS PubMed; (f) C. Wu, B. Bull, K. Christensen and J. McNeill, Angew. Chem., Int. Ed., 2009, 48, 2741 CrossRef CAS PubMed; (g) K. Pu and B. Liu, Adv. Funct. Mater., 2011, 21, 3408 CrossRef CAS; (h) K. Li, D. Ding, D. Huo, K. Pu, N. N. P. Thao, Y. Hu, Z. Li and B. Liu, Adv. Funct. Mater., 2012, 22, 3107 CrossRef CAS; (i) X. Liu, Y. Tang, L. Wang, J. Zhang, S. Song, C. Fan and S. Wang, Adv. Mater., 2007, 19, 1471 CrossRef CAS; (j) H. Xu, H. Wu, F. Huang, S. Song, W. Li, Y. Cao and C. Fan, Nucleic Acids Res., 2005, 33, e83 CrossRef PubMed.
- S. M. Borisov, A. S. Vasylevska, C. Krause and O. S. Wolfbeis, Adv. Funct. Mater., 2006, 16, 1536 CrossRef CAS.
- (a) B. Valeur, Molecular Fluorescence, WILEY-VCH, Weinheim, 2002 Search PubMed; (b) N. J. Turro, V. Ramamurthy and J. C. Scaiano, Modern Molecular Photochemistry of Organic Molecules, University Science Books, Sausalito, CA, 2010 Search PubMed.
Footnote |
| † Electronic supplementary information (ESI) available. See DOI: 10.1039/c4sc03062a |
| This journal is © The Royal Society of Chemistry 2015 |

