Optimization of a silicon wafer texturing process by modifying the texturing temperature for heterojunction solar cell applications
Yuanjian Jiang,
Xiaodan Zhang*,
Fengyou Wang and
Ying Zhao
Institute of Photo-electronics Thin Film Devices and Technique of Nankai University, Key Laboratory of Photo-electronics Thin Film Devices and Technique of Tianjin, Key Laboratory of Photo-Electronic Information Science and Technology of Ministry of Education (Nankai University), Tianjin 300071, China. E-mail: xdzhang@nankai.edu.cn; Fax: +86-22-23499304; Tel: +86-22-23499304
First published on 5th August 2015
Abstract
In this work, a simple and effective method of two-step texturing temperature control is proposed to optimize the texturing process of commercial Cz-silicon wafers. The effective lifetime attained after passivation of the a-Si:H films is up to 1002.4 μs at a 1015 cm−3 injection level using this method, which is close to the bulk lifetime of the silicon wafers. This result shows over 50% enhancement compared with those achieved using constant texturing temperatures. Furthermore, a lower reflectivity after chemical polish treatment is achieved, and the scanning electron microscope (SEM) images demonstrate that pyramid nucleation is more homogeneous and compact. This method is found to remarkably improve the external quantum efficiency performance in the wave band of blue visible light and the fill factor of silicon heterojunction solar cells. This study provides a universal texturing process for heterojunction solar cell applications.
Introduction
Silicon surface texturing is a significant and standard process in crystalline silicon solar cell fabrication. Texturing can reduce reflection and improve light trapping. Various methods are used to form a pyramidal structure on 〈100〉-oriented monocrystalline silicon wafers. Examples include using the following: etching solutions of an inorganic alkali such as potassium hydroxide (KOH) or sodium hydroxide (NaOH) with IPA (isopropyl alcohol),1–4 or other additives such as sodium carbonate (Na2CO3),5 potassium carbonate (K2CO3),6 sodium phosphate (Na3PO4),7 or Alkatex Zero™(GP Solar GmbH),8,9 or an organic alkali such as tetramethylammonium hydroxide (TMAH, (CH3)4NOH)10,11 or anhydrous ethylenediamine (EDA).12Among the methods mentioned above, etchant solutions of NaOH, IPA, and DIW (deionized water) are commonly used as a standard process for industrial solar cell texturization. However, only a small number of studies have reported on the details of the texturing and the effects on silicon heterojunction solar cells, which has become a research hotspot in the photovoltaic field.13,14 As one of the most promising types of solar cell, silicon heterojunction (SHJ) solar cells exhibit high efficiency, low temperature processes, and low temperature coefficients. As with diffused junction crystalline-silicon solar cells, the optical gains of SHJ solar cells are generally improved by texturization. The electrical performance of the SHJ solar cells deteriorates because the rough silicon surface morphology leads easily to nonuniform deposition of the a-Si:H and local epitaxy in the pyramid valleys. This harms the passivation of the a-Si:H/c-Si interface and the performance of the solar cells.15 Therefore, the effects of texturing processes on optical properties, surface morphology, and electrical characteristics of the SHJ solar cells are worthy of studying in detail.
In the present study, attempts were made to investigate the influence of the etching temperature on the textured surface morphology, and its effect on the passivation of the a-Si:H/c-Si interface. Then, a novel method that adjusts the etching temperature during one of the texturization processes to obtain an optimized process is proposed. Finally, application of the texturing process to silicon heterojunction solar cells is described.
Experimental
Texturization of the silicon wafers
Commercial as-cut, [100] oriented, 190 ± 20 μm, and N-doped (1–3 Ω cm) Cz-silicon substrates of area 5 cm × 5 cm were used in all the etching processes and in solar cell fabrication. The bulk lifetime of this kind of Cz-silicon substrate at a 1015 cm−3 injection level is about 1 ms. To maintain a constant temperature and limit evaporation of the solution, the etching processes were carried out in a capped glass vessel immersed in a constant-temperature water bath. Before the etching process, the samples were cleaned by ultrasonication using acetone for 10 min to remove organic residues and were rinsed in deionized water. Then the samples were immersed in a piranha solution (H2SiO4![[thin space (1/6-em)]](https://www.rsc.org/images/entities/char_2009.gif) :
:![[thin space (1/6-em)]](https://www.rsc.org/images/entities/char_2009.gif) H2O2 = 3
H2O2 = 3![[thin space (1/6-em)]](https://www.rsc.org/images/entities/char_2009.gif) :
:![[thin space (1/6-em)]](https://www.rsc.org/images/entities/char_2009.gif) 1) for 5 min to take off oxidized organic residues that were not removed by the first step. Next, the oxide layer was removed with a 1% HF solution. In order to remove the saw damage, the wafers were dipped in a 10 wt% NaOH solution at 80 °C for 15 min. After that, wafer texturization was conducted for 40 min at different temperatures in a solution of 1 wt% NaOH, 1 wt% Na2SiO3, and 6% IPA, followed by a chemical polishing solution (HF
1) for 5 min to take off oxidized organic residues that were not removed by the first step. Next, the oxide layer was removed with a 1% HF solution. In order to remove the saw damage, the wafers were dipped in a 10 wt% NaOH solution at 80 °C for 15 min. After that, wafer texturization was conducted for 40 min at different temperatures in a solution of 1 wt% NaOH, 1 wt% Na2SiO3, and 6% IPA, followed by a chemical polishing solution (HF![[thin space (1/6-em)]](https://www.rsc.org/images/entities/char_2009.gif) :
:![[thin space (1/6-em)]](https://www.rsc.org/images/entities/char_2009.gif) HNO3
HNO3![[thin space (1/6-em)]](https://www.rsc.org/images/entities/char_2009.gif) :
:![[thin space (1/6-em)]](https://www.rsc.org/images/entities/char_2009.gif) CH3COOH = 1
CH3COOH = 1![[thin space (1/6-em)]](https://www.rsc.org/images/entities/char_2009.gif) :
:![[thin space (1/6-em)]](https://www.rsc.org/images/entities/char_2009.gif) 3
3![[thin space (1/6-em)]](https://www.rsc.org/images/entities/char_2009.gif) :
:![[thin space (1/6-em)]](https://www.rsc.org/images/entities/char_2009.gif) 3) for 30 s. Finally, the textured wafers were cleaned by the standard RCA cleaning process followed by a smoothing process [1% HF for 3 min, piranha solution (H2SiO4
3) for 30 s. Finally, the textured wafers were cleaned by the standard RCA cleaning process followed by a smoothing process [1% HF for 3 min, piranha solution (H2SiO4![[thin space (1/6-em)]](https://www.rsc.org/images/entities/char_2009.gif) :
:![[thin space (1/6-em)]](https://www.rsc.org/images/entities/char_2009.gif) H2O2 = 3
H2O2 = 3![[thin space (1/6-em)]](https://www.rsc.org/images/entities/char_2009.gif) :
:![[thin space (1/6-em)]](https://www.rsc.org/images/entities/char_2009.gif) 1) for 5 min]. Before the wafers were transferred into the load lock of a plasma-enhanced chemical vapor deposition (PECVD) system, they were dipped in 1% HF solution to remove their native oxide layer.
1) for 5 min]. Before the wafers were transferred into the load lock of a plasma-enhanced chemical vapor deposition (PECVD) system, they were dipped in 1% HF solution to remove their native oxide layer.
Fabrication of SHJ solar cells
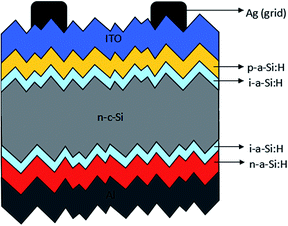
The SHJ solar cells were deposited by a multichamber cluster radio frequency PECVD system. As is shown in Fig. 1, the structure of the silicon heterojunction solar cells is Ag/ITO/p-a-Si:H/i-a-Si:H/n-c-Si/i-a-Si:H/n-a-Si:H/Al. The p-a-Si:H and n-a-Si:H films were deposited in two separate chambers of the PECVD system at 180 °C. The p-a-Si:H films were deposited using gaseous mixtures of silane (SiH4), trimethylboron (TMB), and H2. The n-a-Si:H films were deposited using gaseous mixtures of SiH4, phosphine (PH3), and H2. The ITO layer (∼80 nm thick), the Ag grid (∼600 nm thick), and the Al back contact (∼600 nm thick) were made by thermal evaporation and patterned onto the 1 cm2 pad area.Characterization
The surface morphology of the textured silicon surface was measured with a scanning electron microscope (SEM, ZEISS SUPRA 55VP). Spectral hemispherical reflection of the textured wafers was tested using a Varian-Cary 5000 integrating sphere spectrophotometer. To quantify the quality of passivation, 10 nm thick i-a-Si:H films were symmetrically deposited on the textured wafers, and effective lifetime measurements were made by a noncontact Sinton WCT-120 tool in transient mode. The current–voltage (J–V) characteristics of the solar cells were measured at 100 mW cm−2 at 25 °C using an AM 1.5G solar simulator. The external quantum efficiency (EQE) was obtained by measuring the spectral response.Results and discussion
Influence of the etching temperature on texturization
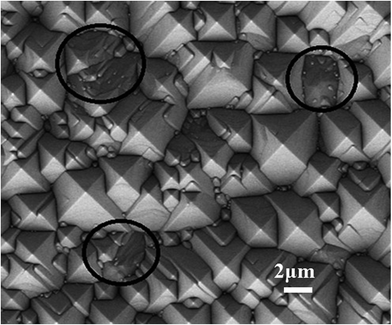
Generally, the temperature range in a texturing process involving an alkaline and IPA mixed solution is from 75 °C to 80 °C. The boiling temperature of IPA is known to be 82 °C, so if the temperature exceeds 80 °C, excessively quick evaporation of IPA from the etching solution will deteriorate the texturization. Fig. 2 shows SEM images of the textured silicon surface when the texturing temperature is 80 °C after 40 min of texturing time. From the areas marked by the black circles in Fig. 2(a), one can see that in some places no pyramids exist, and in other places the peaks of certain pyramids have collapsed. Obviously, reflection will become high in areas that are not fully covered by the pyramids. In addition, the size of many of the pyramids processed at such a temperature exceeds 10 μm. Meanwhile, the size of some of the other pyramids is still on the submicron scale. The high etching temperature yields a high etching rate and results in the formation of large pyramids. However, the density of the pyramids is not sufficient to cover the surface completely. Furthermore, the inhomogeneous distribution and inadequate coverage of the pyramids will lead to more defects and deteriorate the passivation of the a-Si:H/c-Si interface.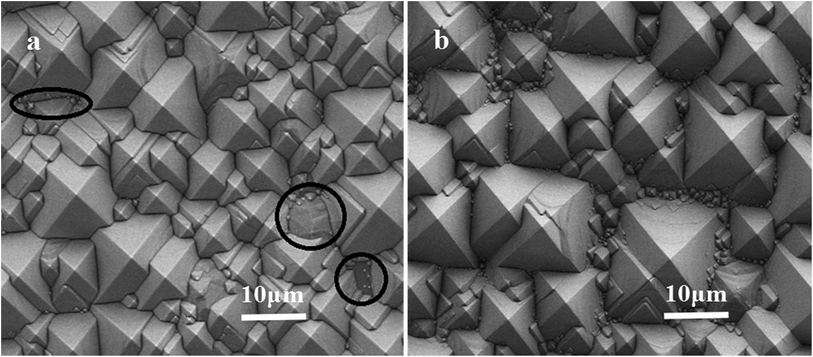 | ||
| Fig. 2 SEM images of the silicon surface textured at 80 °C for 40 min. (a) After the chemical polish treatment, (b) before the chemical polish treatment. | ||
Fig. 2(b) shows a SEM image of the silicon surface textured at 80 °C for 40 min, before the chemical polish treatment. There are many submicronic pyramids at the edges of the large pyramids. This indicates that the nucleation and growth of the pyramids occur simultaneously. This agrees with the observations of Bachtouli et al.16 From Fig. 2(a) and (b), we can conclude that at 80 °C the etching rate is too high to be controlled easily.
Fig. 3 shows a SEM image of the silicon surface textured at 75 °C for 40 min. There are many areas marked with black circles, where no pyramids have formed. This will increase the reflection of the textured surface. In addition, the size of the pyramids ranges from approximately 5 μm to submicrons—smaller than those textured at 80 °C. In principle, the higher the temperature, the faster the etching rate. Furthermore, the faster the etching rate, the bigger the size of the pyramids. This occurs because the etching rates of the (100) and (110) crystallographic planes increase faster than those of the (111) crystallographic plane when the temperature increases.17 Generally, the pyramid density will increase if the pyramids are small; as a result, the density of the pyramid valleys (which plays a role in the deterioration in quality of the a-Si:H/c-Si interface passivation) will increase. The increased recombination rate in these valleys can be explained by local epitaxial growth and/or a mixed phase, making a nonabrupt a-Si:H/c-Si interface.18
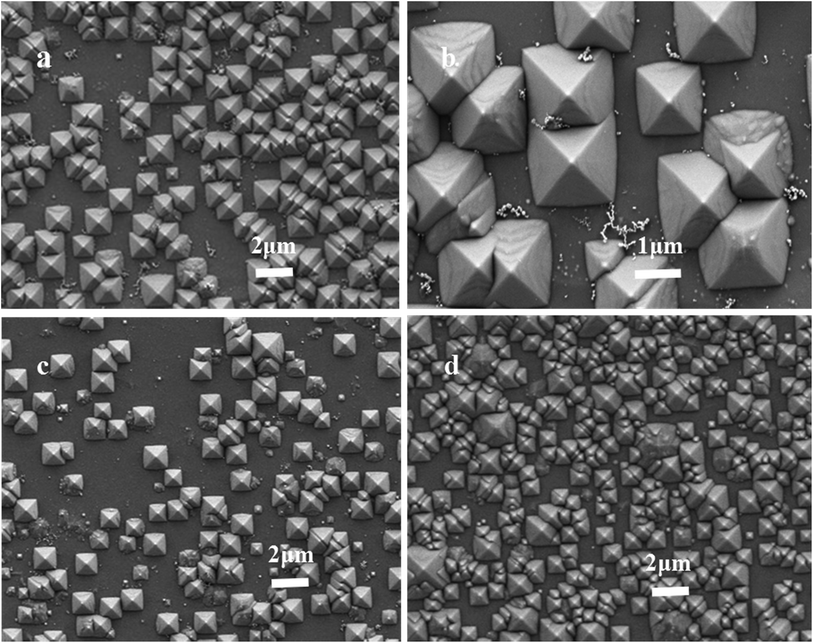
As is well known, the stage of pyramid nucleation is a crucial period for texturing. Therefore, in order to understand fully the origin of differences between morphology at 80 °C and 75 °C after the 40 min texturing time, texturing experiments whose duration is only 5 min at different temperatures are carried out. Fig. 4(a)–(d) show SEM images of the silicon surfaces textured at 75 °C, 75 °C, 80 °C, and 75/80 °C (increasing the temperature from 75 °C to 80 °C at a constant rate in 5 min, and then keeping the temperature constant at 80 °C for another 35 min) with a duration of 5 min. Comparing Fig. 4(a) with Fig. 4(c), the density of pyramid nucleation at 75 °C is higher than the density at 80 °C. However, both approaches result in pyramids of approximately 2 μm, owing to competition between the nucleation and growth of the pyramids. Low temperature increases the absorption of nonreactive and massive ions and particles (Na+, IPA) on the surface and restricts the access of OH−, which is responsible for silicon oxidation. This leads to a large number of pyramid starting points and a low etching rate. Therefore, low temperatures such as 75 °C are beneficial for pyramid nucleation. However, one can observe from Fig. 4(b) that some flocculent precipitates were left around the pyramids. As is well known, the chemical equation of the etching reaction is as follows:
| Si + 2NaOH + H2O → Na2SiO3 + 2H2↑ | (1) |
In eqn (1), the oxidant is water (H2O), and the deoxidizer is silicon (Si). In fact, the reaction process is composed of three reactions:
| Si + 4H2O → H4SiO4 + 2H2↑ | (2) |
| H4SiO4 → H2SiO3 + H2O | (3) |
| H2SiO3 + 2NaOH → Na2SiO3 + 2H2O | (4) |
If the reaction product H4SiO4 [i.e. Si(OH)4] cannot be decomposed into H2SiO3 and H2O [as shown in reaction (3)] and transported into the solution, where it is neutralized by NaOH through reaction (4) in a sufficient and timely manner, it will polymerize and precipitate. Therefore, we deduce that the flocculent precipitates shown in Fig. 4(b) are residual polymerized Si(OH)4, which are harmful to texturing. Clearly, 75 °C is too low a temperature for the timely neutralization of the Si(OH)4. Similarly, Seidel et al.19 reported that for alkaline solutions with a high water concentration, the rate of dissolution of Si atoms from the crystal surface is so high that the transport of the Si(OH)4 complex into the bulk solution cannot maintain its production. When the concentration of this complex on the Si surface becomes too high, it will polymerize and cover the surface.
A further observation from Fig. 4(a) is the nonuniform distribution of pyramid nucleation. However, temperatures that are too high, such as 80 °C, will lead to the excessively quick evaporation of IPA, which results in inhomogeneity of the pyramid nucleation, as shown in Fig. 4(c).
As mentioned above, we can conclude that pyramid nucleation is sensitive to temperature. Low temperatures lead to a large number of pyramid nucleations but have no benefit for the decomposition of Si(OH)4. By contrast, at high temperatures, the etching process is inclined to grow the pyramids instead of resulting in pyramid nucleation. Meanwhile, high temperatures will lead to excessively quick evaporation of IPA and water. This is detrimental to the homogeneity of the pyramid distribution. In other words, constant temperature, whether high or low, is not good enough to result in texturing at the stage of pyramid nucleation. Therefore, we propose a novel texturing process method of two-step texturing temperature control. At the beginning, a low temperature (75 °C) should be used to ensure that large numbers of pyramid nucleations occur on the surface of the silicon wafer. However, to avoid the harmful effects of low temperature (75 °C), once the wafers are immersed in the solution, the temperature is increased to 80 °C at a constant rate in 5 min. This is an effective method to avoid the disadvantageous influence of low temperatures and to improve the growth of the pyramids. Subsequently, the temperature is kept constant at 80 °C for 35 min to ensure that the pyramids grow to large sizes and cover the surface completely. In the following figures we will label this method as “75/80 °C”.
Fig. 4(d) shows a SEM image of the silicon surface textured using the method of modifying the temperature of the solution (the first step of the two-step texturing temperature control) for 5 min. The morphology of the silicon surface shown in Fig. 4(d) is at the stage of pyramid nucleation. Comparing Fig. 4(d) with Fig. 4(a) and (c), one can see that pyramid nucleation using a variable-temperature process is more homogeneous and compact.
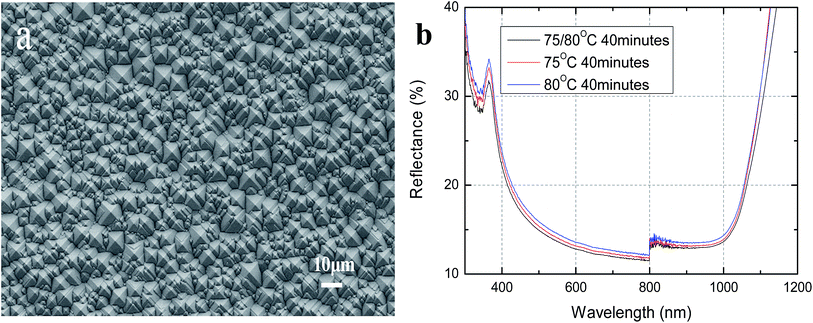
Fig. 5(a) shows a SEM image of the silicon surface textured using the method of modifying the temperature of the solution for 40 min. We can see that the pyramids fully cover the surface and that no blank area exists. Fig. 5(b) plots the reflectance of the wafers textured at different temperatures after a chemical polish treatment as a function of wavelength. We observe that the reflectance resulting from using the variable-temperature method is lower than that at 75 °C and 80 °C. As can be seen from Fig. 5(a), the structure of the pyramid distribution with variable temperature is large pyramids (approximately 10 μm) that are surrounded by some small pyramids of several microns each. Furthermore, the pyramids fully cover the surface, and no blank area exists. Shui-Yang Lien et al.14 found that this kind of structure with large pyramids surrounded by small pyramids can achieve low reflectance by reflecting incident light three times.
Fig. 6 shows a plot of the minority carrier lifetimes at an injection level of 1015 cm−3 of the substrates textured at different temperatures, using symmetrical 10 nm i-a-Si:H layers. As shown in Fig. 6, the effective lifetime and the corresponding implied Voc (not shown in Fig. 6) of the silicon wafers using the variable-temperature method are 1002.4 μs (close to the bulk lifetime of the silicon wafers) and 0.727 V, respectively. These results are higher than those of the wafers textured at a constant low temperature (75 °C) (584.23 μs, 0.713 V) or a constant high temperature (80 °C) (655.77 μs, 0.714 V). In particular, the effective lifetime shows over 50% enhancement compared to those textured at constant temperatures. As previously shown, the effect of texturing the wafers using a variable temperature provides the best results, in which the surface is completely covered with pyramids and there are no blank areas. The average size of the pyramids formed at 75 °C is smaller than that at 80 °C. Consequently, the density of the pyramid valleys, which is detrimental to the passivation of the a-Si:H/c-Si interface, is higher than that at 80 °C. Therefore, compared with the passivation effect of silicon wafers textured at 80 °C, the effective lifetime and corresponding implied Voc of the silicon wafers textured at 75 °C is slightly lower.
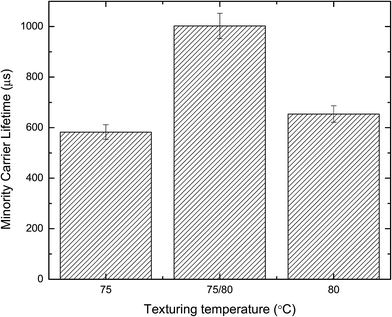 | ||
| Fig. 6 Minority carrier lifetime at an injection level of 1015 cm−3 for texturization substrates textured at different temperatures, using symmetrical 10 nm i-a-Si:H layers. | ||
Performance of SHJ solar cells based on different textured wafers
The results of the J–V measurements are shown in Fig. 7. Clearly, owing to a beneficial passivation effect and low reflection, the parameters of the solar cell based on variable silicon texturing temperature are better than the others. As is well-known, open-circuit voltage is strongly dependent on the passivation effect of the silicon wafers. We can also find out this dependence from the relationship between the lifetime and the corresponding implied Voc. From the results shown in Fig. 6, we see that the sample with a variable texturing temperature has the highest lifetime, i.e. the best passivation effect. As a result, the open-circuit voltage of the solar cell based on a variable texturing temperature is the highest among the different texturing temperature processes. Improved external quantum efficiency in the wave band of blue visible light is achieved, as shown in Fig. 8. From Fig. 5(b), one can see that the reflectance of the sample based on a variable texturing temperature is the lowest among the different texturing temperature processes, which means that much more incident light can be absorbed by the solar cell. Meanwhile, excellent passivation (seen in Fig. 6) reduces the recombination of photo-induced carriers at the a-Si:H/c-Si interface. These two factors improve the external quantum efficiency of the solar cell. Because of the improvement in morphology and excellent passivation at the a-Si:H/c-Si interface by using the method presented above, the films deposit more uniformly and there is no epitaxial growth on the surface of the silicon wafer. These characteristics also improve the fill factor of the solar cell.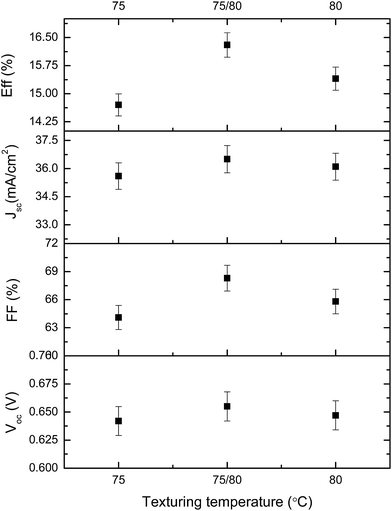 | ||
| Fig. 7 Performance of SHJ solar cells for three types of textured substrates prepared at different temperatures. | ||
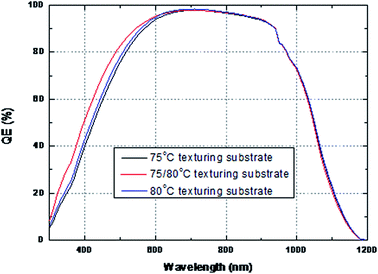 | ||
| Fig. 8 External quantum efficiency (EQE) curves of silicon heterojunction solar cells prepared with different texturing temperatures. | ||
Conclusions
In this work, silicon texturing solutions of NaOH/IPA at different temperatures have been investigated with respect to the size and density of the pyramids obtained as well as the reflection and passivation of the a-Si:H/c-Si interface. SEM images of the texturing silicon surfaces show that pyramid nucleation is sensitive to temperature. Constant temperatures are not suitable for texturing at the stage of pyramid nucleation. Therefore, we proposed a novel texturing process method of two-step texturing temperature control. As a result, an effective lifetime which is close to the bulk lifetime of the silicon wafers and low reflection were achieved. With respect to the SHJ solar cell application, the external quantum efficiency at the wave band of blue visible light and the fill factor of the solar cell were both improved.Acknowledgements
The authors gratefully acknowledge support from the National Basic Research Program of China (Grant No. 2011CBA00706, No. 2011CBA00707), Hi-Tech Research and Development Program of China (2013AA050302), Science and Technology Support Program of Tianjin (12ZCZDGX03600), Major Science and Technology Support Project of Tianjin City (11TXSYGX22100), Natural Science Foundation of China(61474065), International cooperation projects of the Ministry of science and technology(2014DFE60170), and Specialized Research Fund for the PhD Program of Higher Education (20120031110039).Notes and references
- J. Zhao, A. Wang, M. A. Green and F. Ferrazza, Appl. Phys. Lett., 1998, 73, 1991–1993 CrossRef CAS PubMed.
- M. Stefancich, M. Butturi, D. Vincenzi and G. Martinelli, Sol. Energy Mater. Sol. Cells, 2001, 69, 371–379 CrossRef CAS.
- Z. Xi, D. Yang, W. Dan, C. Jun, X. Lin and D. Que, Renewable Energy, 2004, 29, 2101–2107 CrossRef CAS PubMed.
- U. Gangopadhyay, K. Kim, A. Kandol, J. Yi and H. Saha, Sol. Energy Mater. Sol. Cells, 2006, 90, 3094–3101 CrossRef CAS PubMed.
- Y. Nishimoto and K. Namba, Sol. Energy Mater. Sol. Cells, 2000, 61, 393–402 CrossRef CAS.
- R. Chaoui, M. Lachab, F. Chiheub and N. Seddiki, 14th European Photovoltaic Solar Energy Conference, Osaka, Japan, 1997 Search PubMed.
- Z. Xi, D. Yang and D. Que, Sol. Energy Mater. Sol. Cells, 2003, 77, 255–263 CrossRef CAS.
- J. Kegel, H. Angermann, U. Stürzebecher and B. Stegemann, Energy Procedia, 2013, 38, 833–842 CrossRef CAS PubMed.
- J. Kegel, H. Angermann, U. Stürzebecher, E. Conrad, M. Mews, L. Korte and B. Stegemann, Appl. Surf. Sci., 2014, 301, 56–62 CrossRef CAS PubMed.
- J. S. You, D. Kim, J. Y. Huh, H. J. Park, J. J. Pak and C. S. Kang, Sol. Energy Mater. Sol. Cells, 2006, 66, 37–43 CrossRef.
- J. S. You, D. Kim, J. Y. Huh, H. J. Park, J. J. Pak and C. S. Kang, Sol. Energy Mater. Sol. Cells, 2001, 66, 37–44 CrossRef CAS.
- K. Shen and S. Q. Man, Mater. Rev., 2012, 26, 16–18 CAS.
- R. Barrio, N. González, J. Cárabe and J. J. Gandía, Sol. Energy, 2012, 86, 845–854 CrossRef CAS PubMed.
- Y. L. Shui, H. Y. Chih, H. H. Chia, S. L. Yang, C. W. Chao and S. W. Dong, Mater. Chem. Phys., 2012, 133, 63–68 CrossRef PubMed.
- G. Li, Y. Zhou and F. Liu, J. Non-Cryst. Solids, 2012, 358, 2223–2226 CrossRef CAS PubMed.
- N. Bachtouli, S. Aouida and R. H. Laajimi, et al., Appl. Surf. Sci., 2012, 258, 8889–8894 CrossRef CAS PubMed.
- K. B. Sundaram, A. Vijayakumar and G. Subramanian, Microelectron. Eng., 2005, 77, 230–241 CrossRef CAS PubMed.
- J. Damon-Lacoste and P. R. i Cabarrocas, J. Appl. Phys., 2009, 105, 063712–063712–7 CrossRef PubMed.
- H. Seidel, L. Csepregi, A. Heuberger and H. Boumgartel, J. Electrochem. Soc., 1990, 137, 3612–3626 CrossRef CAS PubMed.
| This journal is © The Royal Society of Chemistry 2015 |

