 Open Access Article
 This Open Access Article is licensed under a Creative Commons Attribution-Non Commercial 3.0 Unported Licence
Renewable carbon feedstock for polymers: environmental benefits from synergistic use of biomass and CO2†
Marvin
Bachmann
 a,
Arne
Kätelhön
a,
Benedikt
Winter
ac,
Raoul
Meys
a,
Leonard Jan
Müller
a and
André
Bardow
*abc
a,
Arne
Kätelhön
a,
Benedikt
Winter
ac,
Raoul
Meys
a,
Leonard Jan
Müller
a and
André
Bardow
*abc
aInstitute of Technical Thermodynamics, RWTH Aachen University, 52062 Aachen, Germany
bInstitute of Energy and Climate Research, Forschungszentrum Jülich, 52428 Jülich, Germany
cEnergy & Process Systems Engineering, ETH Zürich, 8092 Zürich, Switzerland. E-mail: abardow@ethz.ch
First published on 25th January 2021
Abstract
Polymer production is a major source of greenhouse gas (GHG) emissions. To reduce GHG emissions, the polymer industry needs to shift towards renewable carbon feedstocks such as biomass and CO2. Both feedstocks have been shown to reduce GHG emissions in polymer production, however often at the expense of increased utilization of the limited resources biomass and renewable electricity. Here, we explore synergetic effects between biomass and CO2 utilization to reduce both GHG emissions and renewable resource use. For this purpose, we use life cycle assessment (LCA) to quantify the environmental benefits of the combined utilization of biomass and CO2 in the polyurethane supply chain. Our results show that the combined utilization reduces GHG emissions by 13% more than the individual utilization of either biomass or CO2. The synergies between bio- and CO2-based production save about 25% of the limited resources biomass and renewable electricity. The synergistic use of biomass and CO2 also reduces burden shifting from climate change to other environmental impacts, e.g., metal depletion or land use. Our results show how the combined utilization of biomass and CO2 in polymer supply chains reduces both GHG emissions and resource use by exploiting synergies between the feedstocks.
Introduction
In 2015, polymers caused about 1.8 GtCO2-eq of GHG emissions over their entire life cycles, accounting for about 4% of the global annual GHG emissions.1 This contribution is expected to increase to around 15% by 2050, due to a sharp rise in the demand for polymers.1,2 Most GHG emissions from polymer production are caused by fossil resources that supply both energy and carbon feedstocks.3 While renewable energy can potentially replace fossil resources for energy generation in the future, the production of polymers will still require a carbon source. Therefore, a renewable carbon source is needed to reduce GHG emissions from polymer production.4Two renewable carbon sources have been discussed intensively for polymer production: carbon dioxide (CO2) and biomass. The use of CO2 in polymer production is an example of so-called Carbon Capture and Utilization (CCU).5 In general, CCU technologies capture CO2 from industrial point sources or ambient air and convert the captured CO2 into fuels, chemicals, or even building materials.5,6 Some CCU technologies already exist on an industrial scale, e.g., the production of methanol7 or polymers such as polycarbonates8 and polyols for polyurethanes.9,10 CCU technologies have shown great potential for reducing life-cycle GHG emissions of chemicals11,12 and polymers.13 However, CCU technologies do not always reduce the environmental impact of products compared to their fossil counterparts.12 Therefore, the sustainability should be assessed for each CCU technology.13 In particular, the conversion of the chemically rather inert CO2 into valuable products normally requires highly energetic co-reactants such as hydrogen.5 However, hydrogen from today’s largely fossil-based production would usually increase GHG emissions.14 Alternatively, hydrogen can be produced by water electrolysis, enabling renewable and low-carbon electricity to be integrated into the life cycle of polymers. As a result, the demand for renewable electricity would increase, leading to direct competition between the polymer industry and other energy-intensive sectors. Preferentially, renewable electricity should be used for applications with the highest efficiency.15
Biomass is also already used in various industrial-scale applications, in particular to provide bio-energy or as a feedstock for biofuels.16 Biomass is also used industrially to produce surfactants17 or polymers such as polyethylene,18 polyethylene terephthalate,19 or polyols for polyurethanes.20–22 Sugar cane bagasse, vegetable oils, and corn stover are mostly used as feedstocks for bio-based production.18,20,21 Bio-based production can reduce the life-cycle GHG emissions of products.23,24 However, there are concerns about the large-scale implementation of bio-based production, which often increases other environmental impacts, such as acidification or eutrophication.23,25,26 Biomass is seen as an increasingly important renewable energy source, for example, in the revised renewable energy directive of the European Union (2018/2001/EU).27 The increasing use induces competition for biomass. However, previous studies have shown that the total amount of available biomass is limited, making efficient use of this resource mandatory.28
The environmental benefits and drawbacks of both biomass utilization and CCU have already been extensively discussed.23,29,30 As a result, it seems not only unlikely but also not desirable to employ a single source of renewable carbon feedstock in all cases. Therefore, concepts have been proposed for the combined utilization of biomass and CO2, e.g., for bio-hybrid fuels.31 However, potential environmental synergies from the combined utilization of biomass and CO2 have not been quantified so far.
This study analyzes the combined use of bio- and CCU-based technologies to quantify synergies for GHG mitigation and resource efficiency for polymer production. As a representative example of a polymer with a high market value and volume, we study flexible polyurethane (PUR) foams. PUR can be used in a wide range of applications, making it the most versatile polymer among synthetic materials.32 PUR is particularly well suited for this study, as PUR production offers possibilities for both direct and indirect utilization of biomass and CO2.32 To quantify potential synergies of biomass and CO2 utilization, we build a bottom-up Technology Choice Model of the fossil-based polyurethane supply chain.33 The model includes 47 production processes based on engineering-level data for a detailed accounting of the flows of mass and energy throughout the entire supply chain. We integrate bio- and CCU-based technologies into the model to assess their technical potential for GHG reduction. For this purpose, we identify the optimal choice of technologies, depending on the availability and carbon footprint of biomass and renewable electricity. We quantify potential benefits from the synergistic utilization of biomass and CO2 before we highlight the effects on other environmental impacts.
Bottom-up model for polyurethane production
In this study, we quantify the environmental benefit from the synergistic use of biomass and CO2. For this purpose, we build a bottom-up model of the polyurethane (PUR) supply chain. The model contains the conventional, fossil-based production of flexible PUR foams as well as bio- and CCU-based production alternatives (Fig. 1).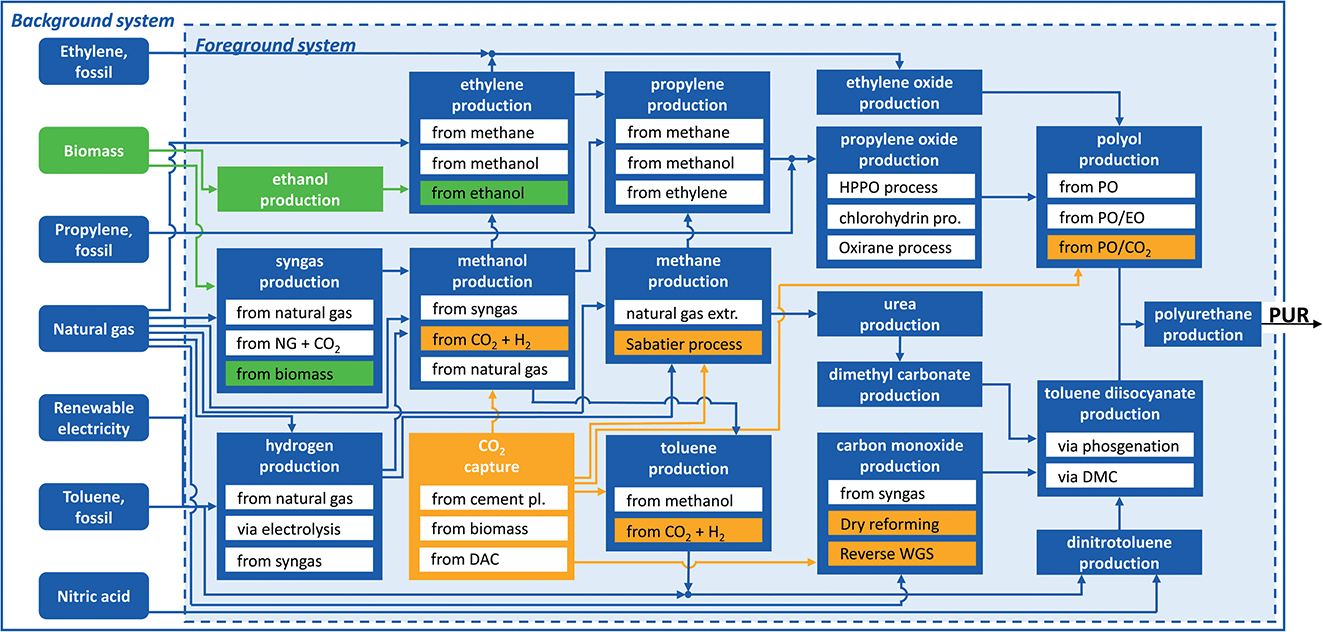 | ||
| Fig. 1 Simplified representation of the polyurethane (PUR) production system. The foreground system is based on engineering-level data of 47 processes. Data for the background system is taken from Ecoinvent and includes all other raw material and energy flows needed for production. For better readability, only the most important processes and material flows are shown. Bio-based processes are highlighted in green and CCU technologies are highlighted in orange. A detailed list of all processes is provided in the ESI.† | ||
Scope
Furthermore, we divide the system boundary into the foreground and background systems (Fig. 1). The foreground system is based on engineering-level data of 47 processes enabling a detailed analysis of the entire supply chain. Within the foreground system, we consider energy and material flows. However, we neglect the environmental impacts of plant construction in the foreground system since the environmental impacts of chemical plant construction are usually small and similar for conventional and alternative production pathways.35 The background system is based on aggregated datasets from the LCA database Ecoinvent.36 For the aggregated datasets, we have used global markets as the default. If no data for global markets were available, we used the European counterparts. A list of all processes and data sources is provided in the ESI.†
Through CCU, CO2 substitutes epoxides in polyol production directly or via methanol, methane, or toluene. The latter routes require hydrogen as a co-reactant to activate the CO2. Additionally, carbon monoxide can be produced by reverse water–gas shift (WGS) or dry reforming of CO2 using hydrogen or methane, respectively.
It should be noted that the CO2-to-toluene process is currently at an early development stage, with a technology-readiness level (TRL) far below 7.30 Therefore, data availability for the toluene process is limited, resulting in high uncertainties in the life cycle inventory. The methodology used to generate the life cycle inventory for the toluene process is adapted from Kätelhön et al. (see ESI†).30
In this study, we use miscanthus as a perennial energy crop. The carbon footprint of miscanthus depends on the carbon content of miscanthus, land-use change, and additional cultivation efforts, e.g., harvesting methods or application of fertilizers and pesticides.45 During the growth phase, miscanthus absorbs CO2 from the atmosphere. The amount of CO2 absorbed depends on the carbon content of miscanthus. For absorbing 1 kg of CO2, we give a credit of 1 kgCO2-eq as negative GHG emissions. We assume an average carbon content of 48%![[thin space (1/6-em)]](https://www.rsc.org/images/entities/char_2009.gif) 46 and a moisture content of 14%,36 resulting in a credit of 1.5 kgCO2-eq per kilogram miscanthus. We consider GHG emissions from additional cultivation efforts by using data from Ecoinvent. For LUC emission, we assume a range of −200 to 380 gCO2-eq per kilogram miscanthus according to Dunn et al.44 It should be noted that the maximum LUC emissions represent a worst case actually based on switchgrass to consider the full range of LUC emissions from perennial energy crops. In total, we vary the carbon footprint of miscanthus cultivation between −1.7 and −1.0 kgCO2-eq/kgbiomass. Through this variation, we identify tipping points for which bio-based production is more environmentally friendly than conventional production.
46 and a moisture content of 14%,36 resulting in a credit of 1.5 kgCO2-eq per kilogram miscanthus. We consider GHG emissions from additional cultivation efforts by using data from Ecoinvent. For LUC emission, we assume a range of −200 to 380 gCO2-eq per kilogram miscanthus according to Dunn et al.44 It should be noted that the maximum LUC emissions represent a worst case actually based on switchgrass to consider the full range of LUC emissions from perennial energy crops. In total, we vary the carbon footprint of miscanthus cultivation between −1.7 and −1.0 kgCO2-eq/kgbiomass. Through this variation, we identify tipping points for which bio-based production is more environmentally friendly than conventional production.
To consider the decentralized production and seasonality of biomass, our model includes transportation and storage. Following Styles et al., we assumed an average transportation distance of 150 km.47 As the storage technique for biomass, we assume ambient storage with a material loss of 1% per month and an average storage duration of 6 months.48
For the conversion of perennial energy crops into chemicals, we integrate gasification49 and fermentation50 processes. The gasification processes convert miscanthus into synthesis gas with a molar hydrogen-to-carbon monoxide ratio of 2:1. This synthesis gas can be further processed into methanol. Alternatively, miscanthus can be fermented to ethanol, which can, in turn, be oxidized to ethylene. Details of the alternative biomass to miscanthus and the considered processes can be found in the ESI.†
Computational structure
The bottom-up model of the PUR supply chain builds on the Technology Choice Model (TCM), a linear optimization model.33 The TCM represents the production system by four basic entities: technologies, the final demand, intermediate flows, and elementary flows. These entities are adapted from the ISO standard for LCA52,53 and are discussed in the following.Technologies transform inputs of energy, materials, or other goods and services into products. Here, technologies represent, e.g., the conversion technologies for CO2 and biomass. Multiple technologies interact to generate the output of the production system, hereafter named the final demand. The final demand is here 1 kg of polyurethane (PUR). Inputs and outputs of technologies can be further divided into intermediate flows and elementary flows. Intermediate flows are outputs of a technology that are used by another technology within the same production system or as the final demand. Elementary flows are flows exchanged between the production system and the environment, e.g., CO2 emissions.
The TCM is based on the computational structure of LCA introduced by Heijungs and Suh.54 Here, the technology matrix A includes all technologies of the production system as well as all intermediate flows. All flows are represented by the rows of the A matrix, while its columns represent the technologies. In the A matrix, a coefficient aij corresponds to an intermediate flow i that is either produced (aij > 0) or consumed (aij < 0) by technology j. The final demand for intermediate flow i is described by coefficient yi in vector y.
The production system produces a large number of by-products besides PUR and, thus, is multifunctional. We resolve the multifunctionality problem by system expansion via substitution, following the ISO standard and the LCA guidelines for CCU.41,52,53 By giving a credit for the avoided conventional production of by-products, we show the product-specific impacts of 1 kg PUR.
Elementary flows are included in the elementary flow matrix B. Similar to the A matrix, bej describes an elementary flow that is either taken from (bej < 0) or emitted to (bej > 0) the environment by technology j. To assess the environmental impacts of a production system, elementary flows are characterized by the characterization matrix Q. Here, the coefficient qze represents the relative contribution of elementary flow e to environmental impact category z, e.g., the conversion factor for methane emission to CO2-equivalents to account for the impact on climate change.
In the PUR production system, the same intermediate flow can be produced by several technologies with different environmental impacts. To identify the technology mix with the lowest environmental impact, TCM employs linear optimization. The objective function for the optimization is here chosen as the environmental impact of the PUR production system, which can be calculated as
| h = QBs |
The optimization problem is defined as follows:
| min hGHG = qGHGBs |
| s.t. As = y |
| s ≤ c |
| sj ≥ 0 |
GHG mitigation through the utilization of either biomass or CO2
In the following section, we first quantify the GHG reduction potentials for using either biomass or CO2 in PUR production. The individual assessments of biomass and CO2 provide a basis for assessing potential benefits through the combined utilization of biomass and CO2 in the subsequent section.Fossil-based production
Fossil-based production leads to about 7.6 kgCO2-eq/kgPUR of GHG emissions from cradle to grave. GHG emissions result from the supply of raw materials (38%) and utilities (22%), direct emissions (12%), and EoL treatment (28%). The supply of grid electricity and process steam account for 7% and 15% of GHG emissions, respectively. Our results correspond well with the GHG emissions of fossil-based PUR production in Ecoinvent.36 PUR is produced by reacting a PO/EO polyether polyol with TDI. EO is produced by oxidation of ethylene, and PO is produced from propylene by the HPPO process. Both olefins are produced by standard fossil production pathways. TDI is produced by phosgenation of dinitrotoluene using hydrogen and carbon monoxide, and dinitrotoluene is produced from toluene and nitric acid, both taken from fossil production pathways. Hydrogen for phosgenation and the HPPO process is produced by steam reforming of natural gas, and carbon monoxide is produced by dry reforming of CO2 captured from a cement plant. Fossil-based production consumes about 5 MJ of grid electricity and about 4 kg of process steam. For producing diluted hydrochloric acid in TDI production, we give a credit of 0.7 kgCO2-eq/kgPUR. The credit remains the same in all scenarios in this study, as TDI is always produced via phosgenation.GHG mitigation potential of CCU technologies
CCU technologies can reduce the global warming impact (GWI) of PUR by 45% to 4.2 kgCO2-eq/kgPUR. Here, we can distinguish between the direct and indirect utilization of CO2. The direct substitution of PO and EO in the polyol with 20% CO2 can reduce the GWI of PUR to 7.0 kgCO2-eq/kgPUR without requiring any renewable electricity. When renewable electricity is available in the full decarbonized scenario, CCU can further reduce the GWI to 4.2 kgCO2-eq/kgPUR. The extent of the reduction depends on the availability and the carbon footprint of electricity (Fig. 2). For carbon footprints of electricity greater than 54 gCO2-eq/MJelectricity, no renewable electricity is used. Thus, CCU technologies reduce the carbon footprint of PUR only when using electricity with a sufficiently low carbon footprint.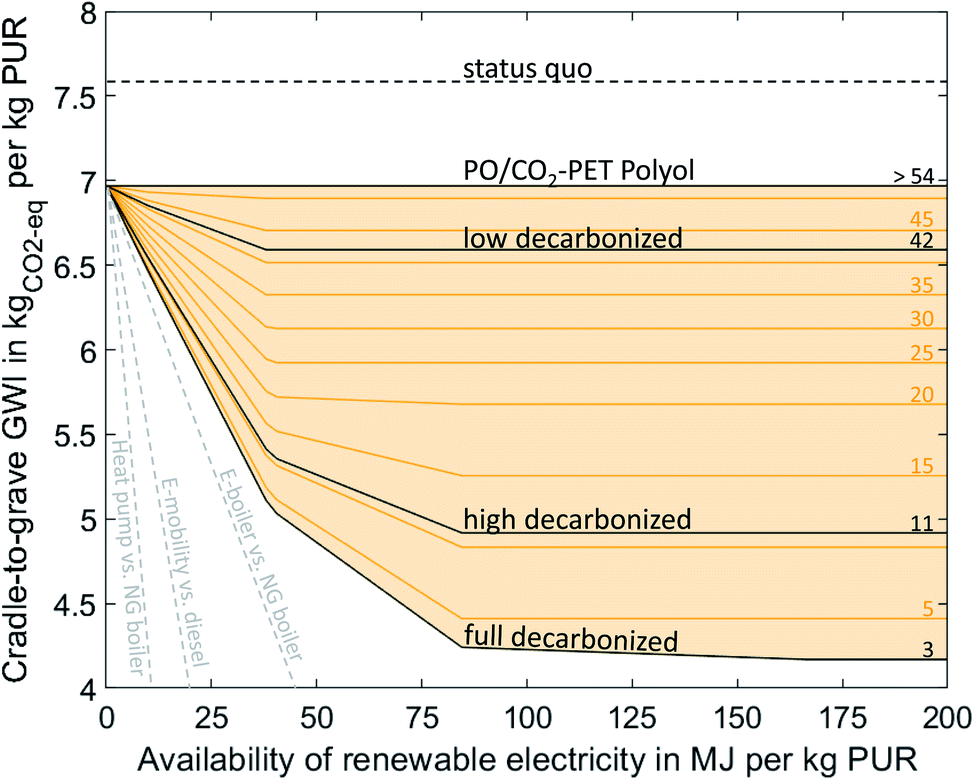 | ||
| Fig. 2 Cradle-to-grave global warming impact (GWI) of 1 kg PUR as a function of the availability (x-axis) for different carbon footprints of renewable electricity (lines). The carbon footprints of renewable energy are expressed in gCO2-eq/MJelectricity above the lines. Cradle-to-grave emissions cover the production stage, including the supply of all raw materials and energy needed for production, as well as emissions from EoL treatment. Scenarios for the carbon footprint of renewable electricity were taken from Müller et al. (low decarbonized = 42 gCO2-eq/MJelectricity, high decarbonized = 11 gCO2-eq/MJelectricity, full decarbonized = 3 gCO2-eq/MJelectricity).41 The dashed gray lines indicate the GHG mitigation efficiency of other power-to-X technologies adapted from Sternberg et al.15 | ||
The best-case CCU-based production is achieved in the full decarbonized scenario with a carbon footprint of renewable electricity of 3 gCO2-eq/MJelectricity. Best-case CCU-based production uses a PO/CO2 polyether polyol with TDI to form PUR. PO is produced by the HPPO process, and the required propylene is produced from ethylene by the Olefins Conversion Technology (OCT). Ethylene is produced by oxidative coupling of methane, which is produced by the Sabatier process using hydrogen from water electrolysis and CO2. TDI is produced in the same way as in the fossil scenario, but with toluene from CO2. The required CO2 is captured from a cement plant. The remaining emissions for CCU-based production result from the supply of nitric acid and a higher demand for process steam and electricity compared to fossil-based production. About 50% more process steam is required to perform the oxidative coupling process, and about 33 times as much electricity is used for water electrolysis compared to fossil-based production. Furthermore, about 100% more grid electricity is required to carry out the OCT, the Sabatier process, the oxidative coupling process, and the CO2 capture.
Ethylene production via the Sabatier process combined with oxidative coupling consumes about three times as much hydrogen and about two times as much steam per kilogram of olefin than the combination of CO2-based methanol and the methanol-to-olefins process. Furthermore, oxidative coupling is less selective and produces several alkanes and other hydrocarbons as by-products. The by-products, however, lead to a total credit of 0.3 kgCO2-eq/kgPUR. While using less steam and hydrogen, production via methanol requires about three times as much grid electricity. Therefore, the cleaner the renewable electricity and thus the hydrogen from the water electrolysis, the more competitive production via oxidative coupling becomes in terms of GHG emissions. However, ethylene production via oxidative coupling only emits less GHG emissions than production via methanol in the full decarbonized scenario. In this case, both technologies are quite similar and we believe that the differences are not significant given the current uncertainties in the energy demand.
In total, the best-case CCU production consumes about 167 MJ renewable electricity for water electrolysis and about 10 MJ of grid electricity per kilogram PUR. Due to the large demand and limited supply, we varied the amount of renewable electricity available (Table 1). With less renewable electricity available, production gradually switches from CCU-based production to fossil-based production. Furthermore, CCU technologies are not equally efficient in using renewable electricity to avoid GHG emissions. Therefore, the GHG emission reduction depends non-linearly on the availability of renewable electricity. It should be noted that all CCU technologies except the direct substitution of PO avoid less GHG emissions per MJ renewable electricity used than other power-to-X technologies such as e-mobility or power-to-heat (grey lines in Fig. 2). Consequently, CCU technologies should only be used for PUR production if sufficient renewable electricity is available to supply also the more efficient power-to-X technologies.
| Available renewable electricity per kg PUR | Chemical | From technology | To technology |
|---|---|---|---|
| 10 MJ | Hydrogen | Hydrogen from natural gas | Hydrogen from electrolysis |
| 38 MJ | Toluene | Fossil toluene | Toluene from CO2 |
| 41 MJ | Carbon monoxide | Dry reforming | Reverse WGS |
| 84 MJ | Propylene | Fossil propylene | Methanol from CO2 + H2 and methanol-to-olefins and ethylene dimerization by OCT |
| 167 MJ | Ethylene | Methanol from CO2 + H2 and methanol-to-olefins | Sabatier process and oxidative coupling of methane |
GHG mitigation potential of biomass
Biomass utilization can reduce the GWI of PUR by 46% to 4.1 kgCO2-eq/kgPUR (Fig. 3). Again, the first reduction step is the direct substitution of PO and EO in the polyol with CO2, which reduces the GWI from 7.6 kgCO2-eq/kgPUR to 7.0 kgCO2-eq/kgPUR. Although this effect is actually a CCU technology, we include it in the assessment since no renewable electricity is necessary to achieve the reduction. An additional reduction of 38% can be achieved by using miscanthus with the lowest carbon footprint. Here, PUR is also produced by using the PO/CO2 polyether polyol and TDI. The PO required for polyol production is produced from propylene by the HPPO process. Propylene is partially produced by the methanol-to-olefins process and partially produced from ethylene by the OCT. Ethylene is a co-product of the methanol-to-olefins process. Methanol is produced by the conversion of syngas from biomass gasification plants. The excess CO2 from the gasification plants is used to a small extent in polyol production. The remaining CO2 is emitted into the atmosphere. TDI is produced in the same way as in the conventional scenario, but with toluene from the methanol-to-toluene process and carbon monoxide from syngas separation. Syngas separation provides some of the hydrogen required for the HPPO process and the phosgenation of dinitrotoluene. The remaining hydrogen is produced by steam reforming of natural gas. The remaining emissions are caused by the supply of nitric acid and a higher demand for process steam and grid electricity compared to the fossil benchmark. About 50% more process steam is used in the methanol-to-olefins and methanol-to-toluene processes, and 80% more grid electricity is needed to operate the biomass gasifier. The demand for process steam could be reduced by integrating excess heat from gasification. However, we currently give a credit of 1.2 kgCO2-eq/kgPUR for excess heat, which substitutes heat from natural gas in other district or industrial applications. Since both options substitute natural gas, heat integration does not reduce total GHG emissions.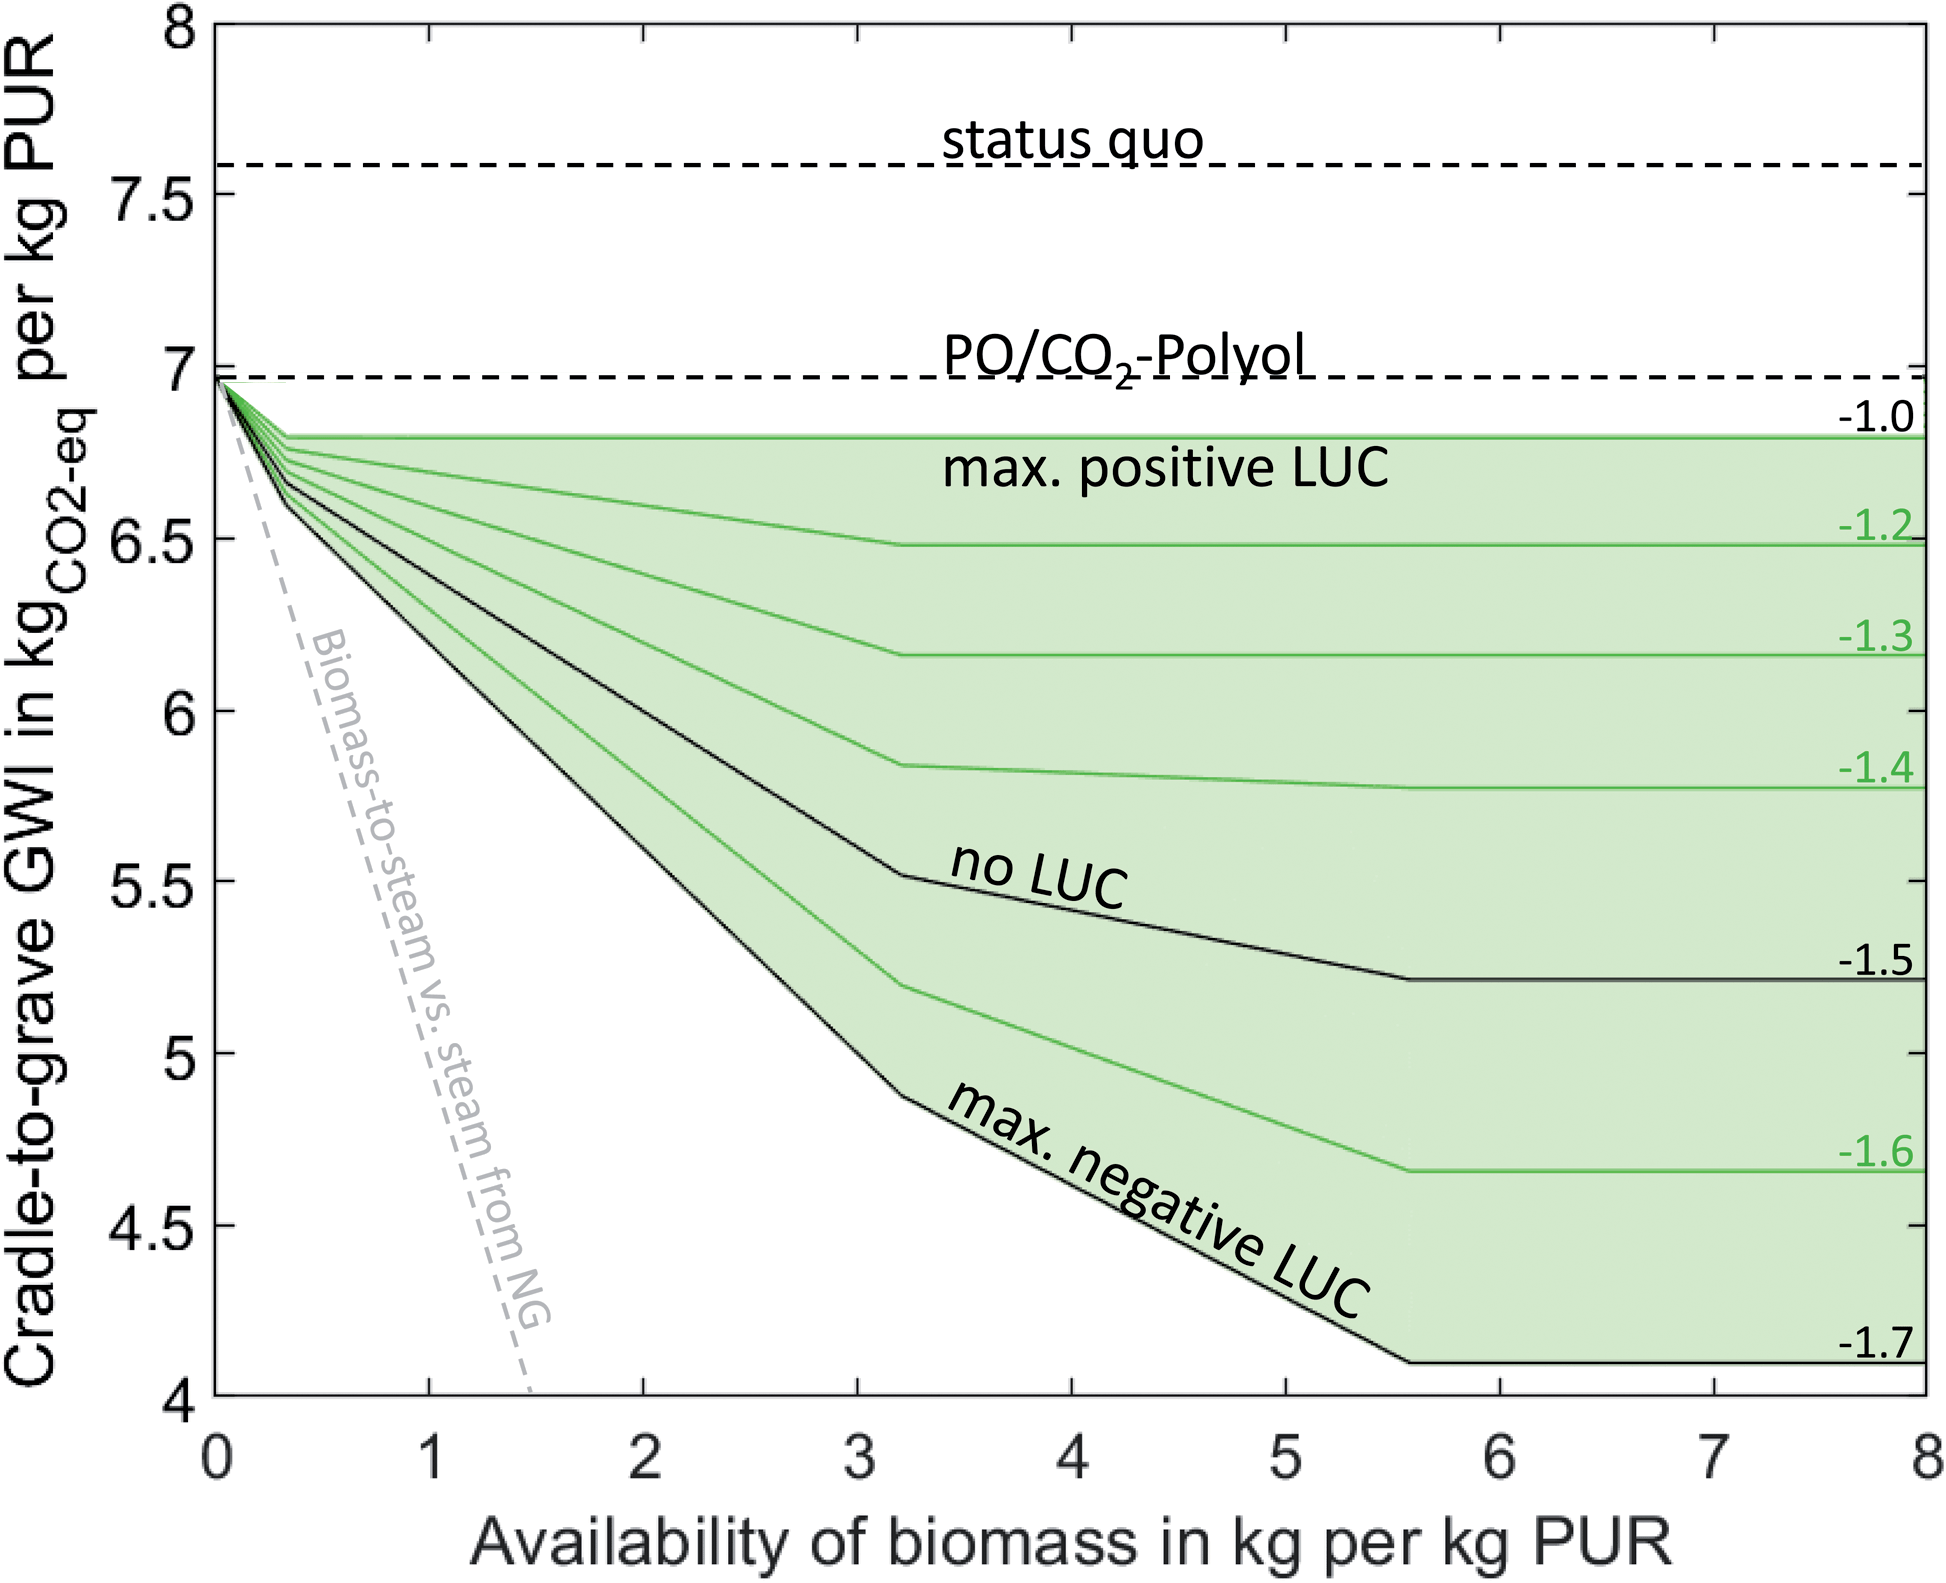 | ||
| Fig. 3 Cradle-to-grave global warming impact (GWI) of 1 kg PUR (y-axis) as a function of the availability of biomass (x-axis) with different carbon footprints (lines). The carbon footprints of biomass are expressed in kgCO2-eq/kgbiomass above the lines. Cradle-to-grave emissions cover the production stage, including the supply of all raw materials and energy needed for production, as well as emissions from EoL treatment. The gray line indicates the GHG mitigation efficiency when using biomass for process steam production to substitute process steam from natural gas. | ||
The GHG reduction depends on the availability and the carbon footprint of miscanthus. GHG emissions are reduced the most by using biomass with the lowest carbon footprint of −1.7 kgCO2-eq/kgbiomass, resulting in a GWI of PUR of 4.1 kgCO2-eq/kgPUR. However, our results indicate that even for a worst-case assumption of −1.0 kgCO2-eq/kgbiomass, GHG emissions can be reduced slightly by 0.2 kgCO2-eq to 6.8 kgCO2-eq/kgPUR.
To reach the maximum GHG reduction, 5.6 kg biomass is required per kg PUR. If the availability of biomass decreases, PUR production gradually switches from bio-based to fossil-based production (Table 2). The GHG reductions depend non-linearly on the availability of biomass since individual biomass utilization technologies have different efficiencies in using biomass to avoid GHG emissions. However, similar to CCU-based production, all biomass utilization technologies are less efficient at reducing GHG emissions per unit of biomass than bio-based process steam generation (grey line in Fig. 3, details in ESI†). Accordingly, bio-based PUR production should only be implemented in regions where more efficient biomass utilization technologies are either unavailable or already exhausted.
| Available biomass | Chemical | From technology | To technology |
|---|---|---|---|
| 0.4 kg | Carbon monoxide and hydrogen | Dry reforming and hydrogen from natural gas | Separation of syngas from biomass gasification |
| 3.2 kg | Propylene | Fossil propylene | Methanol-to-olefins and ethylene dimerization by OCT |
| 5.6 kg | Toluene | Fossil toluene | Methanol-to-toluene |
Overall, utilization of either biomass or CO2 can significantly reduce the GHG emissions of PUR production. However, according to our analyses, substantial quantities of renewable resources are required, which would save more GHG emissions in other sectors. In the following section, we therefore look at combined utilization to determine whether synergies in production may save renewable resources.
Benefits from the synergistic utilization of biomass and CO2
The combined utilization of biomass and CO2 can reduce the GHG emissions of PUR by 59% to 3.1 kgCO2-eq/kgPUR, which corresponds to a 13% higher reduction compared to the utilization of either biomass or CO2 (Fig. 4). Again, the basis is the PO/CO2 polyether polyol, which needs neither biomass nor renewable electricity. As a result, Fig. 4 already contains the 0.6 kgCO2-eq/kgPUR savings through the direct utilization of CO2 in the polyol. Combined utilization avoids more GHG emissions due to synergies in production. At the point of maximum reduction, PUR production is similar to the bio-based optimum, but less biomass is converted to syngas for methanol production. Instead, CO2 from biomass gasification is captured and directly converted to toluene. Thus, bio-based CO2 substitutes the bio-based methanol used in the methanol-to-toluene process. The additional hydrogen required for the CO2-based toluene is produced by water electrolysis. For the maximum reduction, the combined utilization requires 79% less renewable electricity and 43% less biomass than the utilization of either biomass or CO2, while the GHG savings increase. Additionally, combined utilization uses about 20% less process steam than the utilization of either biomass or CO2 since neither oxidative coupling of methane nor the methanol-to-toluene process is used. Excess heat from gasification leads to a credit of 0.7 kgCO2-eq/kgPUR. Again, integrating excess heat could reduce process steam demand but would not reduce total GHG emissions (see discussion above).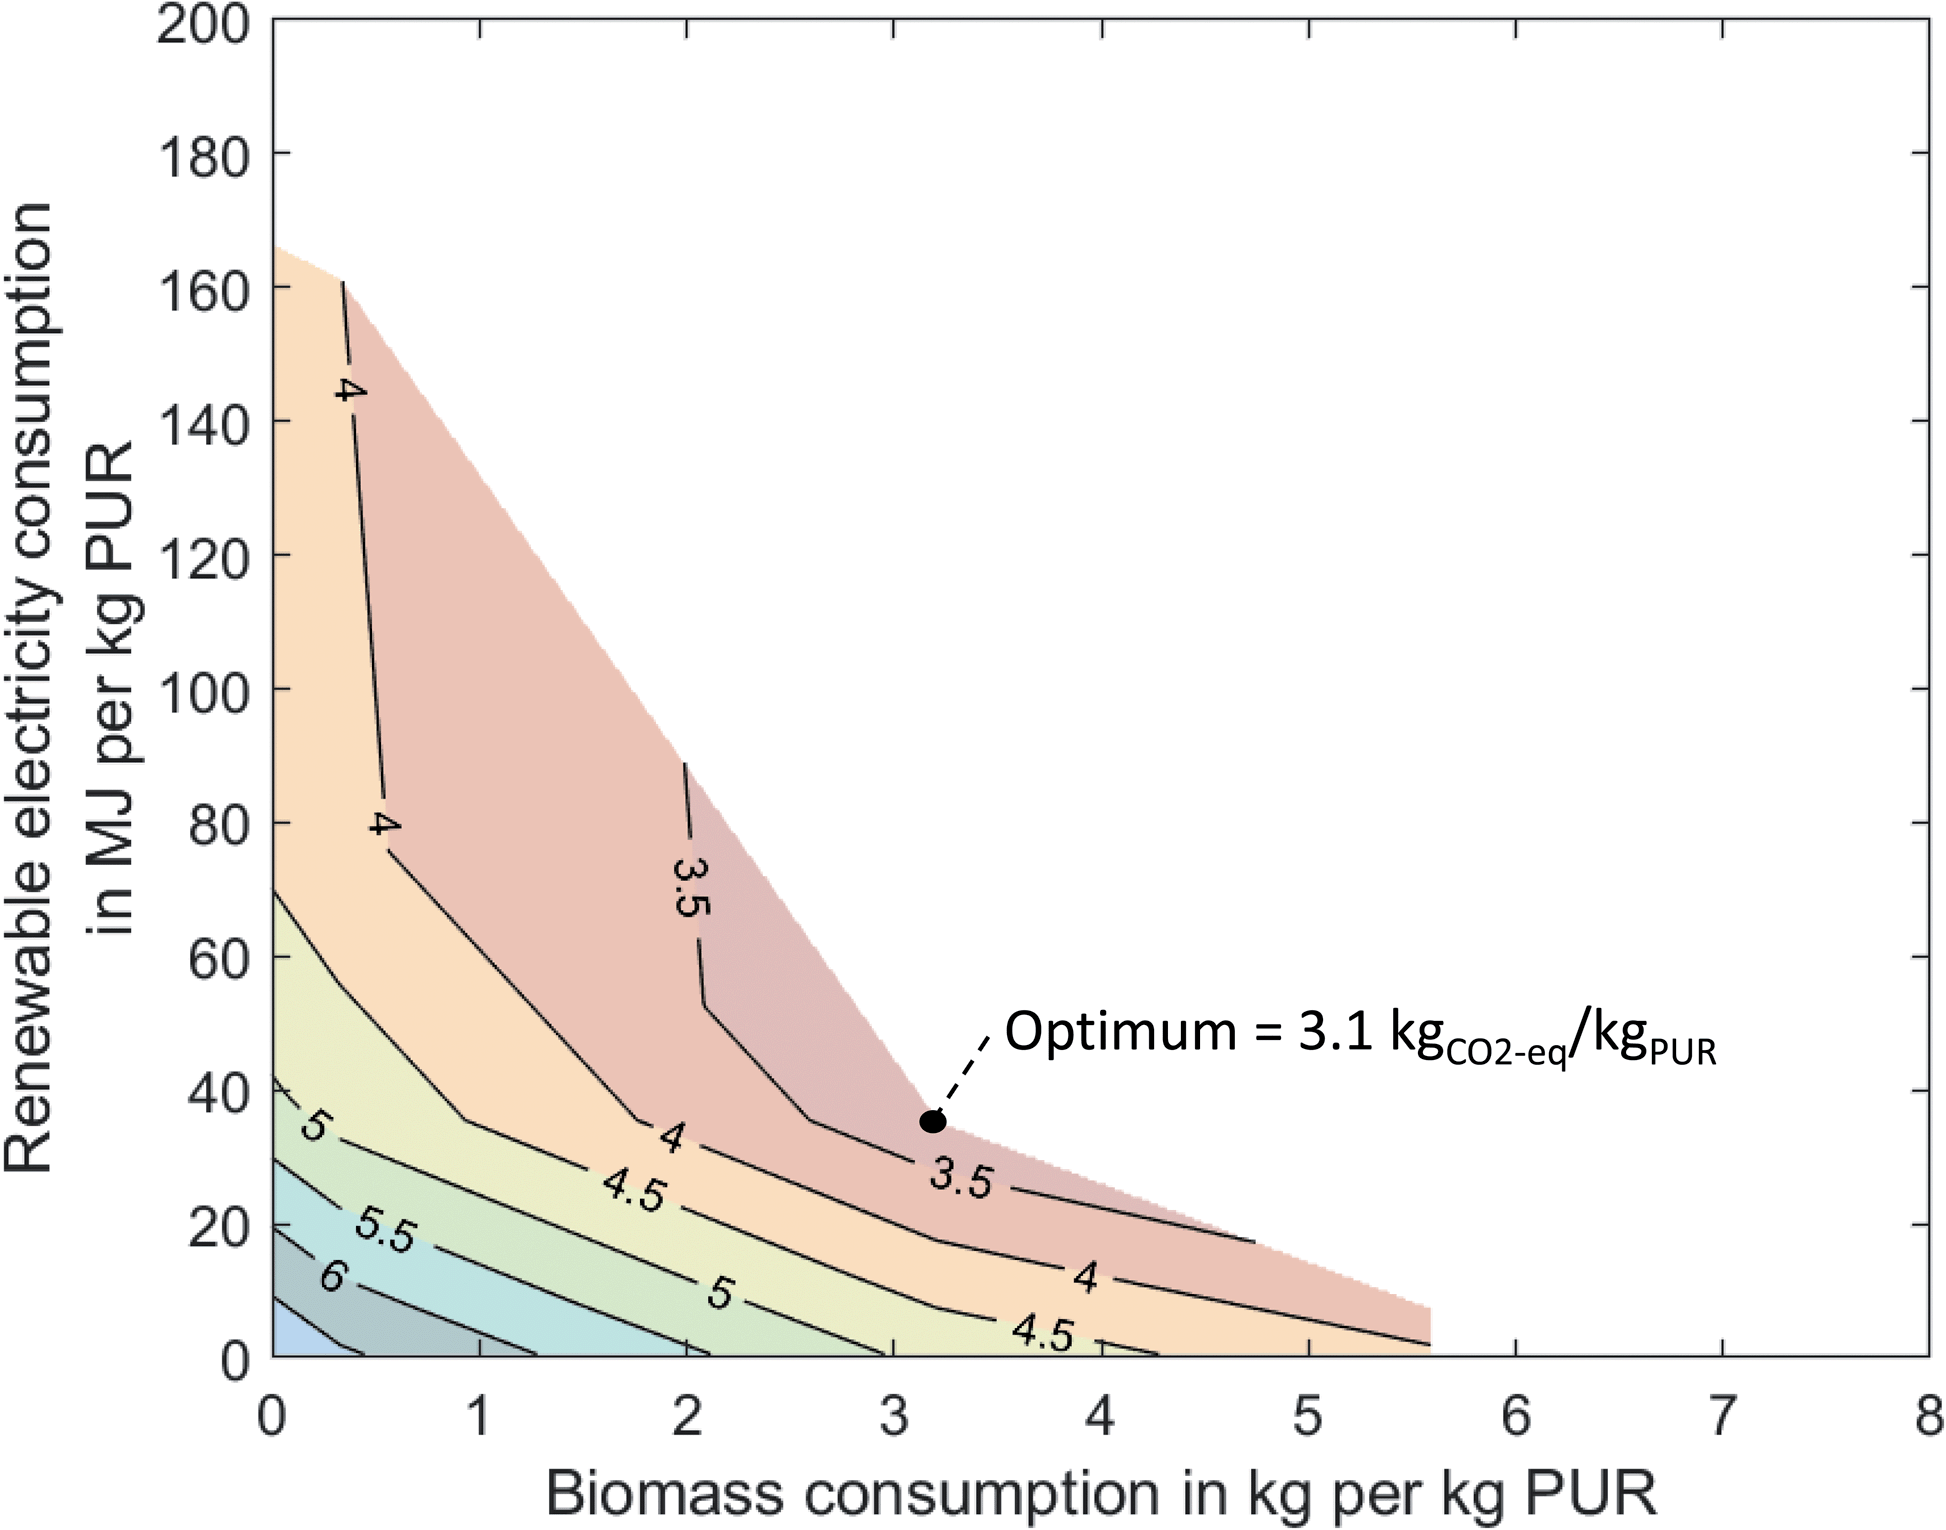 | ||
| Fig. 4 Pareto frontiers of the global warming impact of 1 kg PUR as a function of biomass and renewable electricity consumption. The biomass supply has a global warming impact of −1.7 kgCO2-eq/kgbiomass (best case). The electricity supply has a global warming impact of 3 gCO2-eq/kgPUR (best case). The black curves show combinations of bio-based and CCU-based production with constant global warming impacts (iso-GWI curves). | ||
However, synergies are not only present at the point of maximum reduction but can help to save renewable resources and lower GHG emissions in scenarios where less biomass or renewable electricity is available. When biomass and CO2 are used in separate production facilities, the GHG emissions correspond to a linear combination of the GHG emissions of the separate production facilities. In contrast, Fig. 4 shows that curves with constant GWI (iso-GWI curves) are flattened in combined production. The difference between the linear combination and the iso-GWI curves in Fig. 4 corresponds to the saving of renewable resources. The following example illustrates this effect: by using biomass and CO2 in separate production facilities, GHG emissions can, for instance, be reduced to 4.5 kgCO2-eq/kgPUR. The GHG reduction requires 2 kg of biomass and about 45 MJ of renewable electricity per kilogram PUR. Combined utilization could achieve the same GHG reduction while using only 1.6 kg of biomass and about 33 MJ of renewable electricity. Thus, combined utilization saves about 25% of renewable resources. A more detailed analysis can be found in the ESI.†
Synergies in production depend on the carbon footprint of biomass and renewable electricity. A sensitivity analysis of the effect of the carbon footprint of biomass and renewable electricity on the synergies is available in the ESI.† Overall, our results indicate that the utilization of integrated facilities that combine biomass and CO2 utilization can save GHG emissions and limited resources compared to individual utilization.
However, even in the optimal scenario, the carbon footprint of PUR is not zero. The remaining emissions are due to the use of process steam (35%), grid electricity (25%), and remaining fossil feedstocks (40%), in particular, nitric acid, oxygen, and chlorine. The remaining emissions from process steam and grid electricity supply could be reduced by renewable electricity. For the remaining fossil feedstocks, alternative production routes are under development. Nitric acid, for example, could be produced using ammonia from nitrogen and hydrogen from water electrolysis or biomass.55 Thus, further reducing the carbon footprint of PUR would again increase the demand for renewables.
Effects on other environmental impacts
To assess the full potential of biomass and CO2 as renewable carbon feedstocks, it is important to consider all environmental impacts and analyze potential burden shifting. Thus, we investigate eleven additional impact categories from the ILCD recommendations (V.2.0 2018, Fig. 5). Our results show that environmental impacts increase in nine out of eleven categories for bio- and CCU-based production compared to fossil-based production.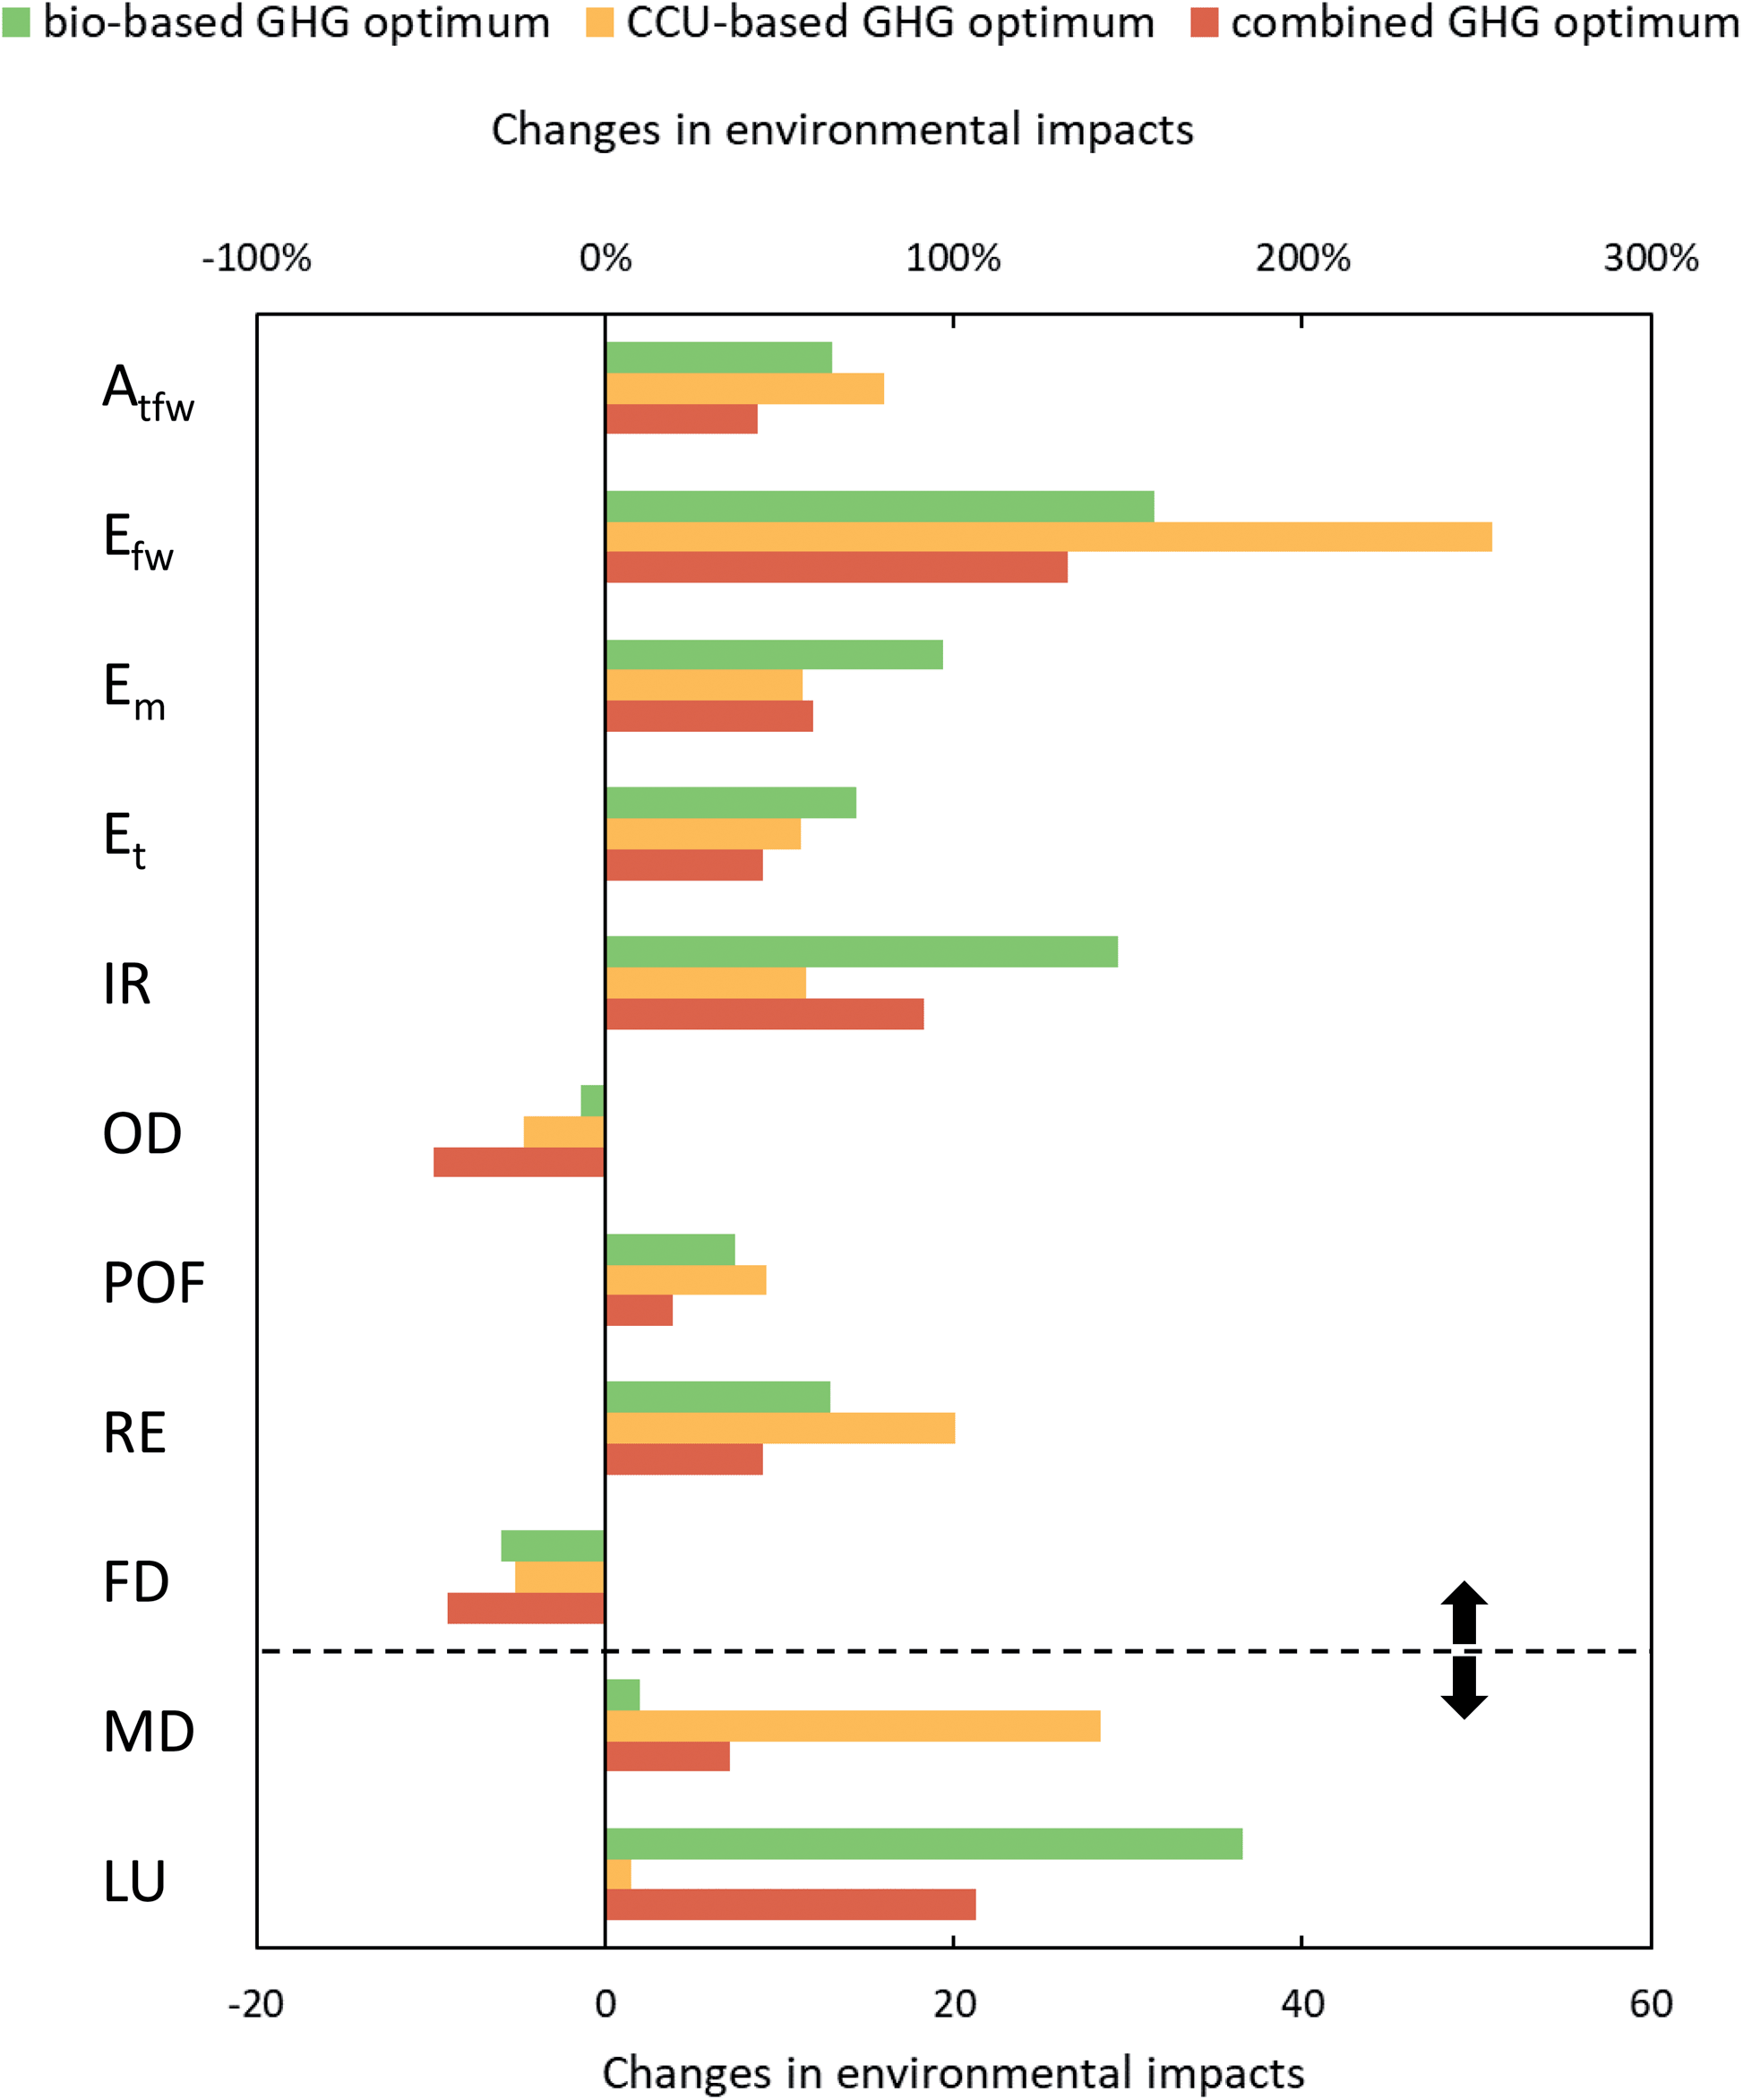 | ||
| Fig. 5 Changes in environmental impacts for bio-based, CCU-based, and combined production normalized to the environmental impacts of fossil-based production with PO/CO2 polyether polyol. Impact categories: Atfw = freshwater and terrestrial acidification, Efw = freshwater eutrophication, Em = marine eutrophication, Et = terrestrial eutrophication, IR = ionizing radiation, OD = ozone layer depletion, POF = photochemical ozone formation, RE = respiratory effects, FD = fossil depletion, MD = mineral and metal depletion, LU = land use. Please note that mineral and metal depletion and land use are shown on the lower x-axis, and all other environmental impacts are shown on the upper x-axis (black arrows). | ||
For the best case of CCU-based production, the highest increase can be seen in the category mineral and metal depletion, where environmental impacts are about 28 times higher due to the high use of metals for wind electricity. However, it should be noted that the construction of electrolyzers, which is not considered in this analysis, would further increase mineral and metal depletion compared to fossil production. The high use of wind electricity and the higher demand for process steam increase acidification, eutrophication, and respiratory effects by between 60 and 250%. Acidification, freshwater eutrophication, and terrestrial eutrophication mainly increase due to copper production for wind turbines, while marine eutrophication and respiratory effects increase due to the high demand for copper and reinforcing steel. Increases in ionizing radiation, however, mainly result from higher use of grid electricity and could be avoided by using renewable electricity instead.
The best-case bio-based production increases land use by a factor of about 37 due to the land requirements for miscanthus cultivation. Furthermore, both the cultivation and gasification of miscanthus increase eutrophication by 70 to 160% due to the application of fertilizer and nitrate emissions from gasification. The increase in ionizing radiation results from the high demand for oxygen for gasification. Since the environmental impacts of oxygen result mainly from electricity consumption for cryogenic air separation, the increased environmental impacts could also be avoided by using renewable electricity. However, oxygen supply is part of the background system and therefore not modeled in this study. In addition, acidification and respiratory effects increase due to the higher use of grid electricity. However, both bio- and CCU-based production reduce ozone layer depletion and fossil depletion due to the reduced demand for natural gas, fossil-based ethylene, and propylene.
Combined utilization always lowers environmental impacts compared to either biomass or CCU. In seven out of eleven categories, combined use leads to the lowest impacts, reducing impacts by 10 to 46% compared to the best utilization of either biomass or CO2. These savings result from reduced demand for process steam, grid electricity, and biomass. However, the environmental impacts of combined production are still higher than those of fossil-based production in nine out of eleven categories. These impacts could potentially be reduced by already taking the other environmental impacts into account during optimization. The analysis shows that the optimization of the PUR supply chain leads to environmental trade-offs.
Conclusion
The global warming impact of PUR can be reduced by the utilization of both bio- and CCU-based technologies. CCU technologies can reduce the GWI by up to 45%. Biomass utilization, on the other hand, can reduce the GWI of PUR by up to 46%. However, large amounts of biomass and renewable electricity with a low carbon footprint are necessary to achieve GHG reductions. Therefore, the availability of limited renewable resources determines the GHG reductions.We identified synergies from the combined utilization of bio- and CCU-based technologies that reduce GHG emissions by an additional 13%. At the same time, we found that combined utilization reduces the demand for limited renewable resources compared to the utilization of either biomass or CO2: demand decreases by about 25% for biomass and renewable electricity. Synergies result from the more efficient use of bio-based carbon. Bio-based carbon is usually partially converted into CO2 during gasification and fermentation and released into the atmosphere. In the combined utilization, the CO2 is captured and reused in production, thus saving GHG emissions, raw materials, and process steam. Still, even the combined production of PUR remains carbon-positive with a carbon footprint of 3.1 kgCO2-eq/kgPUR. Further GHG reductions in energy and feedstock supply are necessary to achieve carbon-neutral PUR.
Our results show that by using renewable resources, burdens are shifted from climate impact to other environmental impact categories: nine out of eleven environmental impact categories increase compared to fossil production. In particular, land use and metal depletion increase significantly. Although the uncertainties are particularly high in these categories, the trend towards higher environmental impacts should not be ignored. Combined utilization of renewable resources can again reduce environmental impacts. In seven of the eleven categories, lower consumption of process steam, grid electricity, and biomass reduces environmental impacts by at least 10 to 46% compared to the individual utilization of biomass and CO2. However, most impacts remain higher compared to the fossil benchmark. It is therefore important to note that focusing only on GHG emissions when assessing mitigation strategies can lead to increases in other environmental impacts. Thus, the assessment of renewable resources requires a comprehensive, multi-criteria analysis of all environmental impact categories.
The PUR supply chain uses high-volume chemicals such as ethylene, propylene, and toluene. These chemicals are also used to produce other large-volume polymers. Due to the similar resource basis, the results of this study can therefore inform other polymer and chemical production systems. In particular, combined utilization of renewable resources is promising for a methanol-based industry since both bio-based synthesis gas production and CCU-based methanol production are already at high TRL.56 Combined utilization would increase resource flexibility and may help in adapting to local resource availability in different regions. Consequently, this study shows that synergies in production reduce the effort required to achieve high GHG reduction in the polymer industry.
Author contributions
M. B. worked on conceptualization, methodology, and data curation, and wrote the original draft and the manuscript. A. K. assisted in developing the methodology and in writing the manuscript. B. W. and R. M. worked on data curation and reviewed the manuscript. L. M. worked on conceptualization and methodology, and reviewed the manuscript, and A. B. supervised the project, worked on conceptualization and methodology, and assisted in writing the manuscript. All authors contributed to discussions and to finalizing the manuscript.Abbreviations
| CCU | Carbon capture and utilization |
| CO2 | Carbon dioxide |
| EO | Ethylene oxide |
| EoL | End-of-life |
| GHG | Greenhouse gas |
| GWI | Global warming impact |
| LCA | Life cycle assessment |
| LUC | Land-use change |
| OCT | Olefins Conversion Technology |
| PO | Propylene oxide |
| PUR | Polyurethane |
| TCM | Technology Choice Model |
| TDI | Toluene diisocyanate |
| TRL | Technology-readiness level |
| WGS | Water-gas shift |
Conflicts of interest
There are no conflicts to declare.Acknowledgements
We gratefully acknowledge funding from the German Federal Ministry of Education and Research (BMBF project ID: 033R199B). Furthermore, we thank Matthias Hermesmann, Johan Ahlström, Stavros Papadokonstantakis and Harvey Simon from Chalmers University of Technology for their support on the gasification technologies and Kai Laemmerhold for his valuable comments on the manuscript.References
- J. Zheng and S. Suh, Nat. Clim. Change, 2019, 9, 374–378 Search PubMed.
- A. Olhoff and J. M. Christensen, Emissions Gap Report 2018, UNEP, 2019 Search PubMed.
- International Energy Agency, Tracking Clean Energy Progress: 2017, International Energy Agency Paris, France, 2017 Search PubMed.
- M. Carus, L. Dammer, A. Raschka and P. Skoczinski, Greenhouse Gases: Sci. Technol., 2020, 10, 488–505 Search PubMed.
- J. Artz, T. E. Müller, K. Thenert, J. Kleinekorte, R. Meys, A. Sternberg, A. Bardow and W. Leitner, Chem. Rev., 2018, 118, 434–504 Search PubMed.
- (a) A. Tremel, P. Wasserscheid, M. Baldauf and T. Hammer, Int. J. Hydrogen Energy, 2015, 40, 11457–11464 Search PubMed; (b) H. Ostovari, A. Sternberg and A. Bardow, Sustainable Energy Fuels, 2020, 4, 4482–4496 Search PubMed.
- Carbon Recycling International (CRI), George Olah Renewable Methanol Plant. First Production of Fuel From CO2 at Industrial Scale, available at: https://www.carbonrecycling.is/projects#project-goplant, accessed 01/2021 Search PubMed.
- Asahi Kasei, CHIMEI CORPORATION’s Polycarbonate WONDERLITE, available at: https://www.asahi-kasei.co.jp/advance/en/business/plastics/plastics_polycarbo.html, accessed 01/2021 Search PubMed.
- Aramco, Converge, available at: https://www.aramco.com/en/creating-value/products/chemicals/converge, accessed 01/2021 Search PubMed.
- B. Grignard, S. Gennen, C. Jérôme, A. W. Kleij and C. Detrembleur, Chem. Soc. Rev., 2019, 48, 4466–4514 Search PubMed.
- S. Deutz, D. Bongartz, B. Heuser, A. Kätelhön, L. Schulze Langenhorst, A. Omari, M. Walters, J. Klankermayer, W. Leitner, A. Mitsos, S. Pischinger and A. Bardow, Energy Environ. Sci., 2018, 11, 331–343 Search PubMed.
- N. Thonemann, Appl. Energy, 2020, 263, 114599 Search PubMed.
- R. Meys, A. Kätelhön and A. Bardow, Green Chem., 2019, 21, 3334–3342 Search PubMed.
- E. Cetinkaya, I. Dincer and G. F. Naterer, Int. J. Hydrogen Energy, 2012, 37, 2071–2080 Search PubMed.
- A. Sternberg and A. Bardow, Energy Environ. Sci., 2015, 8, 389–400 Search PubMed.
- (a) S. J. Gerssen-Gondelach, D. Saygin, B. Wicke, M. K. Patel and A. P. C. Faaij, Renewable Sustainable Energy Rev., 2014, 40, 964–998 Search PubMed; (b) S. Zinoviev, F. Müller-Langer, P. Das, N. Bertero, P. Fornasiero, M. Kaltschmitt, G. Centi and S. Miertus, ChemSusChem, 2010, 3, 1106–1133 Search PubMed; (c) E. M. W. Smeets, A. P. C. Faaij, I. M. Lewandowski and W. C. Turkenburg, Prog. Energy Combust. Sci., 2007, 33, 56–106 Search PubMed.
- Croda, First Major Milestone in Renewable Manufacturing, available at: https://www.crodacoatingsandpolymers.com/en-gb/news/2016/06/first-major-milestone-achieved-in-crodas-170m-investment-in-renewable-manufacturing?pageEvent=db1bc698-5c30-4be7-b130-0e2b5fb5b7d7, accessed 01/2021 Search PubMed.
- Braskem, I’m green Polyethylene, available at: http://plasticoverde.braskem.com.br/site.aspx/Im-greenTM-Polyethylene, accessed 01/2021 Search PubMed.
- (a) The Coca Cola Company, Coca-Cola Produces World’s First PET Bottle Made Entirely From Plants, available at: https://www.coca-colacompany.com/press-releases/coca-cola-produces-first-pet-bottle-made-from-plants, accessed 01/2021 Search PubMed; (b) H. Ren, F. Qiao, Y. Shi, M. W. Knutzen, Z. Wang, H. Du and H. Zhang, J. Renewable Sustainable Energy, 2015, 7, 41510 Search PubMed; (c) The Coca Cola Company, Coca-Cola, Ford Motor Company, H.J. Heinz Company, NIKE, Inc. and Procter & Gamble today announced the formation of the Plant PET Technology Collaborative (PTC), available at: https://www.coca-colacompany.com/press-releases/coca-cola-ford-heinz-nike-and-procter-gamble-announced-plant-pet-technology Search PubMed.
- Cargill, About BiOH® products, available at: https://www.cargill.com/bioindustrial/about-bioh-products, accessed 01/2021 Search PubMed.
- P. Furtwengler and L. Avérous, Polym. Chem., 2018, 9, 4258–4287 Search PubMed.
- S. RameshKumar, P. Shaiju, K. E. O’Connor and R. Babu, Curr. Opin. Green Sustain. Chem., 2020, 21, 75–81 Search PubMed , http://www.sciencedirect.com/science/article/pii/S2452223619300665.
- M. Weiss, J. Haufe, M. Carus, M. Brandão, S. Bringezu, B. Hermann and M. K. Patel, J. Ind. Ecol., 2012, 16, S169–S181 Search PubMed.
- F. Cherubini and A. H. Strømman, Bioresour. Technol., 2011, 102, 437–451 Search PubMed.
- T. Searchinger, R. Heimlich, R. A. Houghton, F. Dong, A. Elobeid, J. Fabiosa, S. Tokgoz, D. Hayes and T.-H. Yu, Science, 2008, 319, 1238–1240 Search PubMed.
- S. Searle and C. Malins, GCB Bioenergy, 2015, 7, 328–336 Search PubMed.
- EU Commission and others, EU Commission, Brussels, Belgium, 2017 Search PubMed.
- (a) C. B. Field, J. E. Campbell and D. B. Lobell, Trends Ecol. Evol., 2008, 23, 65–72 Search PubMed; (b) M. G. R. Cannell, Biomass Bioenergy, 2003, 24, 97–116 Search PubMed; (c) T. I. M. Beringer, W. Lucht and S. Schaphoff, GCB Bioenergy, 2011, 3, 299–312 Search PubMed.
- (a) A. D. La Rosa, in Biopolymers and Biotech Admixtures for Eco-Efficient Construction Materials, Elsevier, 2016, pp. 57–78 Search PubMed; (b) N. von der Assen and A. Bardow, Green Chem., 2014, 16, 3272–3280 Search PubMed; (c) N. von der Assen, A. Sternberg, A. Kätelhön and A. Bardow, Faraday Discuss., 2015, 183, 291–307 Search PubMed.
- A. Kätelhön, R. Meys, S. Deutz, S. Suh and A. Bardow, Proc. Natl. Acad. Sci. U. S. A., 2019, 116, 11187–11194 Search PubMed.
- (a) M. Gassner and F. Maréchal, Energy, 2008, 33, 189–198 Search PubMed; (b) R. Agrawal, N. R. Singh, F. H. Ribeiro, W. N. Delgass, D. F. Perkis and W. E. Tyner, Comput. Chem. Eng., 2009, 33, 2012–2017 Search PubMed; (c) L. R. Clausen, N. Houbak and B. Elmegaard, Energy, 2010, 35, 2338–2347 Search PubMed; (d) L. R. Clausen, Energy, 2015, 85, 94–104 Search PubMed; (e) I. Hannula, Biomass Bioenergy, 2015, 74, 26–46 Search PubMed; (f) P. Collet, E. Flottes, A. Favre, L. Raynal, H. Pierre, S. Capela and C. Peregrina, Appl. Energy, 2017, 192, 282–295 Search PubMed; (g) M. Hillestad, M. Ostadi, G. d. Alamo Serrano, E. Rytter, B. Austbø, J. G. Pharoah and O. S. Burheim, Fuel, 2018, 234, 1431–1451 Search PubMed; (h) A. König, K. Ulonska, A. Mitsos and J. Viell, Energy Fuels, 2019, 33, 1659–1672 Search PubMed.
- B. Eling, Ž. Tomović and V. Schädler, Macromol. Chem. Phys., 2020, 221, 2000114 Search PubMed.
- A. Kätelhön, A. Bardow and S. Suh, Environ. Sci. Technol., 2016, 50, 12575–12583 Search PubMed.
- J. Jung, N. von der Assen and A. Bardow, Int. J. Life Cycle Assess., 2013, 18, 828–839 Search PubMed.
- R. Frischknecht, H.-J. Althaus, C. Bauer, G. Doka, T. Heck, N. Jungbluth, D. Kellenberger and T. Nemecek, Int. J. Life Cycle Assess., 2007 DOI:10.1065/lca2007.02.308.
- Ecoinvent Association, Ecoinvent, Version 3.5 (Ecoinvent, Zürich), available at: www.ecoinvent.org/, accessed 10/2020 Search PubMed.
- (a) M. Ionescu, Chemistry and technology of polyols for polyurethanes, Smithers Rapra, 2nd edn, 2016 Search PubMed; (b) Covestro Deutschland AG, Cardyon – brighter use of CO2, fact sheet, available at: https://solutions.covestro.com/de/marken/cardyon, accessed 06/2020 Search PubMed.
- G. Belussi, et al., Ullmann’s Encyclopedia of Industrial Chemistry, Wiley-VCH, Weinheim, 7th edn, 2011, vol. 40 Search PubMed.
- N. von der Assen, L. J. Müller, A. Steingrube, P. Voll and A. Bardow, Environ. Sci. Technol., 2016, 50, 1093–1101 Search PubMed.
- (a) L. J. Müller, A. Kätelhön, S. Bringezu, S. McCoy, S. Suh, R. Edwards, V. Sick, S. Kaiser, R. Cuéllar-Franca, A. El Khamlichi, J. H. Lee, N. von der Assen and A. Bardow, Energy Environ. Sci., 2020, 13(9), 2979–2992 Search PubMed; (b) L. J. Müller, A. Kätelhön, M. Bachmann, A. Zimmermann, A. Sternberg and A. Bardow, Front. Energy Res., 2020, 8, 15 Search PubMed.
- L. J. Müller, A. Kätelhön, M. Bachmann, A. Zimmermann, A. Sternberg and A. Bardow, Front. Energy Res., 2020, 8, 15 Search PubMed.
- S. Cadoux, A. B. Riche, N. E. Yates and J.-M. Machet, Biomass Bioenergy, 2012, 38, 14–22 Search PubMed.
- Y. Iqbal, M. Gauder, W. Claupein, S. Graeff-Hönninger and I. Lewandowski, Energy, 2015, 89, 268–276 Search PubMed.
- J. B. Dunn, S. Mueller, H.-Y. Kwon and M. Q. Wang, Biotechnol. Biofuels, 2013, 6, 51 Search PubMed.
- R. Parajuli, K. Sperling and T. Dalgaard, Biomass Bioenergy, 2015, 72, 104–116 Search PubMed.
- ECN, ECN Phyllis classification, miscanthus, available at: https://phyllis.nl/Biomass/View/568, accessed 07/2020 Search PubMed.
- D. Styles and M. B. Jones, Energy Policy, 2008, 36, 97–107 Search PubMed.
- A. A. Rentizelas, A. J. Tolis and I. P. Tatsiopoulos, Renewable Sustainable Energy Rev., 2009, 13, 887–894 Search PubMed.
- (a) I. Hannula and E. Kurkela, Bioresour. Technol., 2010, 101, 4608–4615 Search PubMed; (b) I. Hannula and E. Kurkela, Biomass Bioenergy, 2012, 38, 58–67 Search PubMed; (c) J. Isaksson, K. Pettersson, M. Mahmoudkhani, A. Åsblad and T. Berntsson, Energy, 2012, 44, 420–428 Search PubMed; (d) M. Arvidsson, S. Heyne, M. Morandin and S. Harvey, Chem. Eng., 2012, 29, 331–336 Search PubMed; (e) M. Arvidsson, M. Morandin and S. Harvey, Energy Fuels, 2014, 28, 4075–4087 Search PubMed; (f) P. Spath, A. Aden, T. Eggeman, M. Ringer, B. Wallace and J. Jechura, Biomass to Hydrogen Production Detailed Design and Economics Utilizing the Battelle Columbus Laboratory Indirectly-Heated Gasifier, Technical Report, 2005 Search PubMed.
- (a) R. Davis, L. Tao, C. Scarlata, E. C. D. Tan, J. Ross, J. Lukas and D. Sexton, Process Design and Economics for the Conversion of Lignocellulosic Biomass to Hydrocarbons. Dilute-Acid and Enzymatic Deconstruction of Biomass to Sugars and Catalytic Conversion of Sugars to Hydrocarbons, National Renewable Energy Laboratory, 2015 Search PubMed; (b) National Renewable Energy Laboratory, NREL 2017 Biochemical Sugar Model, available at: https://www.nrel.gov/extranet/biorefinery/aspen-models/, accessed 08/2019 Search PubMed; (c) B. C. Saha, N. N. Nichols, N. Qureshi, G. J. Kennedy, L. B. Iten and M. A. Cotta, Bioresour. Technol., 2015, 175, 17–22 Search PubMed; (d) Y. Zhang, A. Bhatt, G. Heath, M. Thomas and J. Renzaglia, Federal Air Pollutant Emission Regulations and Preliminary Estimates of Potential-to-Emit from Biorefineries. Pathway #1: Dilute-Acid and Enzymatic Deconstruction of Biomass-to-Sugars and Biological Conversion of Sugars-to-Hydrocarbons, National Renewable Energy Laboratory, 2016 Search PubMed.
- V. Castellani, E. Diaconu, S. Fazio, S. Sala, E. M. Schau, M. Secchi and L. Zampori, Supporting information to the characterisation factors of recommended EF Life Cycle Impact Assessment methods. New methods and differences with ILCD, Publications Office of the European Union, Luxembourg, 2018, vol. 28888 Search PubMed.
- InternationalOrganization for Standardization, ISO 14040:2006 Environmental management: Life cycle assessment; principles and framework.
- International Organization for Standardization, ISO 14044:2006 Environmental management: Life cycle assessment; requirements and guidelines.
- R. Heijungs and S. Suh, The Computational Structure of Life Cycle Assessment, Springer, Dordrecht, 2002, vol. 11 Search PubMed.
- A. Sánchez and M. Martín, J. Cleaner Prod., 2018, 178, 325–342 Search PubMed.
- G. A. Olah, Angew. Chem., Int. Ed., 2005, 44, 2636–2639 Search PubMed.
Footnote |
| † Electronic supplementary information (ESI) available. See DOI: 10.1039/d0fd00134a |
| This journal is © The Royal Society of Chemistry 2021 |