
 Open Access Article
 This Open Access Article is licensed under a Creative Commons Attribution-Non Commercial 3.0 Unported Licence
Improved biocatalytic cascade conversion of CO2 to methanol by enzymes Co-immobilized in tailored siliceous mesostructured cellular foams†
Milene
Zezzi do Valle Gomes‡
 *a,
Gerard
Masdeu‡
b,
Patrick
Eiring
c,
Alexander
Kuhlemann
c,
Markus
Sauer
c,
Björn
Åkerman
b and
Anders E. C.
Palmqvist
a
*a,
Gerard
Masdeu‡
b,
Patrick
Eiring
c,
Alexander
Kuhlemann
c,
Markus
Sauer
c,
Björn
Åkerman
b and
Anders E. C.
Palmqvist
a
aChalmers University of Technology, Department of Chemistry and Chemical Engineering, Applied Chemistry, SE-41296 Gothenburg, Sweden. E-mail: Milene.zezzi@gmail.com; Tel: +46 31 772 2983
bChalmers University of Technology, Department of Chemistry and Chemical Engineering, Physical Chemistry, SE-41296 Gothenburg, Sweden
cDepartment of Biotechnology and Biophysics, Biocenter, University of Würzburg, Am Hubland, D-97074 Würzburg, Germany
First published on 13th October 2021
Abstract
CO2 can be enzymatically reduced to methanol in a cascade reaction involving three enzymes: formate-, formaldehyde- and alcohol dehydrogenase (FateDH, FaldDH, ADH). We report an improvement in the yield of this reaction by co-immobilizing the three dehydrogenases in siliceous mesostructured cellular foams (MCF). This material consists of large mesopores suitable for the co-immobilization of these comparatively large enzymes. To improve the interaction between the enzymes and support, the host silica material was functionalized with mercaptopropyl groups (MCF-MP). The enzymes were fluorescently labelled to independently monitor their uptake and spatial distribution into the particle. The three dehydrogenases were co-immobilized using two sequential methods. In the first one, the enzymes were immobilized according to the reaction order (FateDH → FaldDH → ADH) and secondly in order of increasing enzyme size (FateDH → ADH → FaldDH). Two protein loadings were also tested: 50 and 150 mgenzymes gsupport−1. We could observe a 4.5-fold higher methanol yield in comparison to enzymes free in solution when the enzymes were immobilized in order of size and with a loading of 50 mgenzymes gsupport−1. The results of this work show that by using MCF-MP, a simple method of immobilization can be applied to significantly increase the activity of the enzymes for the cascade reaction.
1. Introduction
The high emission of CO2 from fossil combustion is a global concern since it is considered the main cause of climate change and global warming.1–3 Decreasing the emissions of this greenhouse gas represents a huge challenge considering that the daily energy consumption keeps increasing worldwide.1,4 Many technologies have been developed to produce renewable and clean energy sources, however, the demand and use of fossil fuel remain higher than desirable.1–3 Therefore, to mitigate the climate impact caused by the high emissions of CO2, one alternative is to convert the greenhouse gas to fuels and chemicals.3,5,6The conversion of CO2 to methanol is a very interesting option considering the vast application of methanol.7–10 However, CO2 is a very stable molecule ( = −396 kJ mol−1) and its conversion to methanol requires a high input of energy.11,12 This reaction has been shown feasible with photocatalysis, electrocatalysis and enzymatic methods.6,13–17 Among them, enzymes have the advantage of catalyzing the reaction with high selectivity, which is hard to achieve with other catalysts.5,18–20
The enzymatic conversion of CO2 to methanol is catalyzed by 3 enzymes: formate dehydrogenase (FateDH) that converts CO2 to formate; formaldehyde dehydrogenase (FaldDH) for the conversion of formate to formaldehyde; and alcohol dehydrogenase (ADH) that converts formaldehyde to methanol (Fig. 1).5,18–20 The three enzymes require the cofactor NADH as the electron donor, which can be considered a drawback for the reactions, due to the high cost of NADH. However, this problem can be overcome using a NADH regenerating system.21,22
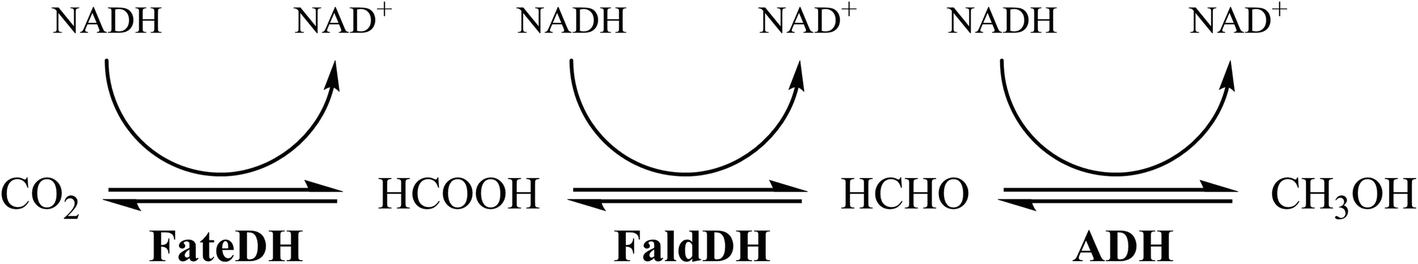 | ||
| Fig. 1 The enzymatic conversion of CO2 to methanol catalyzed by FateDH, FaldDH and ADH. | ||
This cascade enzymatic reaction, even though very appealing, requires some improvements in order to increase the methanol yields.5,18–20 One approach to reach this goal is the immobilization of the enzymes in an inert support material. A type of mesoporous silica, called siliceous mesostructured cellular foams (MCF), is an interesting material for the co-immobilization of the three dehydrogenases. The enzymes can be easily immobilized inside the pores of the material through physical adsorption, which is a simple and robust method of immobilization.23 The MCFs consist of large mesopores (can vary from 20 to 40 nm) connected by smaller windows (10–20 nm). Due to this morphology and the high porosity of MCF, the enzymes can easily diffuse into the material resulting in large concentrations of immobilized enzymes.24 These physical properties of MCF are essential considering that the three dehydrogenases are all relatively large enzymes (FateDH: 84 kDa;25 FaldDH: 170 kDa;26 ADH: 141kDa (ref. 27)). The chemical properties of the MCF can also be easily modified by the attachment of functional groups to improve the attraction between the enzyme and the support and thus improve the immobilization.28
In our previous study,29 the two first enzymes of the cascade reaction, FateDH and FaldDH, were co-immobilized in MCF functionalized with mercaptopropyl groups (MCF-MP). We could observe an improvement of the cascade reaction yields of about 4 times comparing with the enzymes free in solution.29 Fluorescent labeling and Förster resonance energy transfer (FRET) analysis of the system suggested that the co-immobilized enzymes were in close proximity inside the pores of this material, which can potentially lead to substrate channeling and result in increased enzyme activity.30–32
Due to this improvement observed in the previous work, we now use a similar MCF-MP to co-immobilize all three enzymes, FateDH, FaldDH and ADH. We investigate how the immobilization process and the total protein loading in the material influence the enzyme activity. More interestingly, here we demonstrate that in MCF-MP the yield of the whole cascade reaction increases considerably, which makes this a promising material to be used in the bioconversion of CO2 to methanol.
2. Experimental section
2.1. Materials
Pluronic™ P123 (EO20PO70EO20, MW = 5800), 1,3,5 trimethylbenzene (TMB, 98%), tetraethylorthosilicate (TEOS, ≥98%), hydrochloric acid (HCl, 37 wt%), ammonium fluoride (NH4F, ≥99.9%), 3-mercaptopropyltrimethoxysilane (MPTS, 95%), toluene anhydrous (99.8%), potassium phosphate monobasic (KH2PO4, ≥98%), potassium phosphate dibasic (K2HPO4, ≥98%), β-nicotinamide adenine dinucleotide reduced disodium salt hydrate (NADH, 98%), potassium bicarbonate (KHCO3, ≥99.5%), methanol (≥99.9%), acetonitrile (99.5%), formate dehydrogenase from Candida boidinii (5.0–15.0 units per mg protein; lyophilized powder), formaldehyde dehydrogenase from Pseudomonas sp. (1.0–6.0 units per mg solid; lyophilized powder), alcohol dehydrogenase from Saccharomyces cerevisiae (≥300 units per mg protein; lyophilized powder), bovine serum albumin (BSA), and poly-D-lysine (#P6407) were purchased from Sigma-Aldrich. Sulfo-cyanine3 NHS ester (Cy3, MW = 751.91), sulfo-cyanine5 NHS ester (Cy5, MW = 777.95), sulfo-cyanine7 NHS ester (Cy7, MW = 844.05) were obtained from Lumiprobe. Alexa Fluor 488 NHS ester (AF488, MW = 643.4) and 4-well chambered Lab-Tek II cover slides (#155409) were from Thermo Fisher Scientific. GE Healthcare illustra™ NAP™ Columns (NAP-10) were purchased from Fisher Scientific.2.2. Synthesis and characterization of siliceous mesostructured cellular foams
MCF was synthesized according to the method developed by Schmidt-Winkel et al.33 Following this method, first Pluronic™ P123 was dissolved at room temperature in 100 ml of 1.6 M HCl. Then, the temperature was raised to 38 °C and 6.3 ml of TMB was added under vigorous stirring. After 1 h, 6.4 ml of TEOS was added and the sample was kept under continuous stirring for 20 h at 38 °C. After that, 0.031 g of NH4F was added and the suspension transferred to a Teflon-lined stainless-steel autoclave and aged at 100 °C for 24 h. The sample was then filtered and washed with distilled water. To remove the template the as-prepared sample was calcined in air at 550 °C for 8 h (heating rate of 1 °C min−1).The surface of the MCF was functionalized using MPTS according to the method described by Russo et al.28 Briefly, 0.5 g of MCF was dried in a vacuum oven at 120 °C for 4 h, and then mixed with 10 ml of toluene and 0.3 ml of MPTS under vigorous stirring. After 10 min the sample was transferred to a Teflon-lined stainless-steel autoclave and heated at 100 °C for 24 h. The sample was filtered, washed with toluene and dried overnight at 120 °C. The functionalized material was called MCF-MP.
2.3. Characterization of the materials
Nitrogen sorption analysis was used to determine the pore/window size distribution, specific surface area and pore volume of MCF and MCF-MP. Before the measurements, MCF was outgassed for at least 8 h at 180 °C and MCF-MP was outgassed at 120 °C overnight. The simplified BdB (Broekhoff–deBoer) – FHH (Frenkel–Halsey–Hill) method34 was used to calculate the pore size distribution, and the BET (Brunauer–Emmett–Teller) method35 to determine the specific surface area. The pore volume was calculated using a single point adsorption value at the relative pressure of 0.990.The functionalization of MCF-MP was confirmed and quantified by thermogravimetric analysis (TGA) carried out on a TGA/DSC 3+ instrument from Mettler Toledo, with a heating rate of 10 °C min−1 under a N2 flow of 50 ml min−1. The surface loading (Ns)36 and surface density (D)37 were estimated using eqn (1) and (2), respectively, where Wloss is the weight loss, Na is Avogadro's number and MW is the molecular weight of the ligand.
| Ns = Wloss/(100 g MCF·MW ligand) | (1) |
| D = Na·Ns/Surface area | (2) |
2.4. Labeling of the enzymes
FateDH, FaldDH and ADH were fluorescently labeled with Cy3, Cy5 and Cy7 respectively, following an adapted protocol of NHS ester labeling of amino biomolecules, provided by Lumiprobe; for microscopy purposes, ADH-AF488 was likewise prepared. In each case, the enzyme solution (1 mg ml−1) was prepared in 1 ml of 100 mM phosphate buffer (pH 8) using centrifugation to remove non-soluble impurities. Concentration was determined based on molar absorption coefficients (extinction coefficient of FateDH: E1% = 15.9, FaldDH: E1% = 10.0 and ADH: E1% = 14.6, as provided by the supplier). To achieve a degree of labeling (DOL) of 1.0 molecule of dye per molecule of enzyme, FateDH was mixed with 10.5 molar excess of Cy3; FaldDH with 6.4 molar excess of Cy5; ADH with 1.5 molar excess of Cy7. Mixtures were kept on ice overnight. Purification to remove the non-bound dye was performed on a size-exclusion column (NAP-10) with 100 mM phosphate buffer (pH 8).DOL-values were calculated using the absorption coefficients for the enzymes at 280 nm, and for the dyes at 550 nm (εCy3 = 162![[thin space (1/6-em)]](https://www.rsc.org/images/entities/char_2009.gif) 000 M−1 cm−1), 650 nm (εCy5 = 271000 M−1 cm−1) and 750 nm (εCy7 = 240600 M−1 cm−1). AF488 was quantified at 488 nm (εAF488 = 73000 M−1 cm−1). All molar absorption coefficients were provided by the supplier.
000 M−1 cm−1), 650 nm (εCy5 = 271000 M−1 cm−1) and 750 nm (εCy7 = 240600 M−1 cm−1). AF488 was quantified at 488 nm (εAF488 = 73000 M−1 cm−1). All molar absorption coefficients were provided by the supplier.
2.5. Co-immobilization of enzymes
The three enzymes, FateDH, FaldDH and ADH, were co-immobilized in MCF-MP following a sequential addition: (a) 2 hour incubation of the first enzyme together with MCF-MP, (b) addition of the second enzyme to the mixture and incubation for 2 h, and (c) final addition of the third enzyme for 2 extra hours. The immobilizations were performed in a thermomixer at 37 °C and 900 rpm.The enzymes were co-immobilized in two different orders: first according to the reaction order, FateDH → FaldDH → ADH, and secondly, according to their size, from the smallest to the largest, FateDH → ADH → FaldDH.
The enzyme mass ratio used for the immobilizations was 1:15:75 (FateDH:FaldDH:ADH), since it has been reported previously as the optimum mass ratio for the cascade reaction.19 In both immobilization sequences, FateDH (0.05 mg ml−1), FaldDH (0.75 mg ml−1), ADH (3.75 mg ml−1) were used. MCF-MP stock solution (0.05 g ml−1) was added aiming for protein loadings of 50 or 150 mgenzymes gsupport−1. Enzymes and MCF-MP solutions were prepared using 100 mM phosphate buffer pH 5.6, which is close to the pI of the enzymes (FateDH, pI = 5.4 (ref. 38); FaldDH, pI = 5.25 (ref. 39); ADH, pI = 5.4–5.8, provided by the supplier) to reduce repulsive enzyme–enzyme interactions. After the immobilization, the samples were centrifuged and washed two times with 100 mM phosphate buffer at pH = 6.5 (activity buffer).
The concentrations of the enzyme solutions were determined by measuring absorbance at 280 nm (A280) on a Nanodrop One Instrument from Thermo Scientific (extinction coefficient of FateDH: E1% = 15.9; FaldDH: E1% = 10.0 and ADH: E1% = 14.6, as provided by the supplier).
The catalytic activity measurements (see below) were performed with non-labelled enzymes. The fluorescently labeled enzymes (FateDH-Cy3, FaldDH-Cy5, ADH-Cy7) were used to measure the degree of immobilization (DOI) when carried out under similar conditions, the main difference being that the concentration of enzymes and particles was decreased (the enzyme-particle ratio was the same) to 1:15:75 μgenzyme ml−1, and 0.61 or 1.82 mgMCF ml−1, due to high-sensitivity fluorescence detection. To avoid non-specific binding of the target proteins to the immobilization tube at these overall lower concentrations, a blocking of the tube surface was performed using BSA before the addition of MCF and/or enzymes:40 (a) 10 min incubation with 1 ml of BSA (2 mg ml−1), followed by washing to ensure non-bound BSA remained in the supernatant. With BSA-treatment, control experiments (free enzyme, no particles) showed negligible binding to the tube.
After each 2 hour incubation of enzymes and particles, Cy3, Cy5 and Cy7 fluorescence emission spectra (530–700, 630–800 and 730–900 nm) of labelled enzymes remaining in the supernatant were analyzed. All fluorescence measurements were performed on a Cary Eclipse fluorometer (Varian). Emission spectra were recorded using excitation at 515, 615 and 715 nm for Cy3, Cy5 and Cy7, respectively, exploiting the well-separated absorption spectra of the three dyes. Excitation/emission slit width was set at 5 nm, with a 90° emission detection angle. The photomultiplier tube voltage was 1000, 800 and 700 V. DOI-Values were calculated as the ratio of the final measured emission intensity in the supernatant and the initial emission intensity.
2.6. Specific catalytic activity
The cascade reactions were performed by mixing FateDH (0.05 mg ml−1), FaldDH (0.75 mg ml−1), ADH (3.75 mg ml−1), NADH (100 mM), and KHCO3 (200 mM) in 100 mM phosphate buffer (pH 6.5), total reaction volume 200 μL. The reactions were carried out in a closed reactor under a CO2 atmosphere at 5 bar pressure for 1 h at 37 °C under stirring. The cascade reaction using co-immobilized enzymes instead of free in solution was performed at the same operating conditions and using the same concentrations of substrate and cofactor.100 μl of sample was mixed with 150 μl of acetonitrile to quench the reaction. The mixture was centrifuged to separate the enzymes (and particles, if applicable), and the methanol in the supernatant was quantified by gas chromatography.
2.7. Methanol quantification
The quantification of methanol was determined using a Thermo Scientific Trace 1300 gas chromatograph with a polar column (ZB-WAX column 30 × 0.25 × 0.25) and FID detector. The carrier gas was hydrogen with a flow rate of 1.2 ml min−1. The injector temperature was 220 °C with a column temperature of 55 °C for 3 min, followed by a heating ramp from 55 °C to 220 °C at 20 °C min−1.2.8. Fluorescence microscopy
To determine the (co-)localization of the enzymes inside the particles, FateDH-Cy3, FaldDH-Cy5 and ADH-AF488 were immobilized into MCF-MP as described for the immobilization characterization. MCF-MP were seeded on poly-D-lysine coated (0.1%) 4-well chambered Lab-Tek II cover slides. The enzymes were imaged at a commercial ELYRA S.1 microscope (Zeiss) equipped with a 63× oil immersion objective (1.4 NA). Two OPSL laser with the wavelengths 488 nm and 561 nm as well as a diode laser with a wavelength of 642 nm were used for excitation. The filter sets were adjusted for the respective fluorophores. Images were acquired with 150 ms exposure time and 5% transmission of the respective laser. Structured illumination applying five rotational and five phase variations was used for image recording and subsequent reconstruction in ZEN 2.3 (Zeiss).3. Results and discussion
3.1. Characterization of siliceous mesostructured cellular foams
The MCF and MCF-MP were characterized using nitrogen sorption analysis. Their physical properties are shown in Table 1.| Sample | Mean window size (nm) | Mean pore size (nm) | Specific surface area (m2 g−1) | Specific pore volume (cm3 g−1) |
|---|---|---|---|---|
| MCF | 10.9 | 33.0 | 678 | 2.7 |
| MCF-MP | 10.4 | 31.2 | 441 | 2.0 |
The pore and window sizes of the MCF are very similar to the material previously used to co-immobilize FateDH and FaldDH.29 These physical properties of the material were shown to be suitable for the immobilization of these enzymes.29 The functionalization with mercaptopropyl groups mainly reduced the surface area and pore volume of the material whereas the pore and window size were only slightly affected by the functionalization. Nevertheless, the MCF-MP has still a high surface area and pore volume which are desirable properties for the co-immobilization of the three enzymes. The MCF-MP was, in addition, characterized by TGA. According to the 4.4% weight loss, the estimated surface loading was 0.6 mmolMP g−1 and the surface density was 0.5 ligand per nm2 (see ESI† Fig. S2).
3.2. Individual enzyme distribution
In order to evaluate their distribution along the particle through fluorescence microscopy, the three enzymes were labeled with fluorescent dyes leading to the covalent protein–dye conjugates denoted FateDH-Cy3, FaldDH-Cy5 and ADH-AF488. Previous results24 suggest that the Cy3 and Cy5 probes do not alter the protein adsorption into the particles, which can be expected to be the case also for AF488 due to the small size and similar chemical structure of the three dyes. Besides, A280 values indicated a similar binding of labeled and non-labeled proteins to MCF.The three enzymes were individually immobilized into MCF (Fig. 2). In each case, the emission intensity of five particles was analyzed to elucidate the protein distribution. Fig. 2d shows the binding of FateDH, FaldDH and ADH along the whole particle, with an intensity value always higher than the base level (corresponding to the microscopy substrate, no particle). While the first two enzymes were predominantly bound to the surface of the particle, ADH was more evenly immobilized with the highest intensity at the middle position.
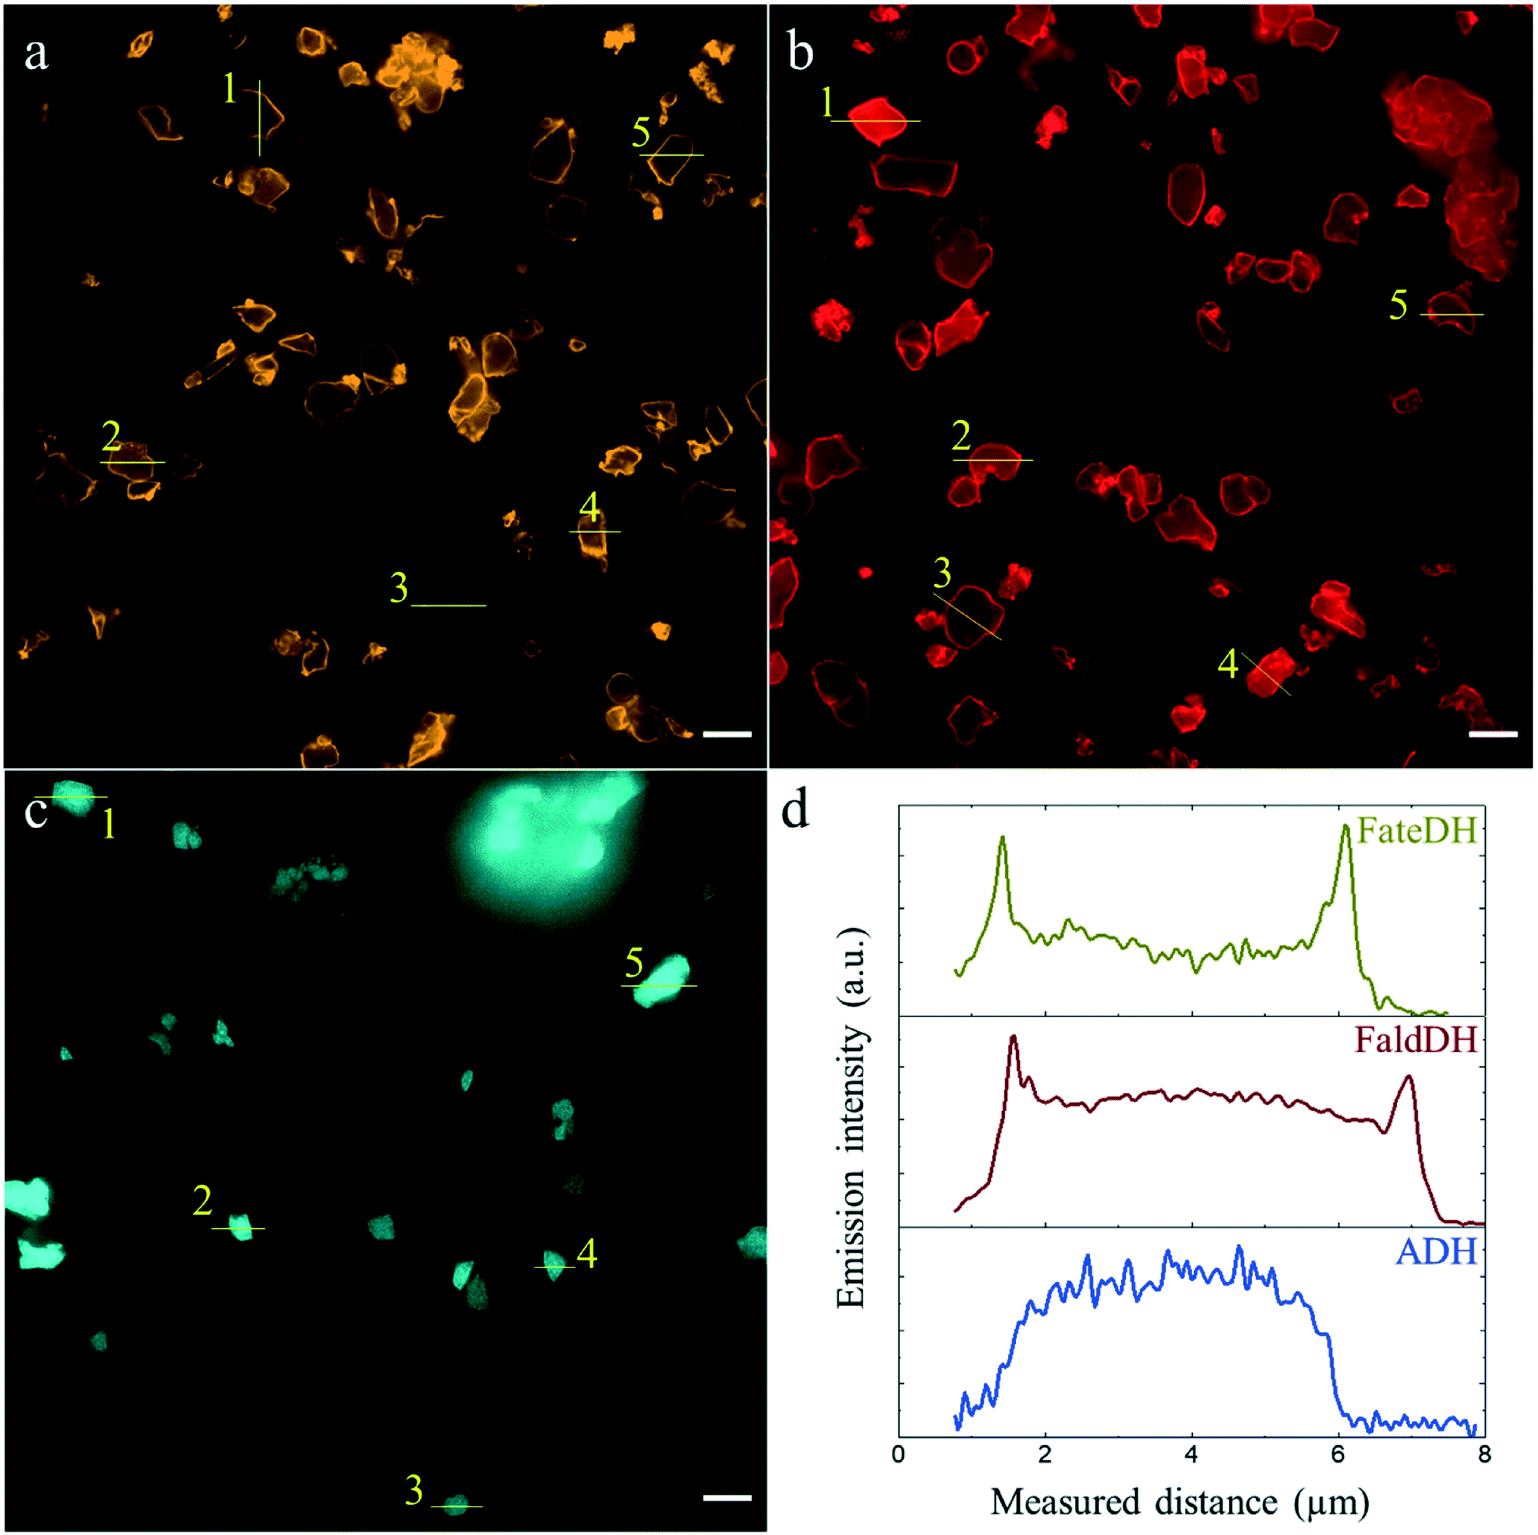 | ||
| Fig. 2 The individual enzyme distribution along the MCF particle in separate sets of individual enzyme immobilizations. The scale bar is 5 μm. (a) FateDH-Cy3, (b) FaldDH-Cy5, (c) ADH-AF488. (d) Emission intensity profiles of particles labelled #1 in a (yellow), b (red), c (blue). All the profiles are shown in Fig. S3.† | ||
3.3. Co-immobilization of FateDH, FaldDH and ADH
Initially, the enzymes were co-immobilized aiming at a protein loading of 150 mgenzymes gsupport−1 (PLD150) of total enzyme. This loading was chosen considering previous works involving the immobilization of the same enzyme separately in the MCFs.29,41,42 Fluorescent labeling was also applied here to quantify the degree of immobilization (DOI) of each enzyme, using Cy7 instead of AF488 due to a higher resemblance to Cy3 and Cy5.The three dyes have well-separated absorption spectra, so by adjusting the excitation and emission wavelengths the DOI of each enzyme could be measured independently. Table 2 shows the DOI of each enzyme in MCF-MP. It is seen that less than 90% of FateDH and only 70% of the FaldDH become immobilized using both immobilization strategies studied here; sequential enzyme addition in the order they appear in the cascade reaction, or in the order of increasing size. Considering the mass concentration of each enzyme during the immobilization, the final enzyme mass ratio in the host material became 1:12:80 (FateDH:FaldDH:ADH) under the PLD150 conditions.
| P LD (mg g−1) | Immobilization | DOI (%) | DOI (%) | DOI (%) | ||||||
|---|---|---|---|---|---|---|---|---|---|---|
| Sequence | 2 h | 4 h | 6 h | |||||||
| FateDH | FaldDH | ADH | FateDH | FaldDH | ADH | FateDH | FaldDH | ADH | ||
| 150 | Reaction order | 92 | — | — | 89 | 80 | — | 87 | 70 | 93 |
| Size order | 92 | — | — | 88 | — | 95 | 87 | 70 | 93 | |
| 50 | Reaction order | 96 | — | — | 93 | 90 | — | 91 | 79 | 99 |
| Size order | 96 | — | — | 92 | — | 99 | 90 | 82 | 99 | |
Samples with a targeted PLD-value of 50 mgenzymes gsupport−1 (PLD50) were also prepared to compare the catalytic activity of a less concentrated catalyst derivative. For PLD50, in both methods of immobilization the amount of FateDH that was immobilized increased to about 90% and the amount of FaldDH also increased to about 80%. Almost all (99%) of the ADH added became immobilized under these conditions. The enzyme mass ratio obtained under the PLD50-conditions was 1:13:82 (FateDH:FaldDH:ADH) for the enzymes immobilized following the reaction order, and 1:14:83 when immobilized according to their size order.
Interestingly, it was noticed that independently of the PLD-value aimed for or the immobilization sequence (reaction order or size order), the DOI for FateDH and FaldDH decreases during the subsequent immobilization steps. The immobilization of ADH, on the other hand, seems to be less affected by the total immobilization time or the presence of the other enzymes. Apparently, the inter-enzyme interaction caused the desorption of some FateDH and FaldDH that were previously adsorbed in the MCF-MP surface, whereas ADH adsorbs preferentially in this material.
3.4. Catalytic activity of the cascade reaction
The catalytic activity of the enzymes in the cascade reaction when free in solution (no MCF particles) was found to be 0.3 mmolMetOH genzyme−1 min−1. Upon immobilization in MCF-MP at PLD150, it was observed an increase in the catalytic activity of the enzymes immobilized in both sequence orders (Fig. 3). It should be noted that the catalytic activity of the cascade reaction was measured with non-labelled proteins. The highest yield of methanol was obtained when the enzymes were immobilized according to their size order.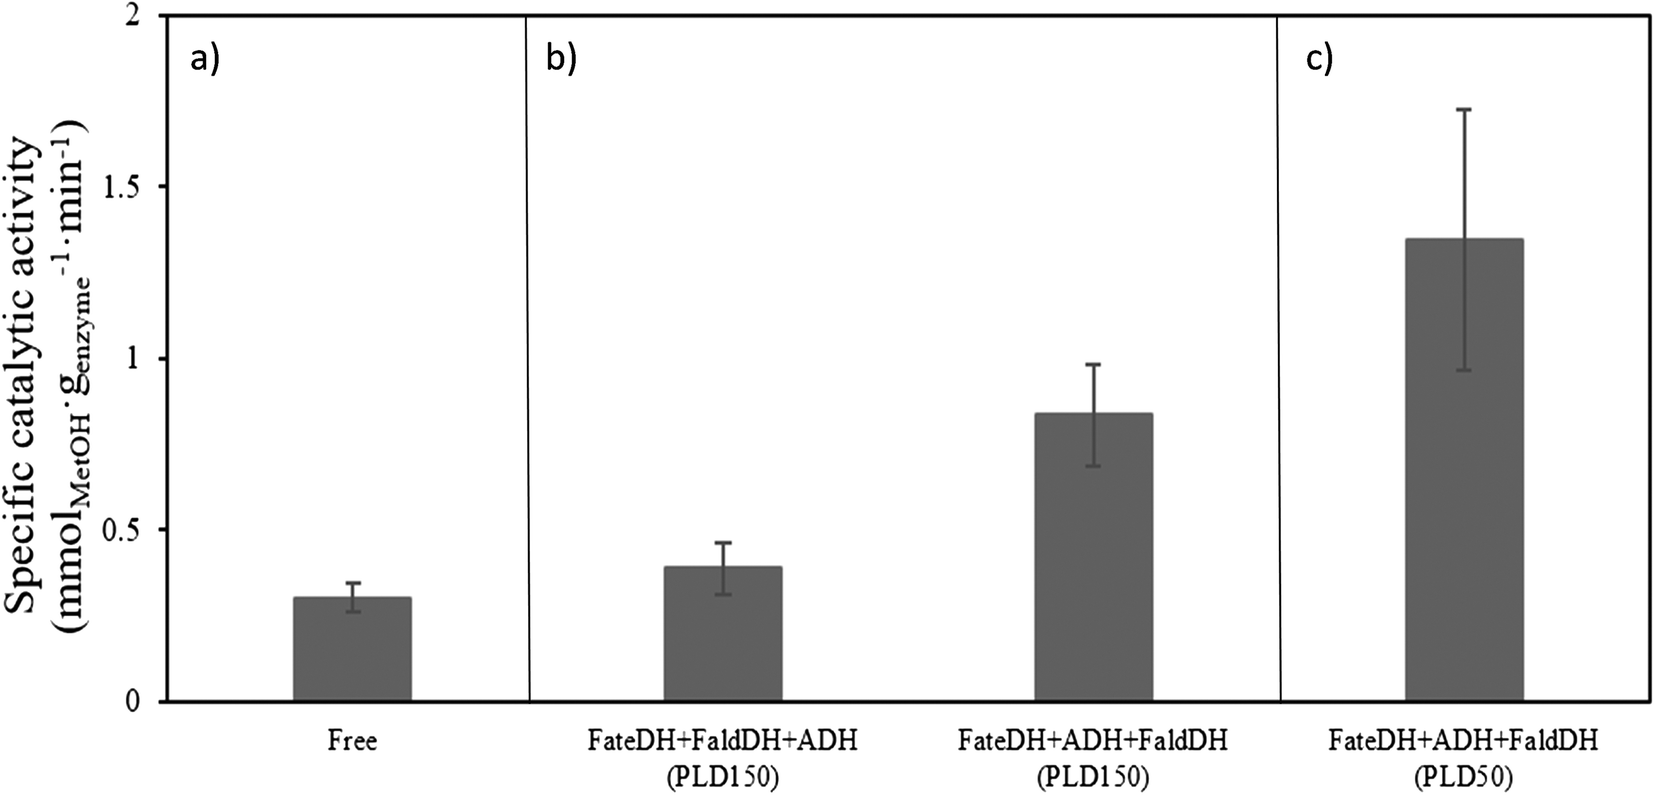 | ||
| Fig. 3 The specific catalytic activity of the cascade reaction using a) free enzymes; b) immobilized enzymes at targeted loading PLD150; c) immobilized enzymes at targeted loading PLD50. The specific catalytic activity calculated for immobilized enzymes was corrected considering the percentage of each enzyme that became immobilized (reaction conditions used: FateDH (0.05 mg ml−1), FaldDH (0.75 mg ml−1), ADH (3.75 mg ml−1), NADH (100 mM), and KHCO3 (200 mM) at pH 6.5, under CO2 atmosphere at 5 bar pressure for 1 h at 37 °C under stirring). | ||
The catalytic activity was also tested using this method of immobilization at a lower protein loading (PLD50). The specific activity for the reaction using PLD50 was higher than for PLD150 (comparing Fig. 3(b) and (c)). This might be due to the fact that at PLD150 the maximum protein loading was reached and at high loadings, where diffusional limitations of substrate/product within the pores of the material are more likely to occur.
Another cause of this difference in activity between PLD and between immobilization order might be the spatial co-distribution of the different enzymes in the MCF-MP. As in the distribution approach in Fig. 2, here the final distribution of the co-immobilized enzymes was imaged in the three immobilization strategies (PLD150 in reaction order, PLD150 in size order, PLD50 in size order). Fig. 4 shows the composite images of the emission intensity of the three dyes, together with the intensity profile of one particle in each case, for each enzyme. The distribution profile does not show any meaningful difference regarding the immobilization strategy. Notably, the presence of other proteins in the same particle did not alter the individual distribution, in comparison to Fig. 2d. Whereas this approach does not reveal any difference in co-localization of the enzymes, it cannot be discarded due to the limited sensitivity of the technology used herein. Super-resolution microscopy, for instance, could show meaningful dissimilarities in the distribution in a more local environment in the particle. A closer proximity of the three enzymes involved in the cascade may lead to higher catalytic rates, as highlighted in our previous work with FRET.29
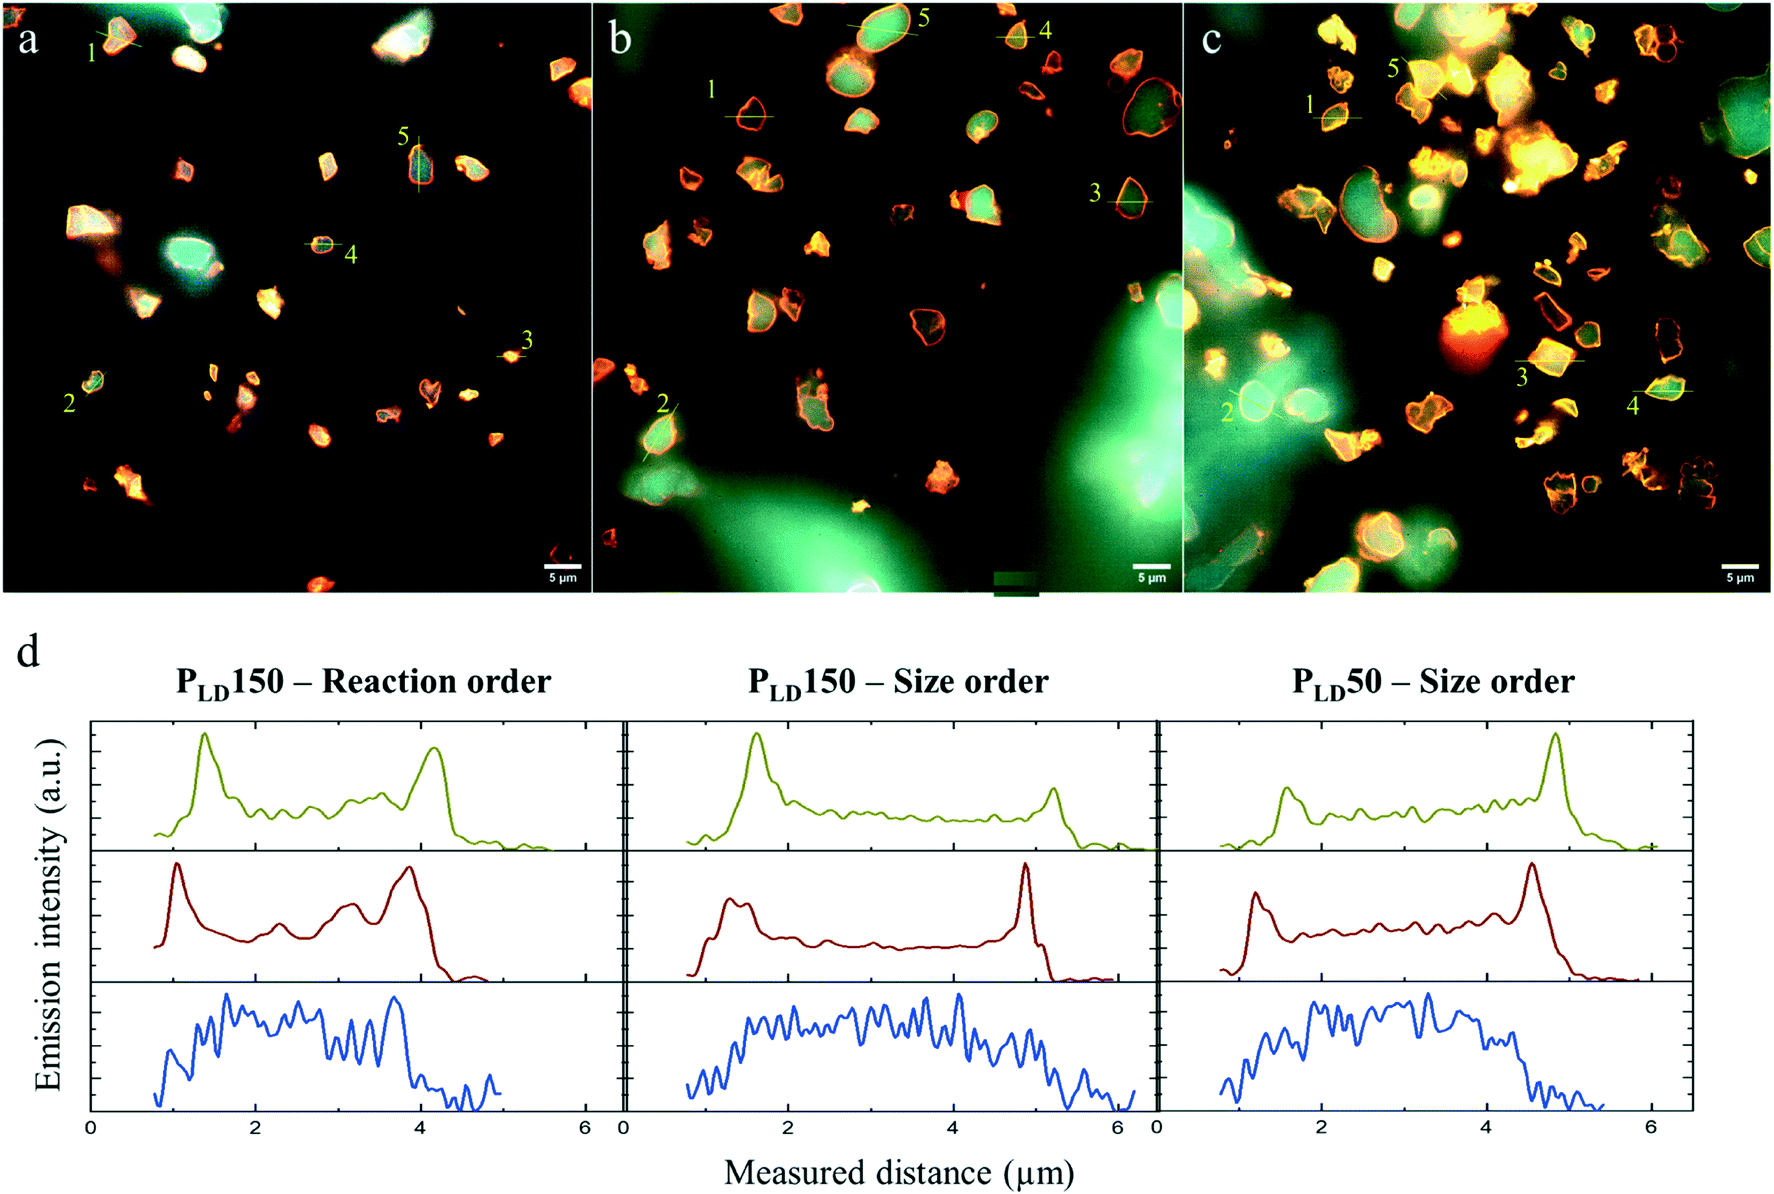 | ||
| Fig. 4 The co-distribution of FateDH-Cy3, FaldDH-Cy5 and ADH-AF488 in MCF particles after the co-immobilization. Each image is a composite of the emission of the three dyes (Fig. S4, S6 and S8†). The scale bar is 5 μm. (a) PLD150 in reaction order, (b) PLD150 in size order, (c) PLD50 in size order. (d) Emission intensity profiles of particle #1 in a–c; Cy3 is shown in yellow, Cy5 in red, AF488 in blue. All the profiles are in Fig. S5, S7 and S9.† | ||
As shown in Fig. 3, the highest catalytic activity of 1.35 mmolMetOH genzyme−1 min−1 was found with the enzymes immobilized according to their size (FateDH → ADH → FaldDH) and under PLD50-conditions. It represents a methanol production about 4.5 times higher than from the enzymes free in solution. To the best of our knowledge this is the highest specific catalytic activity reported for this cascade reaction in the absence of a regeneration system for NADH. Cazelles et al.19 using very similar conditions (substrate and cofactor concentration, pressure and temperature) with enzymes encapsulated in phospholipids-silica nanocapsules observed the production of 0.88 mmol genzyme−1 of methanol in a 3 h reaction. Jiang et al.43 also found similar results as Cazelles et al.,19 but using the enzymes immobilized in protoamine silica microcapsules encapsulated in alginate beads.
In comparison with these previous reports,19,43,44 the improvement observed in the present study can be related to the immobilization method applied and the properties of the host material. This is the only work where the three dehydrogenases were immobilized simply through physical adsorption. Using this method of immobilization, no specific organic solvent is required, and conformational changes of the enzymes caused by covalent attachment, for example, can be avoided. Moreover, it has been suggested before29 that the use of MCF functionalized with mercaptopropyl groups improved the catalytic activity of the two first enzymes in the cascade (FateDH and FaldDH) due to the closer proximity of the immobilized enzymes, which potentially led to substrate channeling. The same effect could also be a reason for the improvement found in the present work.
Comparing with other CO2 reduction systems, the results in this work become even more interesting. For instance, the highest specific catalytic activity using Cu–C/TiO2 in photocatalysis is about 0.4 μmolMetOH gcatalyst−1 min−1.15 Using heterogeneous catalysts, similar results as found in this work are reported. However, heterogeneous catalysts usually require expensive noble metals and operate in high temperatures and pressure, contrary to the mild conditions using enzymes.10 For example, Sahibzada45 reported a methanol production of 1.3 mmolMetOH gcatalyst−1 min−1 using Pd promoted Cu/ZnO catalysts at 250 °C and 45 bars pressure. In some more recent work, Rui et al.,46 using Auδ+–In2O3−x as catalyst obtained a yield of methanol of 0.2 mmolMetOH gcatalyst−1 min−1 at 250 °C and 50 bars which was a similar result as obtained by Jia et al.47 using Ni–In2O3 as catalyst.
4. Conclusions
We demonstrate using a simple method of immobilization the improvement of the enzymatic cascade reaction system to convert CO2 to methanol. By labelling the three enzymes with different dyes, it was possible to monitor their uptake independently from each other as well as their particular distribution along the particle. Using MCF functionalized with mercaptopropyl groups as the host material for the enzyme immobilization, the reaction rate of methanol formation increased about 4.5 times in comparison with the enzymes free in solution. Further improvement of the cascade reaction is expected when adding a regenerator for recycling NADH to the system.Conflicts of interest
There are no conflicts to declare.Acknowledgements
M. Z. V. G and A. E. C. P. would like to acknowledge Jacob Kindbom from Chalmers Mass Spectroscopy Infrastructure for providing assistance in the gas chromatography analysis. Funding for this project from the Swedish Research Council (VR) is acknowledged as a part of the Linnaeus Centre for Bio-inspired Supramolecular Function and Design – SUPRA.References
- L. Al-Ghussain, Environ. Prog. Sustainable Energy, 2019, 38, 13–21 CrossRef CAS.
- Z. Qin, Q. Zhuang and X. Zhu, GCB Bioenergy, 2015, 7, 25–39 CrossRef CAS.
- P. A. Owusu and S. Asumadu-Sarkodie, Cogent Eng., 2016, 3, 1, DOI:10.1080/23311916.2016.1167990.
- I. Ganesh, Renewable Sustainable Energy Rev., 2014, 31, 221–257 CrossRef CAS.
- F. Marpani, M. Pinelo and A. S. Meyer, Biochem. Eng. J., 2017, 127, 217–228 CrossRef CAS.
- S. K. Bhatia, R. K. Bhatia, J. M. Jeon, G. Kumar and Y. H. Yang, Renewable Sustainable Energy Rev., 2019, 110, 143–158 CrossRef CAS.
- G. A. Olah, Angew. Chem., Int. Ed., 2013, 52, 104–107 CrossRef CAS PubMed.
- M. Aresta, A. Dibenedetto and A. Angelini, in Co2 Chemistry, ed. M. Aresta and R. V. Eldik, 2014, vol. 66, pp. 259–288 Search PubMed.
- M. Aresta and A. Dibenedetto, Dalton Trans., 2007, 2975–2992, 10.1039/b700658f.
- Y. Sun, Z. P. Lin, S. H. Peng, V. Sage and Z. Sun, J. Nanosci. Nanotechnol., 2019, 19, 3097–3109 CrossRef CAS PubMed.
- F. S. Baskaya, X. Zhao, M. C. Flickinger and P. Wang, Appl. Biochem. Biotechnol., 2010, 162, 391–398 CrossRef CAS PubMed.
- S. W. Xu, Y. Lu, J. Li, Z. Y. Jiang and H. Wu, Ind. Eng. Chem. Res., 2006, 45, 4567–4573 CrossRef CAS.
- J. Liu and M. Antonietti, Energy Environ. Sci., 2013, 6, 1486–1493 RSC.
- S. Das and W. M. A. W. Daud, Renewable Sustainable Energy Rev., 2014, 39, 765–805 CrossRef CAS.
- Y. N. Kavil, Y. A. Shaban, R. K. Al Farawati, M. I. Orif, M. Zobidi and S. U. M. Khan, J. Photochem. Photobiol., A, 2017, 347, 244–253 CrossRef CAS.
- N. V. D. Long, J. Lee, K. K. Koo, P. Luis and M. Lee, Energies, 2017, 10(4), 473, DOI:10.3390/en10040473.
- H. R. Jhong, S. C. Ma and P. J. A. Kenis, Curr. Opin. Chem. Eng., 2013, 2, 191–199 CrossRef.
- J. Q. Luo, A. S. Meyer, R. V. Mateiu and M. Pinelo, New Biotechnol., 2015, 32, 319–327 CrossRef CAS PubMed.
- R. Cazelles, J. Drone, F. Fajula, O. Ersen, S. Moldovan and A. Galarneau, New J. Chem., 2013, 37, 3721–3730 RSC.
- Q. Sun, Y. Jiang, Z. Jiang, L. Zhang, X. Sun and J. Li, Ind. Eng. Chem. Res., 2009, 48, 4210–4215 CrossRef CAS.
- T. Quinto, V. Köhler and T. R. Ward, Top. Catal., 2014, 57, 321–331 CrossRef CAS.
- A. Weckbecker, H. Gröger and W. Hummel, in Biosystems Engineering I: Creating Superior Biocatalysts, ed. C. Wittmann and R. Krull, Springer Berlin Heidelberg, Berlin, Heidelberg, 2010, pp. 195–242, DOI:10.1007/10_2009_55.
- N. Carlsson, H. Gustafsson, C. Thorn, L. Olsson, K. Holmberg and B. Akerman, Adv. Colloid Interface Sci., 2014, 205, 339–360 CrossRef CAS PubMed.
- P. S. N. Zadeh, M. Z. D. Gomes, A. E. C. Palmqvist and B. Akerman, ACS Appl. Nano Mater., 2019, 2(11), 7245–7254 CrossRef.
- N. E. Labrou and D. J. Rigden, Biochem. J., 2001, 354, 455–463 CrossRef CAS.
- N. Tanaka, Y. Kusakabe, K. Ito, T. Yoshimoto and K. T. Nakamura, J. Mol. Biol., 2002, 324, 519–533 CrossRef CAS PubMed.
- S. B. Raj, S. Ramaswamy and B. V. Plapp, Biochemistry, 2014, 53, 5791–5803 CrossRef CAS PubMed.
- P. A. Russo, M. Carrott, P. A. M. Mourao and P. J. M. Carrott, Colloids Surf., A, 2011, 386, 25–35 CrossRef CAS.
- P. S. N. Zadeh, M. Z. D. Gomes, B. Akerman and A. E. C. Palmqvist, ACS Catal., 2018, 8, 7251–7260 CrossRef.
- F. Jia, B. Narasimhan and S. Mallapragada, Biotechnol. Bioeng., 2014, 111, 209–222 CrossRef CAS PubMed.
- M. Castellana, M. Z. Wilson, Y. F. Xu, P. Joshi, I. M. Cristea, J. D. Rabinowitz, Z. Gitai and N. S. Wingreen, Nat. Biotechnol., 2014, 32, 1011 CrossRef CAS PubMed.
- I. Wheeldon, S. D. Minteer, S. Banta, S. C. Barton, P. Atanassov and M. Sigman, Nat. Chem., 2016, 8, 299–309 CrossRef CAS PubMed.
- P. Schmidt-Winkel, W. W. Lukens, P. D. Yang, D. I. Margolese, J. S. Lettow, J. Y. Ying and G. D. Stucky, Chem. Mater., 2000, 12, 686–696 CrossRef CAS.
- W. W. Lukens, P. Schmidt-Winkel, D. Y. Zhao, J. L. Feng and G. D. Stucky, Langmuir, 1999, 15, 5403–5409 CrossRef CAS.
- S. Brunauer, P. H. Emmett and E. Teller, J. Am. Chem. Soc., 1938, 60, 309–319 CrossRef CAS.
- J. Kim, R. J. Desch, S. W. Thiel, V. V. Guliants and N. G. Pinto, J. Chromatogr. A, 2011, 1218, 7796–7803 CrossRef CAS PubMed.
- N. L. Dias, Colloids Surf., A, 1998, 144, 219–227 CrossRef.
- A. S. Bommarius and B. R. Riebel, Application of Enzymes as Catalysts: Basic Chemicals, Fine Chemicals, Food, Crop Protection, Bulk Pharmaceuticals, in Biocatalysis, 2004, DOI:10.1002/3527602364.ch7.
- J. S. White and D. C. White, Source Book of Enzymes, Taylor & Francis, 1997 Search PubMed.
- P. L. Felgner and J. E. Wilson, Anal. Biochem., 1976, 74, 631–635 CrossRef CAS PubMed.
- M. Zezzi do Valle Gomes and A. E. C. Palmqvist, New J. Chem., 2017, 41, 11391–11397 RSC.
- M. Zezzi do Valle Gomes and A. E. C. Palmqvist, Colloids Surf., B, 2018, 163, 41–46 CrossRef CAS PubMed.
- Y. Jiang, Q. Sun, L. Zhang and Z. Jiang, J. Mater. Chem., 2009, 19, 9068–9074 RSC.
- X. Wang, Z. Li, J. Shi, H. Wu, Z. Jiang, W. Zhang, X. Song and Q. Ai, ACS Catal., 2014, 4, 962–972 CrossRef CAS.
- M. Sahibzada, Chem. Eng. Res. Des., 2000, 78, 943–946 CrossRef CAS.
- N. Rui, F. Zhang, K. Sun, Z. Liu, W. Xu, E. Stavitski, S. D. Senanayake, J. A. Rodriguez and C.-J. Liu, ACS Catal., 2020, 10(19), 11307–11317 CrossRef CAS.
- X. Jia, K. Sun, J. Wang, C. Shen and C. Liu, J. Energy Chem., 2020, 50, 409–415 CrossRef.
Footnotes |
| † Electronic supplementary information (ESI) available. See DOI: 10.1039/d1cy01354h |
| ‡ M. Z. V. G. and G. M. contributed equally to this work. |
| This journal is © The Royal Society of Chemistry 2021 |