 Open Access Article
Improved lithium ion dynamics in crosslinked PMMA gel polymer electrolyte†
Ava
Hosseinioun
a,
Pinchas
Nürnberg
b,
Monika
Schönhoff
 *b,
Diddo
Diddens
*a and
Elie
Paillard
 *a
*a
aHelmholtz Institute Münster, Forschungszentrum Jülich (IEK-12), Corrensstr. 46, 48149 Münster, Germany. E-mail: d.diddens@fz-juelich.de; e.paillard@fz-juelich.de
bInstitute of Physical Chemistry, University of Münster, Corrensstr. 28/30, 48149 Münster, Germany. E-mail: schonhoff@uni-muenster.de
First published on 2nd September 2019
Abstract
Since PMMA-based gel polymer electrolytes could substitute PVDF-HFP based gels currently used in Li-ion batteries at lower financial and environmental costs, we investigate here the solvation and transport properties of the lithium ions in a crosslinked PMMA-based gel polymer electrolyte by a combination of thermal and electrochemical methods, Raman spectroscopy, pulse field gradient (PFG) and electrophoretic NMR (eNMR) techniques, as well as ab initio calculations. The conductivity of the gel containing 10 wt% polymer is only reduced by 14% relative to the liquid electrolyte. In addition, the co-solvation by polymer functional groups, a priori expected to slow lithium transport relatively to the anion, has instead a positive effect on lithium transport. Indeed, the ester groups not only participate in lithium solvation and increase ionic dissociation, but since this interaction is rather weak, rather than lowering the lithium diffusion relatively to other species, it mainly decorrelates lithium transport from anionic mobility. Compared to its liquid fraction, the gels show, at the same time, better dissociation and a higher lithium transference number, which results in a higher cationic conductivity, despite the overall conductivity loss.
1. Introduction
Gel polymer electrolytes (GPEs) for lithium-ion batteries consist of lithium salts and organic solvents that are trapped in different polymer matrices1 (mostly PVDF-HFP for commercial batteries). GPEs possess characteristics close to those of liquid electrolytes in terms of high ionic diffusivity, but also exhibit cohesive properties (i.e. dimensional stability, which prevents leaks) more similar to solid polymer electrolytes (SPEs), although they do not ensure the separator function in commercial lithium-ion cells. To reach a high mobility close to that of the liquid fraction, high fractions of liquid are included, which requires polymer matrixes that have a good solvent affinity. Thus, to reach mechanical cohesion, chemical (covalent)2 or physical (e.g. bi-phasic)3 crosslinking strategies are used.Even though ion conduction in gels occurs rather similarly to in liquid electrolytes (vs. SPEs), polymers that contain polar groups4,5 also participate in lithium ion coordination and salt dissociation. The interactions between lithium ions and polymer can increase the number of free charged species and might positively influence conductivity in this regard. However, it can be either advantageous or disadvantageous for ionic mobility. Several reports suggest that strong lithium ion coordination by polymer networks containing ether oxygen units (e.g. PEO) participate to low ionic mobility.6–8 On the other hand, Tominaga et al. and Brandell et al.7,9 reported on loose coordination for polyesters and polycarbonates. Therefore, the polyester PMMA matrix was chosen in this study as it contains C![[double bond, length as m-dash]](https://www.rsc.org/images/entities/char_e001.gif) O functional groups, which could be favorable in terms of lithium ionic mobility. In addition, PMMA was reported to exhibit high ionic conductivity as a result of high electrolyte uptake.10,11 Besides, from a practical point of view, it is non-toxic and non-fluorinated and PMMA-based gel electrolytes can be easily prepared in situ from monomer and crosslinker low viscosity mixtures and allow long term cycling of lithium-ion batteries.12
O functional groups, which could be favorable in terms of lithium ionic mobility. In addition, PMMA was reported to exhibit high ionic conductivity as a result of high electrolyte uptake.10,11 Besides, from a practical point of view, it is non-toxic and non-fluorinated and PMMA-based gel electrolytes can be easily prepared in situ from monomer and crosslinker low viscosity mixtures and allow long term cycling of lithium-ion batteries.12
To investigate ion solvation and coordination in electrolytes, spectroscopic techniques such as RAMAN are commonly used.13,14 On the other hand, to investigate ion dynamics, nuclear magnetic resonance (NMR) techniques are useful. With multinuclear pulsed-field-gradient (PFG) NMR, diffusion coefficients of the different species are obtained, which has been widely used to characterize both liquid and polymer electrolytes.15 In particular, lithium transference numbers can be estimated, however, only under the assumption of validity of the Nernst–Einstein equation, which is often not fulfilled due to ion pairing. Complementarily to this approach, the model-free study of correlations and coordination behavior in electrolytes by electrophoretic NMR (eNMR)16,17 allows the direct calculation of transference numbers from electrophoretic mobilities without further assumptions, yielding information about correlated ion motion in an electric field. In recent years, it has been applied to several liquid electrolytes to study ion pairing and transference numbers.17–20 For example, in ionic liquids, Li–anion clusters could be identified as transport vehicles for Li.20,21 Provided that mobilities are not too low, eNMR is even applicable to polymer electrolytes to determine transference numbers, which has recently been shown for Li salt in poly(ethyleneoxide).22
In addition to experimental measurements, molecular modelling techniques are extremely helpful to gain insights at the microscopic level. Molecular dynamics (MD) simulations are frequently employed to study ion coordination23–26 or ion transport mechanism27–33 in electrolyte materials, however, these calculations depend on reliable force fields34–36 to obtain accurate results. On the other hand, ab initio quantum chemistry (QC) calculations require no further input than the molecular structure, and offer access to binding energies between different molecular species. In case of battery materials, several studies focused on the stability of the lithium coordination sphere.37–40
Here we study the influence of polymer network addition on electrolyte transport properties in a crosslinked poly(methyl methacrylate) (PMMA) gel polymer electrolyte (PGPE). PGPE allows the cycling of graphite/LiNi0.33Mn0.33Co0.33O2 (NMC111) lithium ion cells after in situ crosslinking.12 Since the investigated gel polymer membrane contains C![[double bond, length as m-dash]](https://www.rsc.org/images/entities/char_e001.gif) O groups on the backbone and –CH2–CH2–O– groups (EO) on the oligoethylene oxide crosslinker, these polar groups likely form complexes with lithium salts and organic solvents and consequently increase the salt dissociation degree within the PGPE compared to the corresponding liquid electrolyte. This increased dissociation is investigated here by Raman spectroscopy and by the changes in self-diffusion coefficients and electrophoretic mobilities of the different ion species via7Li, 19F and 13C PFG and electrophoretic NMR. In addition, we used both density functional theory (DFT) and higher-level QC calculations to characterize the Li+ coordination environment in the microscopically heterogeneous PGPE.
O groups on the backbone and –CH2–CH2–O– groups (EO) on the oligoethylene oxide crosslinker, these polar groups likely form complexes with lithium salts and organic solvents and consequently increase the salt dissociation degree within the PGPE compared to the corresponding liquid electrolyte. This increased dissociation is investigated here by Raman spectroscopy and by the changes in self-diffusion coefficients and electrophoretic mobilities of the different ion species via7Li, 19F and 13C PFG and electrophoretic NMR. In addition, we used both density functional theory (DFT) and higher-level QC calculations to characterize the Li+ coordination environment in the microscopically heterogeneous PGPE.
2. Experimental
2.1 Chemicals
Lithium bis(trifluoromethanesulfonyl)imide (LiTFSI) (BASF) and lithium bis(oxalato)borate (LiBOB) (BASF) salts were dried under reduced pressure of 1 ×10⁻³ mbar for 2 days at 120 °C and 110 °C respectively, while ethylene carbonate (EC) and propylene carbonate (PC) (both BASF, SelectilyteTM) and additives (vinylene carbonate (VC) (BASF, SelectilyteTM) and 1-propene-1,3-sultone (PES) (>98%, TCI Chemicals)) were used as received. Impurity content and water level were analysed by coulometric Karl-Fischer titration (Metrohm 851 Titrando) and liquid 1H, 1F, 13C-NMR (Bruker AVANCE, 300 MHz or 400 MHz). Methyl methacrylate (MMA) (99%, Merck) and poly(ethylene glycol) dimethacrylate (Mn = 750 g mol−1, Merck) were stored on molecular sieve (3 Å) for one week before use. Azobisisobutyronitrile (AIBN, 98%, Merck) was used as received.2.2 PGPE and liquid electrolyte preparation
All preparation steps for PGPE were carried out in a dry room (dew point < −65 °C and H2O < 5.3 ppm). Crosslinking was used for obtaining PGPEs with sufficient mechanical stability at low polymer content. The investigated PGPE contain the polymer precursor and Li salts and solvents which are combined with the ratio of 10![[thin space (1/6-em)]](https://www.rsc.org/images/entities/char_2009.gif) :
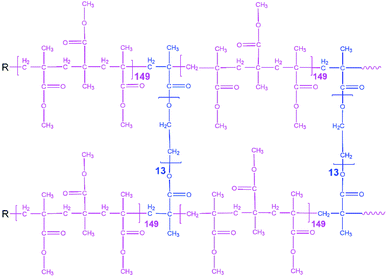
:![[thin space (1/6-em)]](https://www.rsc.org/images/entities/char_2009.gif) 90 wt% (polymer precursor: liquid fraction). The proposed polymer precursor contains 95.05 wt% of MMA monomer, 4.75 wt% poly(ethylene glycol) dimethacrylate (5 wt% of MMA) and 0.2 wt% AIBN as thermal initiator, and the corresponding structure is indicated in Fig. 1. Moreover, the liquid fraction was prepared in an Ar-filled glove box (<0.1 ppm O2 and H2O) and with the formulation of 0.9 M LiTFSI + 0.1 M LiBOB in EC/PC 7
90 wt% (polymer precursor: liquid fraction). The proposed polymer precursor contains 95.05 wt% of MMA monomer, 4.75 wt% poly(ethylene glycol) dimethacrylate (5 wt% of MMA) and 0.2 wt% AIBN as thermal initiator, and the corresponding structure is indicated in Fig. 1. Moreover, the liquid fraction was prepared in an Ar-filled glove box (<0.1 ppm O2 and H2O) and with the formulation of 0.9 M LiTFSI + 0.1 M LiBOB in EC/PC 7![[thin space (1/6-em)]](https://www.rsc.org/images/entities/char_2009.gif) :
:![[thin space (1/6-em)]](https://www.rsc.org/images/entities/char_2009.gif) 3 wt% + 3 wt% VC + 3 wt% PES. The gel polymer precursor was cast in a frame to control the thickness of the membrane. As the final step, the frame containing the gel precursor was kept in an oven at 75 °C overnight.
3 wt% + 3 wt% VC + 3 wt% PES. The gel polymer precursor was cast in a frame to control the thickness of the membrane. As the final step, the frame containing the gel precursor was kept in an oven at 75 °C overnight.
2.3 Electrochemical testing
The ionic conductivity of PGPEs was measured using electrochemical impedance spectroscopy (EIS). EIS spectra were acquired on a Novocontrol Alpha-A analyser, equipped with a ZG2 extension interface and a cryostat for temperature control in the frequency range from 1 MHz to 0.1 Hz and in the temperature range from −30 to 80 °C with 10 °C intervals and temperature equilibration for 30 min prior to each measurement. PGPEs were sandwiched between two stainless steel electrodes with 100 μm gap (using a 14 mm inner diameter PTFE spacer in a 2032 coin cell). Liquid electrolyte ionic conductivity was measured with a MCS10 EIS-based multichannel conductivity meter from Bio-logic with the same temperature range and interval as for PGPEs.2.4 Thermal analysis
Differential scanning calorimetry (DSC) was conducted using a DSC Q2000 (TA instruments) to investigate glass transition temperatures. All the samples were hermetically sealed in aluminum TzeroTM pans in a dry room atmosphere (dew point < −65 °C and H2O < 5.3 ppm). The samples were cooled from 20 to −150 °C and heated to 150 °C for PGPE and 120 °C for liquid fraction, respectively, at 10 K min−1 for three cycles under He flow.2.5 Spectroscopic analysis
The self-diffusion coefficient D for each species was measured with a stimulated echo pulse sequence in a pulsed-field-gradient NMR (PFG-NMR) experiment. D was calculated by using eqn (1) with the gyromagnetic ratio γ, the gradient strength g, the gradient duration δ (1 ms) and the observation time Δ (100 ms).
 | (1) |
 | (2) |
The gradient strength g varied between 100 G cm−1 and 500 G cm−1. U was increased in 21 steps from 0 V to 120 V with alternating sign of the voltage to cover the largest possible voltage range without decomposition of the sample. The phase shift analysis was performed by fits of the spectra with phase sensitive Lorentzian profiles as described elsewhere.41
2.6 Quantum chemical calculations
All QC calculations have been performed with the Gaussian 16 package.42 In a first step, the binding energies and free energies between a lithium ion and a single EC, PC, TFSI, or BOB molecule, as well as an MMA monomer and dimer (denoted as (MMA)2) have been computed. Additionally, the interaction of Li+ with tetraethylene glycol dimethyl ether (TEGDME) has been computed as a model for lithium ions coordinating to the longer oligoethylene oxide cross-linkers. In a second step, we performed calculations of larger clusters composed of the aforementioned molecules mimicking the entire lithium solvation shell in the electrolyte.38–40For the Li+–solvent, Li+–anion and Li+–dimers, we compared computationally expedient PBE/6-31+G(d,p) calculations to higher-level calculations with the accurate but computationally expensive G4MP2 composite method.43 Furthermore, for the PBE/6-31+G(d,p) calculations, we also assessed the effect of Grimme's D3 dispersion correction with Becke–Johnson damping44 on the results. Solvent effects were taken into account via the implicit SMD model45 using a dielectric constant of ε = 20 characteristic for carbonate mixtures.38 For TFSI, both mono- and bidentate coordinations have been taken into account. For BOB, we disregarded a possible coordination via the oxygen atoms linked to the central boron atom, and only took coordination via the double bonded oxygen into account. The results for the dimer calculations are shown in Table S1 in the ESI.†
As reported previously,38–40 the PBE calculations reproduce the G4MP2 values surprisingly well for EC, PC, PMMA, and BOB. Here, the deviations are mainly even below 1 kcal mol−1, which is comparable to the intrinsic uncertainty of G4MP2.43 For TEGDME and monodentate TFSI, however, the deviations are 4 kcal mol−1 and 2 kcal mol−1, respectively. For the calculations of larger clusters involving TEGDME or monodentate TFSI (see below), we therefore used the (free) energy difference between the PBE and the G4MP2 calculations for the Li+–TEGDME or monodendate Li+–TFSI dimer as a correction to the cluster energy as motivated previously.39,40 We also note that the inclusion of an empirical dispersion correction44 did not improve the accuracy of the PBE/6-31+G(d,p) calculations, but rather led to larger deviations from the G4MP2 reference calculations (Table S1†). Therefore, we abstained from using a dispersion correction for the following cluster calculations.
Motivated by the good agreement between PBE/6-31+G(d,p) and G4MP2 calculations, we finally performed calculations of larger clusters at the PBE/6-31+G(d,p) level, in which the lithium ion is surround by a full solvation shell with different compositions (see Fig. S1 in ESI†). In all calculations except those involving TEGDME, we fixed the coordination number of Li+ to four. However, since PMMA, TEGDME, TFSI, or BOB may coordinate via multiple sites, some of the four coordination sites may originate from the same molecule. In addition to the explicit modelling of the first coordination shell, we modelled solvation effects beyond the first coordination shell by the SMD model45 as described above.
3. Results and discussion
3.1 Ionic conductivities and thermal analysis
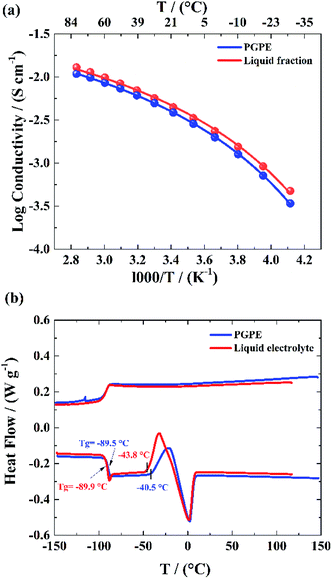
According to eqn (3), ionic conductivity is dependent on ionic mobility (μi) and on the number density of ions (ni) for each ion species i. As can be seen in Fig. 2(a), the ionic conductivity of the EC/PC liquid electrolyte is 4.5 mS cm−1. The PGPE with 10 wt% polymer exhibits a reduced ionic conductivity of 3.9 mS cm− 1 at 20 °C, presumably due to viscosity increase, geometrical restriction46 and interactions between ions and polymer chain. The conductivities are, however, relatively close to each other, with the gel value reaching 86% of that of the liquid fraction. | (3) |
Moreover, as seen in Fig. 2(b) the PGPE exhibits a low Tg, similar to that of the liquid fraction (−89.5 °C, vs. −89.9 °C at the inflexion point at 10 K min−1), which indicates that the presence of the polymer hardly affects the average mobility of the electrolyte species compared to the liquid electrolyte. No crystallization is observed on the cooling ramps and cold crystallization and melting are only slightly affected by the presence of the polymer (the presence of the polymer offsets the cold crystallization temperature onset) and the peaks are small in both cases. The presence of the polymer matrix slightly decreases the cold crystallization and melting enthalpies (ca. 16 J g−1vs. 21 J g−1), either due to lowering the crystal fraction or lowering its melting enthalpy.
3.2 Degree of ion dissociation
Raman spectroscopy was performed to provide complementary insights concerning the dissociation degree of the Li salts in the gel polymer electrolyte.The Raman spectra of the EC/PC-based liquid electrolyte and the PGPE are shown in Fig. 3(a) and (b) respectively in the 690–760 cm−1 range. They exhibit two peaks: one at 719 cm−1, corresponding to the symmetric ring deformation of EC47 and one at 743 cm−1, corresponding to the S–N–S stretching mode of the TFSI anion. This peak is sensitive to TFSI solvation and can be split into two contributions: one a at 739 cm−1, corresponding to free TFSI anions and one at 744 cm−1, attributed to contact ion pair (CIP).48 Thus, the spectra were fitted with pseudo-Voigt functions to determine the fractions of TFSI in each solvating state. The gel and liquid electrolytes studied here contain relatively dilute salt solutions (1 M) and a well dissociating solvent mixture and are thus expected to contain significant fractions of free anions.48 Indeed, the fractions of free anion are high in both cases and is even higher in the case of PGPE (83%) compared to the liquid electrolyte (71%) which indicates a higher degree of salt dissociation in gel polymer electrolytes.
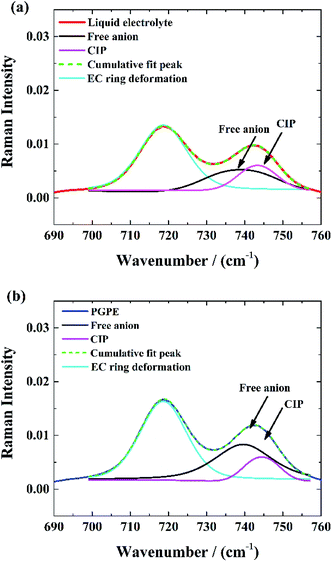 | ||
| Fig. 3 Deconvolution of S–N–S stretching vibrational mode of the TFSI-anion: (a) in liquid electrolyte, (b) in PGPE. | ||
3.3 Diffusivities
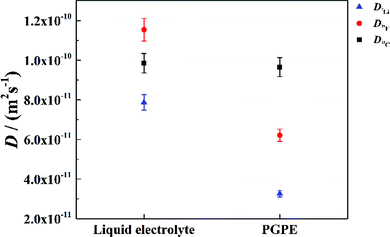
To further validate the dissociation degree calculated from Raman spectroscopy measurements, self-diffusion coefficients of all involved ionic species were determined via PFG-NMR measurements. Fig. 4 shows the data obtained for the PGPE and the liquid electrolyte for three observed nuclei (19F, 7Li, 13C). The spectral lines that were evaluated correspond to Li, TFSI and BOB, respectively. We note here that NMR quantities measured over an observation time in the order of 100 ms in liquids present fast exchange averages over different species. This implies for example that Li diffusion coefficients (and also mobilities) are average values over free Li+, undissociated Li ion pairs and any further clusters. In Fig. 4, it is evident that D7Li and D19F are strongly decreasing from the liquid electrolyte to the PGPE. Within the margin of error D13C is not changing at all. A certain decrease of the diffusion coefficients is expected due to the increase in viscosity and the geometrical restriction arising from polymer addition to the liquid electrolyte.46 However, the behavior of D13C is rather unexpected and suggests that the effect of geometrical restriction is compensated by other factors. Such factors may be changes in ion coordination and clustering, which can partly compensate for the geometrical restriction, as recently shown in similar polymer gel electrolyte systems.46An average salt dissociation degree α can be estimated from the diffusion data in combination with conductivities. An estimate for α (eqn (4)) is given by the ratio of the conductivity measured by impedance spectroscopy σimp and the conductivity calculated via the Nernst–Einstein equation σPFG (eqn (5)).
 | (4) |
 | (5) |
In Table 1 the values for α are shown and compared to those extracted from the Raman spectra. For both systems, α is in very good agreement with the values derived from Raman spectra. A dissociation degree of 81% in the case of the PGPE shows, in comparison to 67% for the liquid electrolyte, a significant increase in dissociation. This underlines the positive effect of the gel on ion dissociation as previously shown in the literature.49,50
 of PGPE and liquid electrolyte calculated from impedance and PFG-NMR measurements, respectively
| Sample | Dissociation degree α | |
|---|---|---|
| Raman | PFG-NMR | |
| Liquid electrolyte | 71% | 67% |
| PGPE | 83% | 81% |
3.4 Lithium coordination by polar groups of polymer
The C![[double bond, length as m-dash]](https://www.rsc.org/images/entities/char_e001.gif) O stretching mode of PMMA7,51,52 is also convenient to investigate lithium coordination. Fig. 5 shows the Raman spectra of the neat PGPE precursor solution without salt or liquid electrolyte (black curve), with the C
O stretching mode of PMMA7,51,52 is also convenient to investigate lithium coordination. Fig. 5 shows the Raman spectra of the neat PGPE precursor solution without salt or liquid electrolyte (black curve), with the C![[double bond, length as m-dash]](https://www.rsc.org/images/entities/char_e001.gif) O stretching band of the MMA monomer at 1730 cm−1. For the PGPE without any solvents (pink curve), this band evolves toward lower frequencies and adopts a more complex shape, as a result of the Li+ solvation by the ‘dry’ polymer. The presence of alkyl carbonate solvents (EC and PC) in the PGPE (blue curve), leads to the appearance of a peak at 1760–1840 cm−1 which is assigned to the Li+ solvation by the C
O stretching band of the MMA monomer at 1730 cm−1. For the PGPE without any solvents (pink curve), this band evolves toward lower frequencies and adopts a more complex shape, as a result of the Li+ solvation by the ‘dry’ polymer. The presence of alkyl carbonate solvents (EC and PC) in the PGPE (blue curve), leads to the appearance of a peak at 1760–1840 cm−1 which is assigned to the Li+ solvation by the C![[double bond, length as m-dash]](https://www.rsc.org/images/entities/char_e001.gif) O groups in EC/PC (stretching band of C
O groups in EC/PC (stretching band of C![[double bond, length as m-dash]](https://www.rsc.org/images/entities/char_e001.gif) O). However, a small peak remains around 1730 cm−1 and confirms the co-solvation by the polymer in the presence of solvents. The dominance of the Li coordination to the carbonates also indicates that the transport mechanism should be dominated by organic solvents rather than polymer network.7
O). However, a small peak remains around 1730 cm−1 and confirms the co-solvation by the polymer in the presence of solvents. The dominance of the Li coordination to the carbonates also indicates that the transport mechanism should be dominated by organic solvents rather than polymer network.7
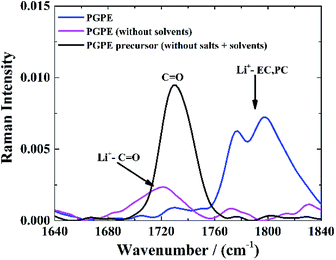 | ||
Fig. 5 Raman spectra of C![[double bond, length as m-dash]](https://www.rsc.org/images/entities/char_e001.gif) O stretching mode of PMMA by introducing the same salts and solvents as in PGPE. O stretching mode of PMMA by introducing the same salts and solvents as in PGPE. | ||
3.5 Electrophoretic mobility
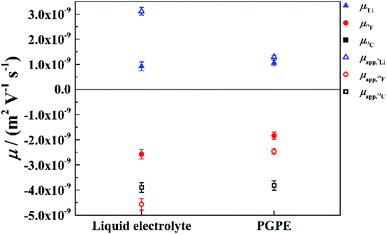
For a deeper look into correlated ion motion in the investigated system, electrophoretic NMR (eNMR) experiments are very useful. In contrast to PFG-NMR, with eNMR it is possible to obtain directly the electrophoretic mobilities of all species containing NMR-active nuclei without assuming ideal, non-correlated ion motion. Unfortunately, due to lower signal intensity, it was not possible to obtain electrophoretic mobilities of the 13C nucleus and therefore of the BOB anion. However, the electrophoretic mobilities of the lithium (7Li) and TFSI (19F) species could be determined. At this point it should be mentioned, that the observation time in the measurement (100 ms) is much larger than the lifetime of a distinguishable lithium–anion cluster. Therefore, all mobilities are weighted average values over single ions and all existing ion pairs or clusters. The mobilities μ19F and μ7Li are shown in Fig. 6 together with the apparent mobilities, which were calculated via the Nernst–Einstein equation assuming completely uncorrelated ion motion.In the liquid electrolyte, the apparent mobilities deviate strongly from the values measured by eNMR, which shows that the former are heavily affected by ion correlations. It is immediately evident that these correlations are decreased by the presence of the polymer, as the apparent values provide better approximations to the electrophoretic mobilities in the case of the gel as compared to the liquid electrolyte (Fig. 6). Thus, our conclusion is that the gel promotes the disintegration of ion clusters. It is interesting, however, that the mobilities μ7Li and μ19F are affected by the polymer in a slightly different way: the crosslinked polymer reduces the electrophoretic mobility of TFSI, while in contrast, μ7Li has the same value within the margin of error for both electrolytes. This asymmetry in the behavior of the Li cation and the anion cannot be explained by a simple enhancement of salt dissociation, i.e. the lowering of the ion pair fraction, and will be discussed in the next paragraph.
Further light is shed on ion speciation by the concept of the effective charge εic (eqn (6)),17 which relates the average charge of a species containing the nucleus in question to the nominal charge of the uncorrelated single ion.17 Values below εic = 1 thus indicate deviations from ideal uncorrelated behavior.
 | (6) |
In Fig. 7 the effective charges of the TFSI and the lithium species are shown. Both increase due to polymer addition, reflecting again the reduction of ion correlations in the gel.  rises from 0.56 in the liquid electrolyte up to 0.75 in the PGPE, however,
  rises by a greater extent from 0.30 up to 0.82. If assuming only Li–TFSI and Li–BOB ion pairs in equilibrium with single ions, this difference cannot be explained, since then ion pair dissociation would be symmetric, leading to identical effective charges of cation and anion. We rather have to conclude on the presence of larger, asymmetric ion clusters dominating charge transport. Similar arguments based on differing effective charges of cation and anions were recently given for ionic liquids.17 It seems that, even in the dilute carbonate-based electrolyte, asymmetric clusters are more relevant than ion pairs. For such clusters, the polymer addition reduces correlations of Li to a considerably higher extent than those of TFSI. Note that in the PGPE, the effective charges of Li and anion are similar, indicating a shift from asymmetric to symmetric clusters. These results demonstrate the positive effect of the polymer matrix on the dissociation of the system in general, in particular mobilizing the lithium cation.
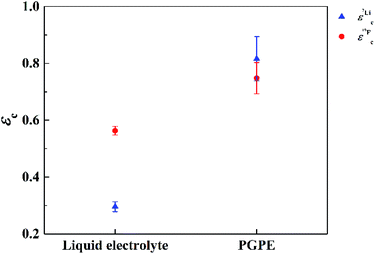 | ||
| Fig. 7 Effective charges for Li (blue triangles) and TFSI (red circles) at 20 °C measured by 7Li and 19F NMR respectively. Errors are calculated by error propagation. | ||
3.6 Transference number
Regarding a possible application of the investigated electrolyte system, the lithium transference number t7Li is an important quantity to estimate the performance of the electrolyte considering the lithium ion motion. In Table 2, the lithium transference number t7Li calculated from eNMR data is shown. In the PGPE the lithium transference number of 0.34 is considerably higher than in the liquid electrolyte (t7Li = 0.25) and the Li+ ionic conductivity (t7Li × σ) increases from 1.13 mS cm−1 for the liquid electrolyte to 1.33 mS cm−1 for PGPE. Thus, the beneficial effect of the polymer concerning the reduction of ion correlations in particular for Li shows up very clearly in the transference number. The last column gives a comparison to the estimates of tapp,7Li from PFG-NMR. It is interesting that the PGPE shows similar values for t7Li and tapp,7Li, implying that t7Li has even reached the value which would be expected for an ideal system without ion correlations.| Sample | t 7Li | t app,7Li |
|---|---|---|
| Liquid electrolyte | 0.25 ± 0.02 | 0.41 ± 0.04 |
| PGPE | 0.34 ± 0.02 | 0.33 ± 0.03 |
3.7 Clusters stabilities based on DFT calculation
Finally, we employ QC calculations of fully solvated Li+ clusters to further rationalize the solution structure within the liquid electrolyte and the PGPE, similar in spirit to recent studies on related electrolytes.38–40Fig. 8 shows the formation energies ΔE and free energies ΔG for various lithium ion clusters comprising the individual electrolyte components (i.e. solvent, polymer and anions). As a reference, we chose the [Li(EC)4]+ cluster modelling a lithium ion that is fully solvated in the liquid phase of the electrolyte. The snapshots of the corresponding clusters in Fig. 8 are shown in Fig. S1 in the ESI,† and the precise values of the energies presented in Fig. 8 are shown in Table S2.† First, we note that the coordination to TEGDME – a proxy for the PEO cross-linker – shows negative values for ΔE and highly negative values for ΔG for both the [Li(TEGDME)(EC)2]+ cluster (Li+ coordination to two ether oxygen atoms) and the [Li(TEGDME)]+ cluster (coordination to all TEGDME oxygen atoms). Thus, it implies that the lithium ions readily coordinate to the crosslinking PEO chains in the electrolyte. However, since the crosslinkers are only employed at low mole fractions (see Section 2.2), these sites are likely to be fully coordinated due to the strong interaction with Li+, thus preventing an excessive binding of a large fraction of lithium ions to the crosslinkers. The comparison of the respective values for ΔE and ΔG demonstrates that the Li+–TEGDME binding is largely stabilized by the entropic gain resulting from the release of four EC molecules from the Li+ solvation shell of [Li(EC)4]+.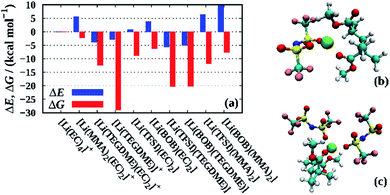 | ||
| Fig. 8 (a) Formation energies ΔE and free energies ΔG for various lithium ion clusters calculated at the PBE/6-31+G(d,p) level of theory. In all cases except those involving TEGDME, the total coordination number has been constrained to four, while for TEGDME also higher coordination numbers as determined from the geometry optimization (see Fig. S1†) have been taken into account. For clusters involving TEGDME, a correction based on the energy differences between PBE and G4MP2 calculations has been applied (see Table S1† and main text). As a reference, we chose the [Li(EC)4]+ cluster modelling a lithium ion fully solvated by carbonate molecules. Snapshots of the [Li(TFSI)(MMA)2] and [Li(TFSI)2(MMA)2]− clusters that partially immobilize cations and anions are shown in (b) and (c), respectively. | ||
A similar effect is found for the formation of contact ion pairs with either TFSI or BOB, modeled by the clusters [Li(TFSI)(EC)2]+ and [Li(BOB)(EC)2]+. Here, ΔE is slightly positive in both cases, however, ΔG is significantly negative, overall rendering both types of ion pairs stable. Contrarily, when TEGDME, instead of EC, accounts for the partial solvation of the ion pairs, i.e. [Li(TFSI)(TEGDME)]+ and [Li(BOB)(TEGDME)]+, both ΔE and ΔG are negative, which suggests that lithium ions coordinating to the crosslinker are more likely engaged in ion pairs than fully solvated by the liquid electrolyte. We also note that the [Li(PC)4]+ cluster is slightly more stable than the [Li(EC)4]+ cluster, both energetically (ΔE = −1.5 kcal mol−1) and entropically (ΔG = −1.8 kcal mol−1, not shown). However, since these differences are rather small, we only expect a slight preference of Li+ to coordinate to PC.
Interestingly, while the coordination of a single Li+ to PMMA (modeled by the coordination to a dimer, i.e. [Li(MMA)2(EC)2]+) only displays a slightly negative value for ΔG in the range of a few kcal mol−1, the corresponding free energies for the anion-containing PMMA clusters [Li(TFSI)(MMA)2] and [Li(BOB)(MMA)2] are substantially negative with ΔG values of −12 and −8 kcal mol−1, respectively. As before, this stabilization mainly stems from an entropic gain resulting from the release of the EC molecules (see above). Moreover, comparative calculations of Li+–PMMA clusters containing two anions, that is [Li(TFSI)2(MMA)2]− and [Li(BOB)2(MMA)2]−, show values in the range of −1.8 to 4.4 kcal mol−1 and −6.9 to −2.1 kcal mol−1 for ΔE and ΔG, respectively (Table S2†), suggesting that also two distinct anions might indirectly bind to the PMMA chains via a lithium ion. In all cases, this indirect binding to PMMA is more pronounced for TFSI as compared to BOB in agreement with the stronger immobilization of TFSI observed experimentally.
Although the impact of the solution structure on its dynamical properties probed by PFG-NMR or eNMR remain inaccessible in our calculations, our results nonetheless rationalize the eNMR results on a qualitative level, which indicate that, while the mobility of the lithium ions in the gel is approximately the same as in the liquid electrolyte within the uncertainties, the anions (mainly TFSI) are slower in the gel than in the liquid electrolyte (see Section 3.5). Due to the formation of larger ion clusters in the vicinity of the PMMA backbone (and also of the less prevalent crosslinkers), the anions become at least partially immobilized. In addition, the large size of the TFSI anions might further hinder their motion through the dense polymer network. Even though the corresponding solvated [Li(EC)4]+ cluster has a comparable size as a TFSI anion, and might thus also be slowed down by the polymer network, the rapid exchange of its solvation shell, however, would still render the lithium ions more mobile. To this end, a future MD simulation study to fully unravel the lithium ion transport mechanism in these electrolytes would be highly promising.
4. Conclusion
The good performance in terms of conductivity of PMMA gel polymer electrolytes vs. its liquid electrolyte fraction is linked on the one hand, to the well retained mobility of ionic species in combination with a reduced effect of ion correlations on lithium mobility as indicated by eNMR, DSC and Raman spectroscopy. Interestingly, the polymer backbone interacts with the lithium cation and, besides increasing ionic dissociation, it slows down the anion while leaving the mobility of the lithium cation almost unaffected. With an improved effective lithium transference number calculated from eNMR, the loss of conductivity, a priori due to the volume occupation of the immobile polymer matrix is compensated in the PGPE by a 15% increase in Li+ conductivity (σtLi) vs. liquid electrolyte (i.e. 1.33 mS cm−1vs. 1.13 mS cm−1 at 20 °C).Conflicts of interest
The authors declare that they have no competing interests.Acknowledgements
Part of the research presented here conducted under BenchBatt project funded by the Federal Ministry of Education and Research (BMBF) (grant no. 03XP0047B).Notes and references
- L. Long, S. Wang, M. Xiao and Y. Meng, J. Mater. Chem. A, 2016, 4, 10038–10069 RSC.
- B. Oh, W. I. Jung, D.-W. Kim and H. W. Rhee, Bull. Korean Chem. Soc., 2002, 23, 683–687 CrossRef CAS.
- H.-D. Nguyen, G.-T. Kim, J. Shi, E. Paillard, P. Judeinstein, S. Lyonnard, D. Bresser and C. Iojoiu, Energy Environ. Sci., 2018, 11, 3298–3309 RSC.
- P. E. Stallworth, S. G. Greenbaum, F. Croce, S. Slane and M. Salomon, Electrochim. Acta, 1995, 40, 2137–2141 CrossRef CAS.
- F. Croce, S. D. Brown, S. G. Greenbaum, S. M. Slane and M. Salomon, Chem. Mater., 1993, 5, 1268–1272 CrossRef CAS.
- C. S. Kim and S. M. Oh, Electrochim. Acta, 2000, 45, 2101–2109 CrossRef CAS.
- J. Mindemark, M. J. Lacey, T. Bowden and D. Brandell, Prog. Polym. Sci., 2018, 81, 114–143 CrossRef CAS.
- O. Buriez, Y. B. Han, J. Hou, J. B. Kerr, J. Qiao, S. E. Sloop, M. Tian and S. Wang, J. Power Sources, 2000, 89, 149–155 CrossRef CAS.
- K. Kimura, J. Motomatsu and Y. Tominaga, J. Phys. Chem. C, 2016, 120, 12385–12391 CrossRef CAS.
- I. Y. EvchukR, I. Musii, R. G. Makitra and R. E. Pristanskii, Russ. J. Appl. Chem., 2005, 78, 1576–1580 CrossRef.
- D.-W. Kim, B.-K. Oh and Y.-M. Choi, Solid State Ionics, 1999, 123, 243–249 CrossRef CAS.
- A. Hosseinioun and E. Paillard, J. Membr. Sci., 2019 Search PubMed , under revision.
- L. Edman, J. Phys. Chem. B, 2000, 104, 7254–7258 CrossRef CAS.
- D. M. Seo, O. Borodin, S.-D. Han, P. D. Boyle and W. A. Henderson, J. Electrochem. Soc., 2012, 159, A1489–A1500 CrossRef CAS.
- N. A. Stolwijk, J. Kösters, M. Wiencierz and M. Schönhoff, Electrochim. Acta, 2013, 102, 451–458 CrossRef CAS.
- M. Kunze, Y. Karatas, H. D. Wiemhöfer and M. Schönhoff, Macromolecules, 2012, 45, 8328–8335 CrossRef CAS.
- M. Gouverneur, J. Kopp, L. van Wüllen and M. Schönhoff, Phys. Chem. Chem. Phys., 2015, 17, 30680–30686 RSC.
- F. Hallberg, I. Furó and P. Stilbs, J. Am. Chem. Soc., 2009, 131, 13900–13901 CrossRef CAS.
- M. Giesecke, G. Mériguet, F. Hallberg, Y. Fang, P. Stilbs and I. Furó, Phys. Chem. Chem. Phys., 2015, 17, 3402–3408 RSC.
- M. Brinkkötter, G. A. Giffin, A. Moretti, S. Jeong, S. Passerini and M. Schönhoff, Chem. Commun., 2018, 54, 4278–4281 RSC.
- M. Gouverneur, F. Schmidt and M. Schönhoff, Phys. Chem. Chem. Phys., 2018, 20, 7470–7478 RSC.
- M. Rosenwinkel and M. Schönhoff, J. Electrochem. Soc., 2019, 166(10), A1977–A1983 CrossRef CAS.
- O. Borodin, G. D. Smith and W. Henderson, J. Phys. Chem. B, 2006, 110, 16879–16886 CrossRef CAS.
- V. Lesch, Z. Li, D. Bedrov, O. Borodin and A. Heuer, Phys. Chem. Chem. Phys., 2016, 18, 382–392 RSC.
- K. Oldiges, D. Diddens, M. Ebrahiminia, J. B. Hooper, I. Cekic-Laskovic, A. Heuer, D. Bedrov, M. Winter and G. Brunklaus, Phys. Chem. Chem. Phys., 2018, 20, 16579–16591 RSC.
- N. Molinari, J. P. Mailoa and B. Kozinsky, Chem. Mater., 2018, 30, 6298–6306 CrossRef CAS.
- O. Borodin and G. D. Smith, Macromolecules, 2006, 39, 1620–1629 CrossRef CAS.
- D. Diddens, A. Heuer and O. Borodin, Macromolecules, 2010, 43, 2028–2036 CrossRef CAS.
- D. Diddens and A. Heuer, ACS Macro Lett., 2013, 2, 322–326 CrossRef CAS.
- D. Diddens, E. Paillard and A. Heuer, J. Electrochem. Soc., 2017, 164, E3225–E3231 CrossRef CAS.
- M. A. Webb, B. M. Savoie, Z.-G. Wang and T. F. Miller III, Macromolecules, 2015, 48, 7346–7358 CrossRef CAS.
- S. Mogurampelly, O. Borodin and V. Ganesan, Annu. Rev. Chem. Biomol. Eng., 2016, 7, 349–371 CrossRef.
- V. Sethuraman, S. Mogurampelly and V. Ganesan, Soft Matter, 2017, 13, 7793–7803 RSC.
- O. Borodin and G. D. Smith, J. Phys. Chem. B, 2006, 110, 6279–6292 CrossRef CAS.
- O. Borodin and G. D. Smith, J. Phys. Chem. B, 2006, 110, 6293–6299 CrossRef CAS PubMed.
- O. Borodin, J. Phys. Chem. B, 2009, 113, 11463–11478 CrossRef CAS.
- S. Jeschke, H.-D. Wiemhöfer and C. Mück-Lichtenfeld, Phys. Chem. Chem. Phys., 2014, 16, 14236–14243 RSC.
- O. Borodin, M. Olguin, P. Ganesh, P. R. C. Kent, J. L. Allen and W. A. Henderson, Phys. Chem. Chem. Phys., 2016, 18, 164–175 RSC.
- N. Chapman, O. Borodin, T. Yoon, C. C. Nguyen and B. L. Lucht, J. Phys. Chem. C, 2017, 121, 2135–2148 CrossRef CAS.
- G. Bieker, D. Diddens, M. Kolek, O. Borodin, M. Winter, P. Bieker and K. Jalkanen, J. Phys. Chem. C, 2018, 122, 21770–21783 CrossRef CAS.
- F. Schmidt, A. Pugliese, C. S. A. Mele and M. Schönhoff, 2019, manuscript in preparation.
- M. Frisch, G. Trucks, H. Schlegel, G. Scuseria, M. Robb, J. Cheeseman, G. Scalmani, V. Barone and G. Petersson, Gaussian 16, Wallingford CT, 2016 Search PubMed.
- L. A. Curtiss, P. C. Redfern and K. Raghavachari, J. Chem. Phys., 2007, 127, 124105 CrossRef PubMed.
- S. Grimme, S. Ehrlich and L. Goerigk, J. Comput. Chem., 2011, 32, 1456–1465 CrossRef CAS.
- A. V. Marenich, C. J. Cramer and D. G. Truhlar, J. Phys. Chem. B, 2009, 113, 6378–6396 CrossRef CAS.
- R. Bhandary and M. Schönhoff, Electrochim. Acta, 2015, 174, 753–761 CrossRef CAS.
- D. Battisti, G. A. Nazri, B. Klassen and R. Aroca, J. Phys. Chem., 1993, 97, 5826–5830 CrossRef CAS.
- D. W. McOwen, D. M. Seo, O. Borodin, J. Vatamanu, P. D. Boyle and W. A. Henderson, Energy Environ. Sci., 2014, 7, 416–426 RSC.
- K. Hayamizu, Y. Aihara, S. Arai and W. S. Price, Solid State Ionics, 1998, 107, 1–12 CrossRef CAS.
- A. Munar, A. Andrio, R. Iserte and V. Compañ, J. Non-Cryst. Solids, 2011, 357, 3064–3069 CrossRef CAS.
- C.-K. Lin and I. D. Wu, Polymer, 2011, 52, 4106–4113 CrossRef CAS.
- I. D. Wu and F.-C. Chang, Polymer, 2007, 48, 989–996 CrossRef CAS.
Footnote |
| † Electronic supplementary information (ESI) available. See DOI: 10.1039/c9ra05917b |
| This journal is © The Royal Society of Chemistry 2019 |

