
 Open Access Article
 This Open Access Article is licensed under a
 Creative Commons Attribution 3.0 Unported Licence
A rational synthesis of hierarchically porous, N-doped carbon from Mg-based MOFs: understanding the link between nitrogen content and oxygen reduction electrocatalysis†
David
Eisenberg
*a,
Wowa
Stroek
a,
Norbert J.
Geels
a,
Stefania
Tanase
a,
Marilena
Ferbinteanu
b,
Simon J.
Teat
c,
Pierre
Mettraux
d,
Ning
Yan
*a and
Gadi
Rothenberg
*a
aVan 't Hoff Institute for Molecular Sciences, University of Amsterdam, Science Park 904, 1098 XH, Amsterdam, The Netherlands. E-mail: d.eisenberg@uva.nl; n.yan@uva.nl; g.rothenberg@uva.nl; Tel: +31-20-5256963
bFaculty of Chemistry, Inorganic Chemistry Department, University of Bucharest, Dumbrava Rosie 23, Bucharest 020462, Romania
cAdvanced Light Source, Lawrence Berkeley National Laboratory, Berkeley, California 94720, USA
dTribology and Interface Chemistry Group, École Polytechnique Fédérale de Lausanne, Lausanne CH-1015, Switzerland
First published on 8th July 2016
Abstract
Controlled mixtures of novel Mg-based metal–organic frameworks (MOFs) were prepared, with H+ or K+ as counterions. A linear relation was found between synthesis pH and K/H ratio in the resultant mixture, establishing the tunability of the synthesis. Upon pyrolysis, these precursor mixtures yield nitrogen-doped, hierarchically porous carbons, which have good activity towards the oxygen reduction reaction (ORR) at pH 13. The nitrogen content varies significantly along the homologous carbon series (>400%, 1.3 at% to 5.7 at%), to a much greater extent than microstructural parameters such as surface area and graphitization. This allows us to isolate the positive correlation between nitrogen content and electrocatalytic oxygen reduction ORR activity in this class of metal-free, N-doped, porous carbons.
Introduction
Advanced fuel cells and metal–air batteries have the potential for changing our energy economy.1–3 The main scientific hurdle for their implementation is efficient electrocatalysis of the oxygen reduction reaction (ORR). Platinum is the best commercial ORR electrocatalyst, but there is simply not enough of it on Earth for large-scale application.4–7 Among the possible alternatives, N-doped carbons stand out, as they are cheap, scalable, and can compete with Pt in ORR electrocatalysis under alkaline conditions.8–24 Yet progress depends on understanding this complex multielectron/multiproton catalytic reaction. Indeed, the chemical and physical material properties governing ORR electrocatalysis are not fully understood even for platinum, despite almost 180 years of fuel cell research.6,7N-Doped carbons are much less ordered than metals, and the range of physico-chemical properties defining their electrocatalytic performance is even broader. These include the nature of active sites (at or near N atoms); the specific surface area (which controls active site exposure); the pore structure, which affects mass transport of reagents and products; and the degree of graphitization, which determines the electron conduction between the active site and the external circuit.9,10 Nitrogen doping is considered central among ORR-determining carbon properties, and major research efforts are focused on controlling doping concentration and distribution of nitrogen types.11–20 A literature survey of 3D carbons (excluding model/2D systems such as graphene and carbon nanotubes), doped only with nitrogen (excluding various metal-doped and biomass-derived carbons, and carbon nitride) reveals that onset potentials for alkaline ORR span as much as ∼300 mV when N content ranges between 1–10 at% (Fig. 1).11–20 Thus, the quality of these studies notwithstanding, a direct correlation between nitrogen content and alkaline ORR activity (as expressed in onset potential) is hard to pinpoint. Such a dispersion of activities arises mostly from the significant structural variations which accompany changes in N content in each carbon. For example, the N content is typically varied by changing the pyrolysis temperature, since heating accelerates denitrogenation. However, structural properties such as surface area, porosity and graphitization also change dramatically with pyrolysis temperature.8–10,25 Moreover, N doping may give rise to various effects on a given catalyst. Thus, direct correlations between doping concentrations were only demonstrated so far when the nitrogen was introduced post-synthesis, such as in acetonitrile-plasma-treated Vulcan carbon, studied for acidic ORR catalysis,26 or NH3-treated carbons of lower dimensionalities (nanotubes27,28 and graphene29,30). Overall, to understand structure–activity relationships and ultimately design better materials and devices, we need a truly rational synthesis of metal-free, N-doped carbons – one that allows the tailoring of specific parameters while keeping others (roughly) constant.
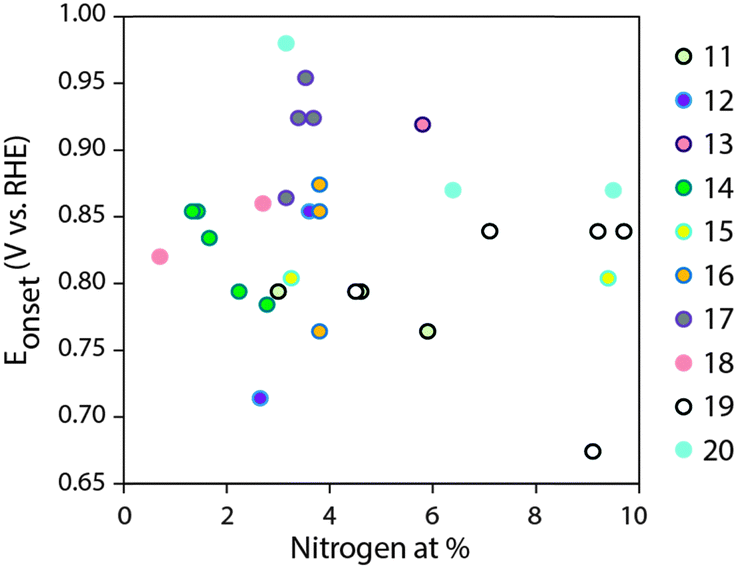 | ||
| Fig. 1 Literature summary of ORR onset potentials in 0.1 M KOH vs. total N content (from XPS), for 3D, N-doped carbons. References in the legend.11–20 | ||
Metal–organic frameworks (MOFs) are an emerging class of carbon precursors.31–38 Upon pyrolysis, the organic ligands serve as a source for carbon and nitrogen, whereas the metal ions affect graphitization, porosity-templating and metal–nitrogen active sites. The well-defined structure and composition of MOFs holds a promise for rational synthesis of carbons, in contrast to carbon syntheses based on biomass precursors. MOF carbon precursors are typically based on metals such as Fe, Co, Zn and Al.31–36 Interestingly, magnesium is rarely studied in this context,37,38 even though Mg-based MOFs hold particular promise for ORR studies on metal-free carbons. This is because magnesium compounds are inactive in ORR,19 and do not bias the catalytic trends (unlike traces of Fe or Co).39,40 Thus, Mg-MOF-derived carbons are truly ‘metal-free’ in the strict definition of Muhler, Schuhmann et al.40 Furthermore, to the best of our knowledge, potassium counterions were never used in well-defined MOF carbon precursors. Like zinc, potassium can etch the carbon matrix, giving more control over the nitrogen content. Thus, using Mg2+ and K+ ions broadens the scope of precursor structures and can improve the control over carbon properties.
Recently, we reported a N-doped carbon with excellent electrocatalytic activity in alkaline ORR, owing to its high nitrogen content, hierarchical pores, and graphitic network.24 Building on this discovery, we report here the synthesis of a family of tailor-made carbons with highly tunable properties. Importantly, the protocol allows for changing the nitrogen content to a greater extent than other parameters such as surface area and degree of graphitization. As we will show here, this tunable nitrogen has a unique correlation with alkaline ORR activity, for the first time directly observed among N-doped, metal-free, 3D carbon electrocatalysts.
Results and discussion
The precursor synthesis involves reacting MgCO3 with nitrilotriacetic acid (H3NTA) at different pH values (Fig. 2). Here the pH is controlled simply by addition of potassium carbonate. Precursors isolated at low (3.7) and high (6.1) pH values have porous MOF structures, as determined from single crystal X-ray diffraction measurements. Both structures are made of Mg2+ nodes and nitrilotriacetate (NTA) linkers. In the precursor isolated at low pH, [MgNH(CH2COO)3(H2O)3]·C2H5OH (herein “HMgNTA”), the protonated quaternary amine of the ligand binds through carboxylate groups to three different Mg2+ ions. Each Mg2+ is surrounded by three oxygens from three different HNTA2− ligands and three water molecules (Fig. 2b). The structure has well-defined porous channels which are occupied by ethanol molecules. These pores may be used in the future for loading additional carbon sources.18 Conversely, in the precursor isolated at high pH, [KMgN(CH2COO)3·(H2O)2]·H2O (herein “KMgNTA”), the ligand is fully deprotonated. It is heptacoordinated to two Mg2+ ions and five K+ ions. This gives a three-dimensional structure (Fig. 2c) with smaller pores that are occupied by water molecules.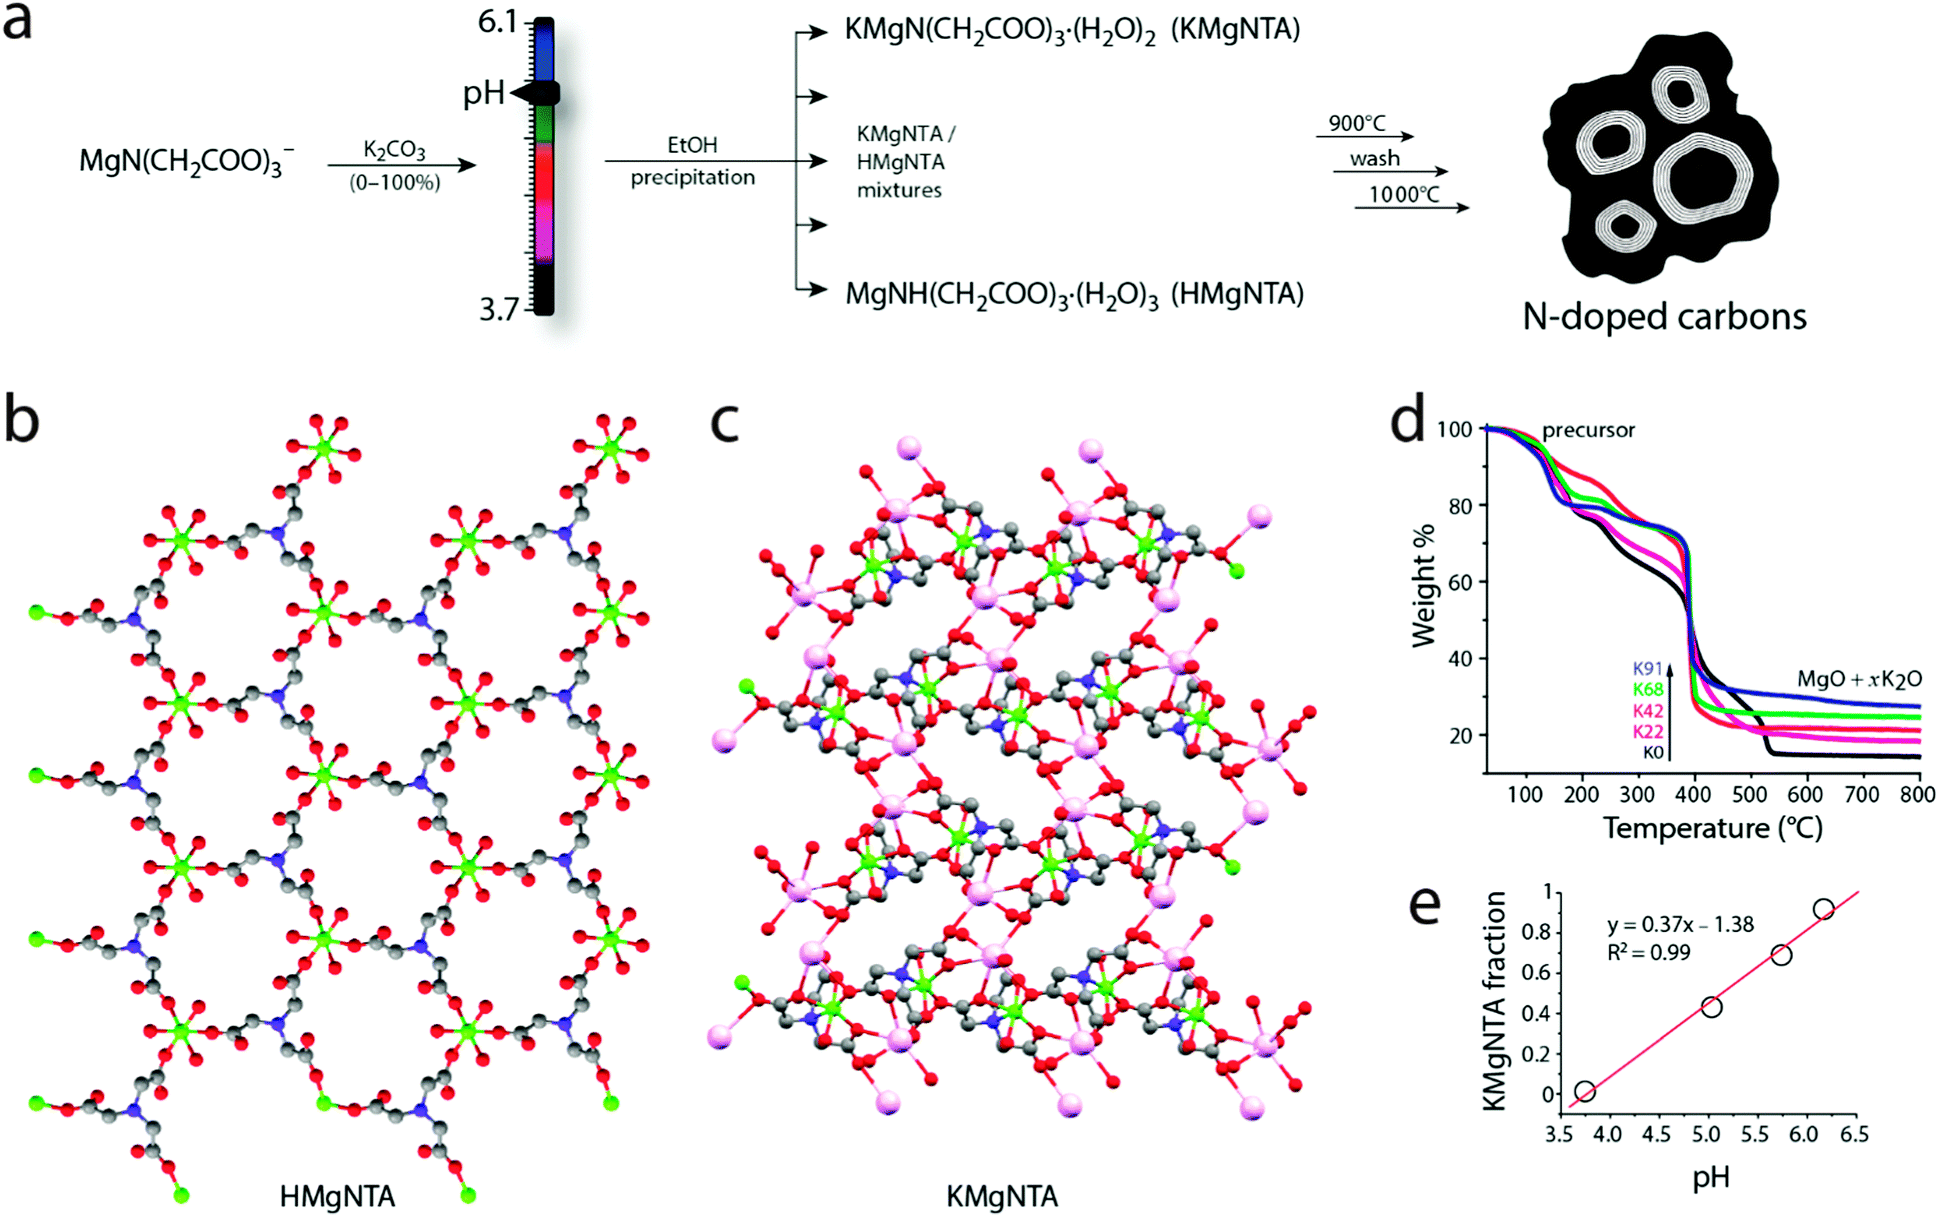 | ||
| Fig. 2 (a) Synthesis of N-doped carbons from rationally designed MOF precursors, where neutralizing the magnesium nitrilotriacetate solution with potassium carbonate determines the precursor K/H ratio (each precursor is a mixture of two Mg-based MOFs). (b) 3D packing of HMgNTA and (c) KMgNTA. Solvent molecules were removed from the pore channels for clarity (ethanol in HMgNTA, water in KMgNTA). Atoms of K, Mg and N are marked in pink, green and blue, respectively. (d) Thermal gravimetric analysis of the precursors. (e) Relationship between KMgNTA fraction in the precursor and synthesis pH. | ||
Homogeneous mixtures of the two MOFs can be precipitated with a high degree of precision simply by varying the synthesis pH (Fig. 2a). The relative fractions of HMgNTA and KMgNTA in the powder were determined by thermal gravimetric analysis in air (TGA, Fig. 2d). A perfectly linear relation was found between pH of the magnesium nitrilotriacetate solution (reflecting its [K+]/[H+] ratio), and the fraction of KMgNTA in the final powder (Fig. 2e). This is therefore a simple recipe for synthesizing the desired MOF mixture by tweaking the solution to the right pH (eqn (1)).
| pH = (desired KMgNTA fraction + 1.38)/0.37 | (1) |
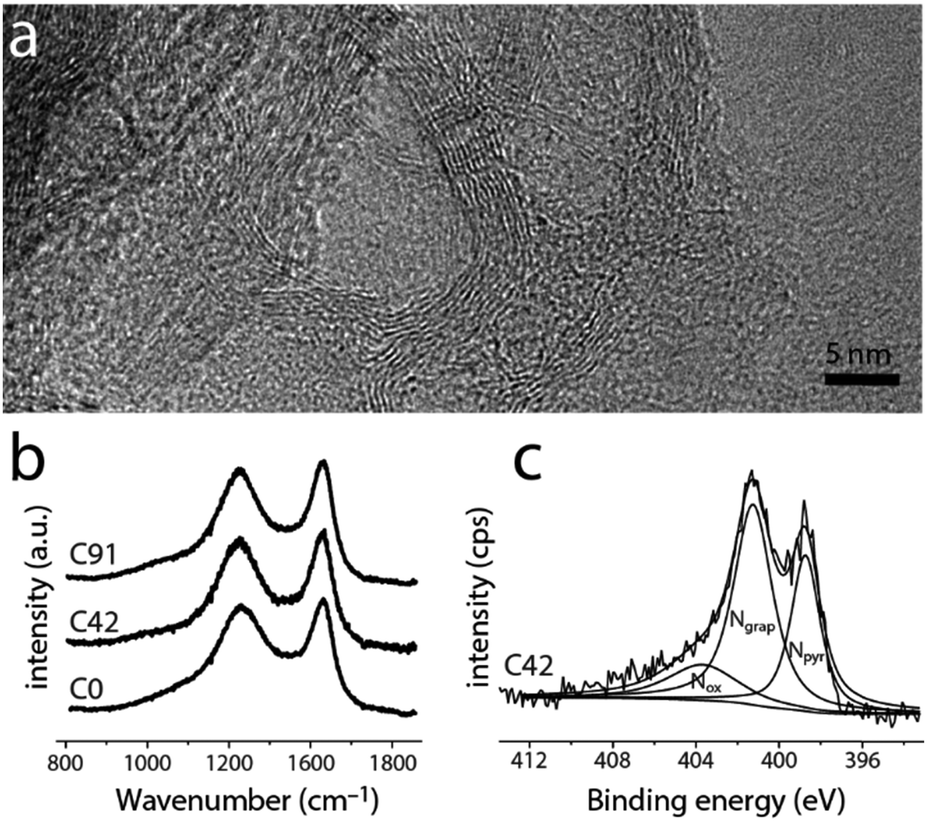 | ||
| Fig. 3 (a) High-resolution transmission electron micrograph of C0, showing graphitic shells. (b) Raman spectra of representative carbons. (c) X-ray photoelectron spectra in the N1s region, fitted with pyridinic, graphitic, and oxidized nitrogen functionalities. | ||
Although the materials' microstructure clusters within a relatively narrow range (vide infra), the nitrogen content and distribution vary widely along the series (Fig. 3 and 4). As determined by X-ray photoelectron spectroscopy (XPS, Fig. 3c and Fig. S7, ESI†), the near-surface nitrogen content decreases with precursor K/H ratio, from 5.7 at% to 1.3 at% (over 400%). Initially, the graphitic/pyridinic nitrogen ratio stays constant (Fig. 4a, inset), allowing the tuning of the total N content without changing the distribution of functionalities. For C42, C68 and C91, increasing the KMgNTA content leads to faster depletion of pyridinic nitrogens over graphitic ones. This may reflect the preferential etching of pyridinic nitrogens by potassium vapours. Thus, by varying the precursor K/H ratio we can control the N content (and somewhat, distribution) in the carbon.
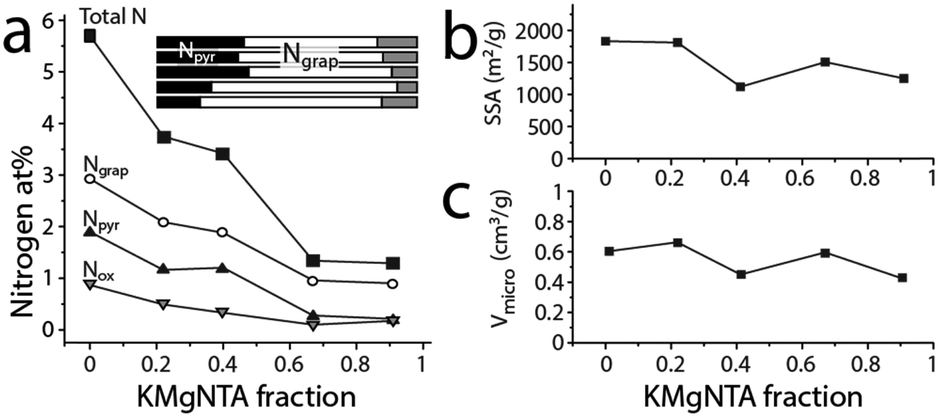 | ||
| Fig. 4 Microstructure and composition along the carbon series. (a) Content and distribution of surface nitrogen from XPS, along the carbon series. Inset shows distribution of nitrogens between pyridinic (black), graphitic (white) and oxidized (grey) in carbons C0 to C91 (top to bottom). (b) Specific (BET) surface area and (c) micropore volume, along the carbon series, derived from N2 adsorption at 77 K. | ||
Importantly, the changes to the carbon microstructure are distributed within a narrower relative range. All the carbons along the series have high specific surface areas, within 1500 ± 325 m2 g−1 (BET, Fig. 4b). Similarly, their micropore volumes are clustered around 0.55 ± 0.11 cm3 g−1 (Fig. 4c). Increasing the potassium content does not boost micropore volume, even though potassium salts are known activation agents.42 This is due to the lower K content compared to common activation procedures (estimated KOH/precursor ratio <0.24, compared to 1–5 in the literature).42 According to N2 adsorption data (Fig. S3, ESI†), all these carbons also contain mesopores, contributing to the efficient mass transport of reagents and products through the porous structure during electrocatalysis. These observations are corroborated by transmission electron microscopy of both of the “extreme” carbons C0 and C91 (TEM, Fig. 3a and Fig. S4, ESI†), showing an interpenetrating network of worm-like micropores as well as mesopores lined with graphitic shells.43–45 The narrow distribution of Raman signal intensity ratios for the (non-fitted) graphitic and disordered bands (ID/IG = 0.96 ± 0.03, Fig. 3b and Fig. S5, ESI†) indicates similar degrees of graphitization between the carbons. So does the narrow distribution of internal resistances of the carbons as measured by electrochemical impedance spectroscopy (Fig. S6, ESI†), supporting the structural similarity along the series.
We then used this homologous series of carbons, in which nitrogen content is tunable yet microstructure varies within narrower ranges, as a test case for studying structure–activity relationships in ORR electrocatalysis. Indeed, carbons from precursors with low to medium content of KMgNTA (C0, C22, C42) are good ORR electrocatalysts in 0.1 M KOH. Their onset potentials approach those of commercial 20 wt% Pt/C electrodes (Fig. 5a), with electron transfer numbers of 3.6 and 3.9 mol e− per mol O2 (C22 and C0, respectively; Fig. 6). As the precursor K/H ratio increased (carbons C68, C91), the oxygen reduction activity decreased significantly. Onset and half-wave potentials became more negative (Fig. 5b), and the electron transfer numbers dropped to 3 and below. Limiting currents on carbon C42 are somewhat lower than expected, which may be related to its lower surface area – a secondary, but not negligible factor. Similar activity trends are observed in an acidic electrolyte (0.5 M H2SO4, Fig. S8–S11, ESI†).
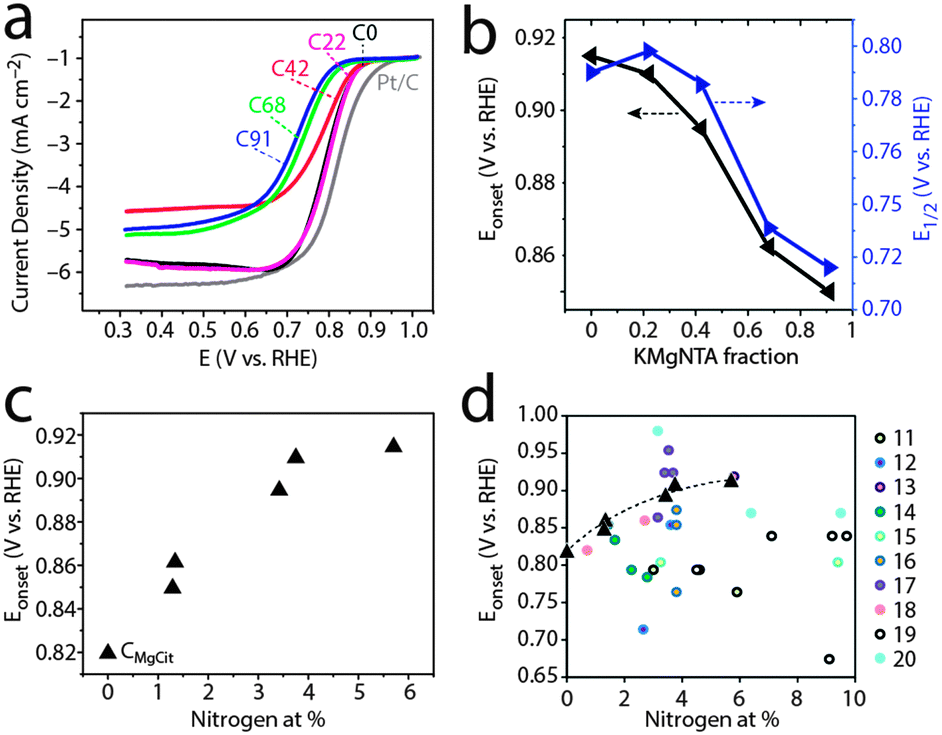 | ||
| Fig. 5 Oxygen reduction activity in base (0.1 M KOH, pH 13). (a) Linear scan voltammetry, 10 mV s−1, 1600 rpm, O2-saturated solution. (b) Onset and half-wave potentials for ORR. (c) Onset potentials vs. total N content (at%). (d) Onset potentials from this study (triangles) plotted on literature data;11–20 see Fig. 1 caption for details. | ||
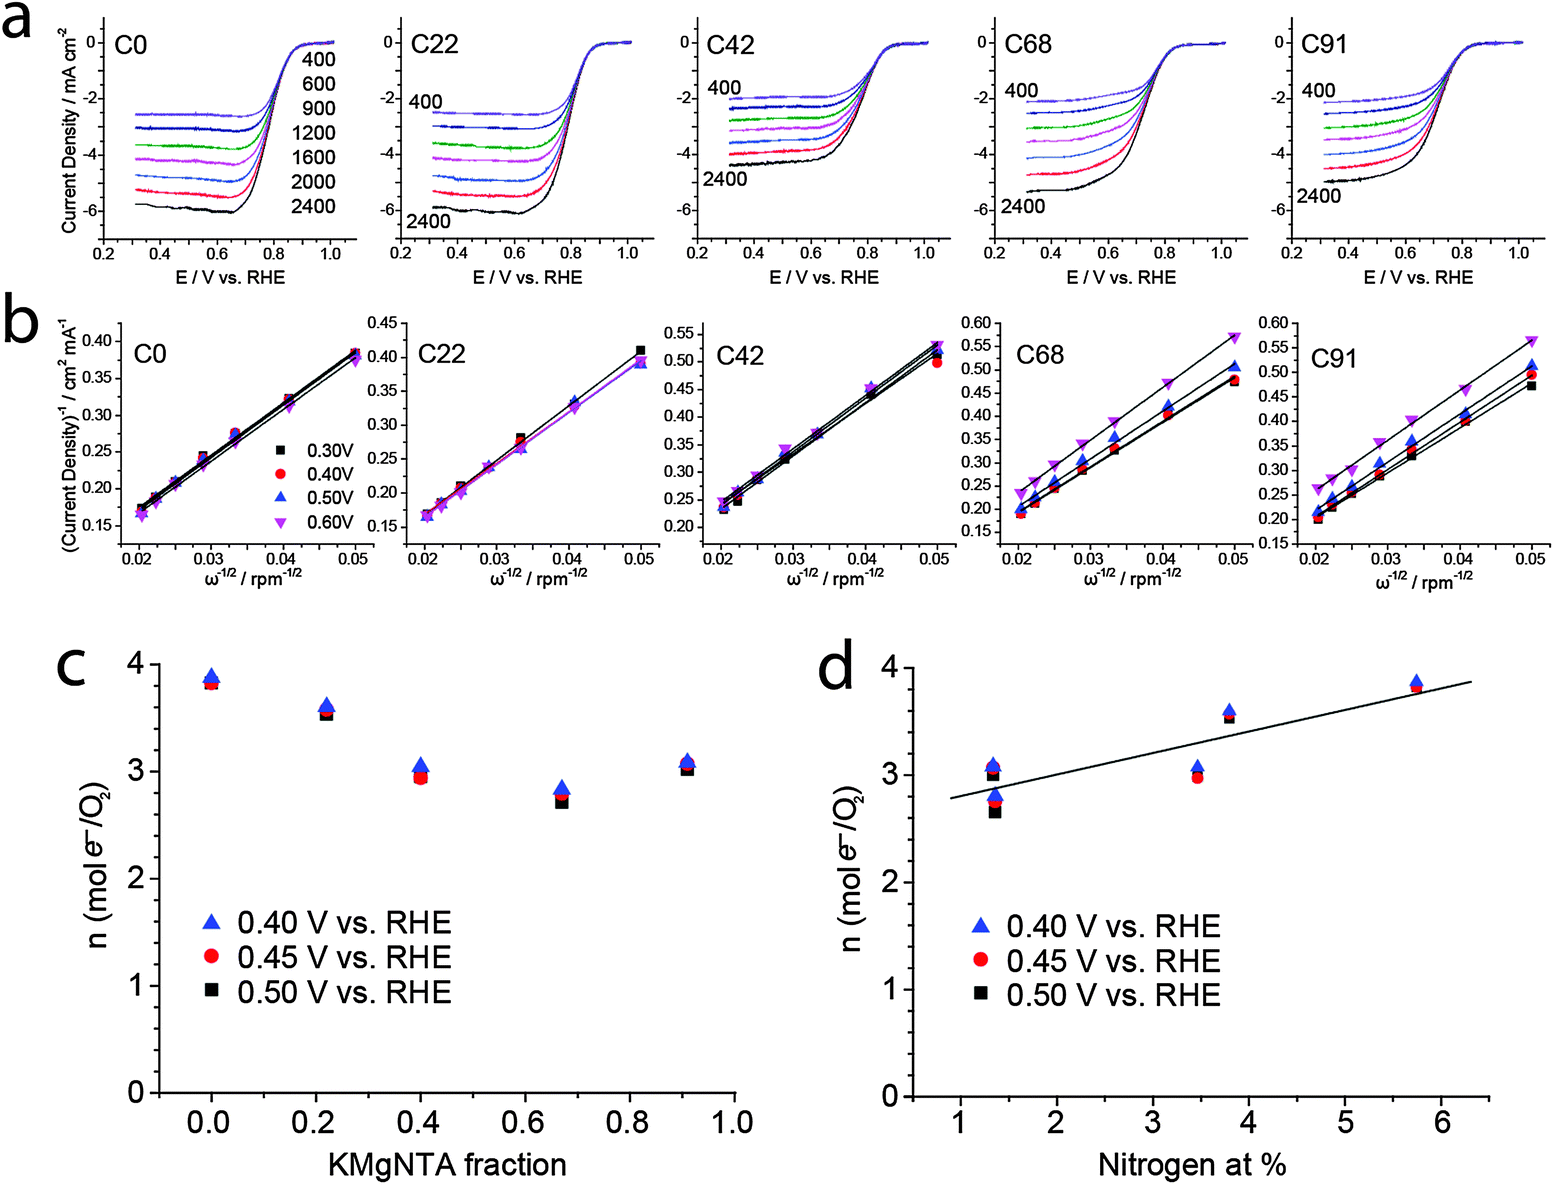 | ||
| Fig. 6 Rotating disk electrode (RDE) studies of ORR electrocatalysis in 0.1 M KOH along the carbon series. (a) LSVs at different rotation speeds in rpm, 10 mV s−1. (b) Koutecký–Levich plots. Number of electrons transferred per mol O2 along the carbon series, as calculated from the Koutecký–Levich plots, vs. (c) KMgNTA fraction and (d) nitrogen content; the straight line is a least squares fit. | ||
Can the activity variations be assigned to changes in catalyst structure and/or composition? No simple trend is observed when plotting activity descriptors (onset or half-wave potentials) versus structural parameters, such as specific surface area or Raman ID/IG ratio (Fig. S11, ESI†). But the activity is clearly correlated with nitrogen content (Fig. 5c): ORR onset potentials shift positively (improved activity) with nitrogen concentration. Control experiments using a “zero-nitrogen” carbon with a similar microstructure (CMgCit, made from Mg-citrate),24,25 fit nicely to this trend. Interestingly, the alkaline ORR activity is not impaired by the 35–40% drop in nitrogen content from C0 to C22, indicating some form of saturation in ORR activity above 3 at% nitrogen. This suggests that another parameter, other than active site density, becomes rate-determining (e.g. mass transport in the pores). Overall, the data points from this work may be connected with a trend line when plotted on top of literature data (Fig. 5d), as they come closer than ever in revealing the positive correlation between alkaline ORR activity and total N content in this class of carbons (Table 1).
HMgNTA![[thin space (1/6-em)]](https://www.rsc.org/images/entities/char_2009.gif) :KMgNTA fractions :KMgNTA fractions |
N total | N pyr | N grap | N ox | Onset potentialb | Half-wave potential | 1 mA cm−2 potentialc | |
|---|---|---|---|---|---|---|---|---|
| a Potentials in V vs. RHE, N content in at%. b At a faradaic current of 50 μA cm−2. c For faradaic current at a rotation speed of 1600 rpm. | ||||||||
| C0 | 100:0 |
5.70 | 1.90 | 2.93 | 0.87 | 0.915 | 0.790 | 0.831 |
| C22 | 78:22 |
3.75 | 1.16 | 2.09 | 0.49 | 0.910 | 0.798 | 0.833 |
| C42 | 58:42 |
3.42 | 1.20 | 1.88 | 0.33 | 0.895 | 0.786 | 0.814 |
| C68 | 32:68 |
1.34 | 0.28 | 0.96 | 0.10 | 0.862 | 0.731 | 0.771 |
| C91 | 9:91 |
1.29 | 0.21 | 0.90 | 0.18 | 0.850 | 0.716 | 0.757 |
| Cundoped | — | — | — | — | — | 0.820 | 0.705 | 0.732 |
The nature of ORR activity dependence on N content is a matter of debate in the literature, as nitrogen doping may have several effects on ORR catalysis.6–10,40 The effects may be catalytic (active sites for O2 adsorption, H2O2 desorption or disproportionation), chemical (improved wetting and adsorption), electronic (n-type doping leading to negative Fermi level shift and increased conductivity) and structural (increasing disorder). However, most of these factors are expected to contribute to a positive correlation, at least at low (<10 at%) nitrogen concentrations. Whether the nitrogens serve as active sites, improve wetting or shift the Fermi level negatively, ORR activity should improve with nitrogen content. Why is this correlation so hard to observe, then, with several investigations (Fig. 1)11,14,17,20 pointing to the opposite? True, the ORR activity is also linked with the type of nitrogen functionality (graphitic, pyridinic, pyrrolic, etc.), which may differ between the carbons, and not be directly proportional to total N content. The matter is further complicated by the fact that the relative merits of the different functionalities are still not fully understood.6–10,23,46–49 However, clearly nitrogen doping is not enough – the nitrogen atoms also need to be exposed to solution, if their presence is to be felt. Thus, the most important microstructural parameter may be specific surface area – also closely correlated with micropore volume – which determines the solution exposure of active sites. Other microstructural properties, such as mesopore and macropore volume (assisting in mass transport) and graphitization (linked with conductivity), are expected to contribute to current densities, yet not necessarily to onset potentials (Fig. 5) or n values (Fig. 6), which better reflect the inherent catalytic activity of active sites. Thus, the nitrogen content is an important yet insufficient descriptor of ORR electrocatalytic activity for N-doped carbons.
Conclusions
In summary, we prepared a homologous series of nitrogen-doped, hierarchically porous carbons from mixtures of Mg-based MOFs. The synthesis is truly rational, since tuning the solution pH varies the ratio of HMgNTA/KMgNTA precursors linearly. Moreover, the series of precursors yields a homologous series of carbons, in which nitrogen content varies to a large extent. This, in turn, allows for the first direct observation (to the best of our knowledge) of a clear positive correlation between nitrogen content and alkaline ORR activity.Acknowledgements
We thank Dr P. Prinsen and Dr N. Klein for valuable discussions, Prof. N. Setter, Dr C. S. Sandu, Dr S. Mischler and the CIME-EPFL team for TEM and XPS measurements, and Dr B. Hua and Prof. J. L. Luo (University of Alberta) for Raman measurements. The Advanced Light Source is supported by the Director, Office of Science, Office of Basic Energy Sciences, of the U.S. Department of Energy under Contract No. DE-AC02-05CH11231. This work is part of the Research Priority Area Sustainable Chemistry of the UvA, http://suschem.uva.nl.Notes and references
- Handbook of Fuel Cells, ed. W. Vielstich, A. Lamm and H. A. Gasteiger, John Wiley & Sons, 2003, vol. 2 Search PubMed.
- F. Cheng and J. Chen, Chem. Soc. Rev., 2012, 41, 2172–2192 RSC.
- Y. Nie, L. Li and Z. Wei, Chem. Soc. Rev., 2015, 44, 2168–2201 RSC.
- F. Jaouen, J. Herranz, M. Lefèvre, J.-P. Dodelet, U. I. Kramm, I. Herrmann, P. Bogdanoff, J. Maruyama, T. Nagaoka, A. Garsuch, J. R. Dahn, T. Olson, S. Pylypenko, P. Atanassov and E. A. Ustinov, ACS Appl. Mater. Interfaces, 2009, 1, 1623–1639 CAS.
- M. K. Debe, Nature, 2012, 486, 43–51 CrossRef CAS PubMed.
- Q. He and E. J. Cairns, J. Electrochem. Soc., 2015, 162, F1504–F1539 CrossRef CAS.
- M. Shao, Q. Chang, J.-P. Dodelet and R. Chenitz, Chem. Rev., 2016, 116, 3594–3657 CrossRef CAS PubMed.
- Z. Yang, H. Nie, X. Chen, X. Chen and S. Huang, J. Power Sources, 2013, 236, 238–249 CrossRef CAS.
- N. Daems, X. Sheng, I. F. J. Vankelecom and P. P. Pescarmona, J. Mater. Chem. A, 2014, 2, 4085–4110 CAS.
- L. Dai, Y. Xue, L. Qu, H.-J. Choi and J.-B. Baek, Chem. Rev., 2015, 115, 4823–4892 CrossRef CAS PubMed.
- W. He, C. Jiang, J. Wang and L. Lu, Angew. Chem., Int. Ed., 2014, 53, 9503–9507 CrossRef CAS PubMed.
- X. Wang, J. S. Lee, Q. Zhu, J. Liu, Y. Wang and S. Dai, Chem. Mater., 2010, 22, 2178–2180 CrossRef CAS.
- D. Yu, L. Wei, W. Jiang, H. Wang, B. Sun, Q. Zhang, K. Goh, R. Si and Y. Chen, Nanoscale, 2013, 5, 3457 RSC.
- G. Panomsuwan, N. Saito and T. Ishizaki, Phys. Chem. Chem. Phys., 2015, 17, 6227–6232 RSC.
- X. Meng, H. Cui, J. Dong, J. Zheng, Y. Zhu, Z. Wang, J. Zhang, S. Jia, J. Zhao and Z. Zhu, J. Mater. Chem. A, 2013, 1, 9469–9476 CAS.
- R. Liu, D. Wu, X. Feng and K. Müllen, Angew. Chem., Int. Ed., 2010, 49, 2565–2569 CrossRef CAS PubMed.
- W. Wei, H. Liang, K. Parvez, X. Zhuang, X. Feng and K. Müllen, Angew. Chem., Int. Ed., 2014, 53, 1570–1574 CrossRef CAS PubMed.
- A. Aijaz, N. Fujiwara and Q. Xu, J. Am. Chem. Soc., 2014, 136, 6790–6793 CrossRef CAS PubMed.
- S. Chen, J. Bi, Y. Zhao, L. Yang, C. Zhang, Y. Ma, Q. Wu, X. Wang and Z. Hu, Adv. Mater., 2012, 24, 5593–5597 CrossRef CAS PubMed.
- G. Nam, J. Park, S. T. Kim, D. Shin, N. Park, Y. Kim, J.-S. Lee and J. Cho, Nano Lett., 2014, 14, 1870–1876 CrossRef CAS PubMed.
- H.-W. Liang, X. Zhuang, S. Brüller, X. Feng and K. Müllen, Nat. Commun., 2014, 5, 4973 CrossRef CAS PubMed.
- Z. Xu, X. Zhuang, C. Yang, J. Cao, Z. Yao, Y. Tang, J. Jiang, D. Wu and X. Feng, Adv. Mater., 2016, 28, 1981–1987 CrossRef CAS PubMed.
- D. Guo, R. Shibuya, C. Akiba, S. Saji, T. Kondo and J. Nakamura, Science, 2016, 351, 361–365 CrossRef CAS PubMed.
- D. Eisenberg, W. Stroek, N. J. Geels, C. S. Sandu, A. Heller, N. Yan and G. Rothenberg, Chem. – Eur. J., 2016, 22, 501–505 CrossRef CAS PubMed.
- M. Inagaki, H. Orikasa and T. Morishita, RSC Adv., 2011, 1, 1620–1640 RSC.
- P. Matter, L. Zhang and U. Ozkan, J. Catal., 2006, 239, 83–96 CrossRef CAS.
- S. Maldonado and K. J. Stevenson, J. Phys. Chem. B, 2005, 109, 4707–4716 CrossRef CAS PubMed.
- S. Maldonado, S. Morin and K. J. Stevenson, Carbon, 2006, 44, 1429–1437 CrossRef CAS.
- Z. Luo, S. Lim, Z. Tian, J. Shang, L. Lai, B. MacDonald, C. Fu, Z. Shen, T. Yu and J. Lin, J. Mater. Chem., 2011, 21, 8038–8044 RSC.
- Y. Zhang, J. Ge, L. Wang, D. Wang, F. Ding, X. Tao and W. Chen, Sci. Rep., 2013, 3, 2771 Search PubMed.
- W. Chaikittisilp, K. Ariga and Y. Yamauchi, J. Mater. Chem. A, 2013, 1, 14–19 CAS.
- X. Wang, J. Zhou, H. Fu, W. Li, X. Fan, G. Xin, J. Zheng and X. Li, J. Mater. Chem. A, 2014, 2, 14064 CAS.
- W. Xia, A. Mahmood, R. Zou and Q. Xu, Energy Environ. Sci., 2015, 8, 1837–1866 CAS.
- B. Liu, H. Shioyama, T. Akita and Q. Xu, J. Am. Chem. Soc., 2008, 130, 5390–5391 CrossRef CAS PubMed.
- Y.-Z. Chen, C. Wang, Z.-Y. Wu, Y. Xiong, Q. Xu, S.-H. Yu and H.-L. Jiang, Adv. Mater., 2015, 27, 5010–5016 CrossRef CAS PubMed.
- A. Aijaz, J. Masa, C. Rösler, W. Xia, P. Weide, A. J. R. Botz, R. A. Fischer, W. Schuhmann and M. Muhler, Angew. Chem., Int. Ed., 2016, 55, 4087–4091 CrossRef CAS PubMed.
- R. Das, P. Pachfule, R. Banerjee and P. Poddar, Nanoscale, 2012, 4, 591–599 RSC.
- Z.-F. Wu, B. Tan, C.-F. Du, M.-L. Feng, Z.-L. Xie and X.-Y. Huang, CrystEngComm, 2015, 17, 4288–4292 RSC.
- J. Masa, A. Zhao, W. Xia, M. Muhler and W. Schuhmann, Electrochim. Acta, 2014, 128, 271–278 CrossRef CAS.
- J. Masa, W. Xia, M. Muhler and W. Schuhmann, Angew. Chem., Int. Ed., 2015, 54, 10102–10120 CrossRef CAS PubMed.
- T. Morishita, Y. Soneda, T. Tsumura and M. Inagaki, Carbon, 2006, 44, 2360–2367 CrossRef CAS.
- T. S. Hui and M. A. A. Zaini, Carbon Lett., 2015, 16, 275–280 CrossRef.
- L. Shi, H. Lin, K. Bao, J. Cao and Y. Qian, Nanoscale Res. Lett., 2010, 5, 20–24 CrossRef CAS PubMed.
- G. Yang, H. Han, T. Li and C. Du, Carbon, 2012, 50, 3753–3765 CrossRef CAS.
- M. H. Rümmeli, A. Bachmatiuk, A. Scott, F. Börrnert, J. H. Warner, V. Hoffman, J.-H. Lin, G. Cuniberti and B. Büchner, ACS Nano, 2010, 4, 4206–4210 CrossRef PubMed.
- Y. Zhu, C. Su, X. Xu, W. Zhou, R. Ran and Z. Shao, Chem. – Eur. J., 2014, 20, 15533–15542 CrossRef CAS PubMed.
- R. Zhou and S. Z. Qiao, Chem. Commun., 2015, 51, 7516–7519 RSC.
- T. K. Slot, D. Eisenberg, D. van Noordenne, P. Jungbacker and G. Rothenberg, Chem. – Eur. J., 2016 DOI:10.1002/chem.201602964.
- H. Kiuchi, T. Kondo, M. Sakurai, D. Guo, J. Nakamura, H. Niwa, J. Miyawaki, M. Kawai, M. Oshima and Y. Harada, Phys. Chem. Chem. Phys., 2016, 18, 458–465 RSC.
Footnote |
| † Electronic supplementary information (ESI) available: Full experimental details and analytical data. CCDC 1470252 and 1470491. For ESI and crystallographic data in CIF or other electronic format see DOI: 10.1039/c6cp04132a |
| This journal is © the Owner Societies 2016 |