AMC Datasets—a resource for analytical scientists
Analytical Methods Committee, AMCTB No. 72
First published on 5th February 2016
Abstract
Have you noticed, when downloading a Technical Brief from the AMC's web pages (www.rsc.org/amc), that there is a section called AMC Datasets listed in the leftmost column? This content was inaugurated some years ago to provide a permanent collection of interesting datasets related to analytical chemistry and its applications. The basic idea was to provide analytical chemists with material that could be used to support teaching, learning and research in statistics and chemometrics. New ideas in these fields could be tested on real and well-characterised datasets, and compared with results of other workers.
The datasets were collected from a range of activities in chemical measurement, from simple calibrations and method comparisons, through homogeneity tests, to datasets that had been used for pattern recognition or multivariate calibration. Teachers could use these as examples to demonstrate possible approaches to analysing the data, and leave a commentary on the behaviour of various mathematical approaches for future reference. Students trying an unfamiliar statistics package or an alternative statistical procedure could compare their outcome with existing commentaries from (hopefully) authoritative sources. Some interesting examples are featured below.
Calibration for aflatoxin M1 (Dataset No. 1)
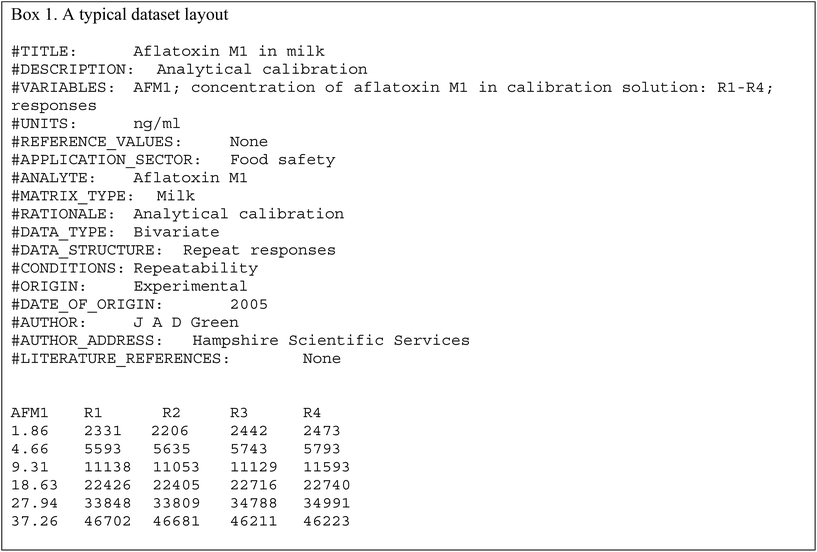
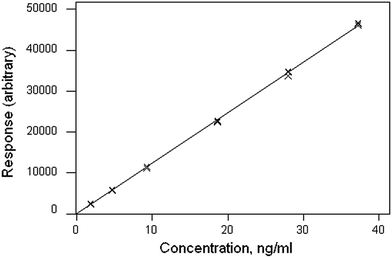
The data file is shown in Box 1. (All data files show the same style of background information.) In this instance there are four repeat observations of response at each of six concentrations of the analyte. The object of such an elaborate design would be to test the calibration for curvature. The calibration plot (Fig. 1) shows no visible sign of either non-zero intercept or deviation from a straight line. The correlation coefficient is 0.9997. However, the repeat responses at each concentration provide scope for using the pure error test for linearity.Weighted linear regression showed an intercept not significantly different from zero, but the pure error test gave a significant result (p < 0.001). Coupled with the clear pattern in the plot of the scaled residuals (Fig. 2), this comprises evidence for a distinct curvature in the true calibration function. Whether this slight curvature would affect decisions based on subsequent analytical results would depend on the application, but any effects would probably be negligible except at very low concentrations. (Also: there is an indication of systematic differences among the four response sets, possibly caused by drift during measurement.)
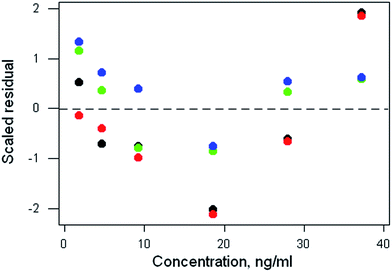 | ||
| Fig. 2 Aflatoxin M1 calibration: plot of scaled residuals, colour-coded by response set, after weighted linear regression. | ||
Proficiency test results: poly-unsaturated fatty acids (PUFA) in a cooking oil (Dataset No. 22)
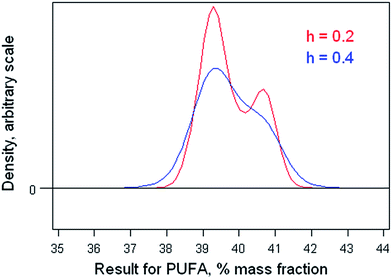
The dataset comprises results obtained by 42 participant laboratories. The statistical procedure illustrates testing the suspicion that the distribution is bimodal, as suggested by a dotplot (Fig. 3). The method involves kernel density estimation, that is, smoothing the density of the data along the measurement axis by plausible degrees and noting the formation of modes and shoulders. (This is a type of one-dimensional unsupervised pattern recognition.)Fig. 4 shows the outcome with smoothing parameters of 0.2 and 0.4. These values are set somewhat smaller than the reproducibility standard deviations expected (0.6) and found (0.8, robust) for this analysis, so as to detect signs of multi-modality but smooth over most chance outcomes. Both graphs show visual signs of bimodality. Unfortunately, it is not possible by statistics to attach a probability to the inference of bimodality. In this instance, however, there was strong supporting evidence that two different calibration strategies (one incorrect) had been used among the participant laboratories. One involved using an internal standard, the other simply normalising the total areas under the peaks for the various fatty acids in the chromatogram. The ratio of the modal values found in the kernel density was very close to that expected from a consideration of the two calibration strategies.
“Homogeneity test” on a rock powder (Dataset No. 16)
Ten of the approximately 200 bottles of the material were selected at random and duplicate fused discs prepared from each bottle. Each disc was measured twice by XRF and the duplicated results recorded. In this instance the duplicated results were averaged, reducing the repeatability variance. The 10 pairs of results for MgO are shown in Fig. 5. There is no apparent sign of outliers or systematic effects (or indeed of heterogeneity), so simple one-way analysis of variance (ANOVA) was applied. That is a common layout for such a test in proficiency testing and is at the limit of affordability.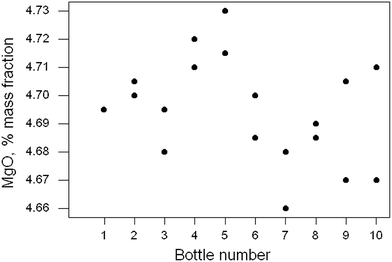 | ||
| Fig. 5 Homogeneity test: duplicate results (points) for MgO in ten samples of a rock powder. Sample 1 has two coincident results. | ||
The outcome was (as expected) that there was no significant difference between the bottles, with a p-value of 0.33. However, the power of this test (the probability of finding a significant difference at 95% confidence with this kind of data) is only about 0.56. A bigger experiment or a more precise analytical method would be required reliably to detect heterogeneity in this instance, (and in most other instances).
Further insight into the quite weak performance of the test can be provided by examining the confidence limits on the component standard deviations (SD) by using the bootstrap on the ANOVA. The estimates (with the 95% confidence limits) were found to be as follows: analytical SD, 0.014 (0.008, 0.019); between-bottle SD, 0.011(0.000, 0.018) (all original units, i.e., % mass fraction). The between-bottle SD estimated from this duplicate experiment could vary over a wide interval.
Pattern recognition of the origin of flint objects by SIMCA modelling (Dataset No. 5)
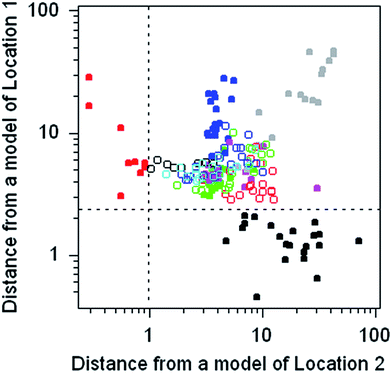
The dataset comprises the composition of 186 discarded pieces of worked flint from 11 different neolithic mining sites, each analysed for 16 trace elements. Flint consists of amorphous silica containing trace amounts of included minerals. The objective was to determine whether the source of a worked flint artefact found elsewhere could be traced to its origins via its chemical composition. This dataset provides the opportunity to practice with, and compare the outcomes of, many different multivariate methods.The chemometrics method chosen to illustrate this dataset is SIMCA, in which a separate principal component model of each of the 11 subsets of the data is constructed. The discriminating criterion between a chosen subset and the disjoint subset (that is, all of the remaining objects) is the Euclidian distance of the objects from the model subspace. For present purposes separate models of two subsets were constructed and the calculated distances plotted against each other (Fig. 6). Both models provide a complete separation between the target type and all of the other types.
Feedback
If you have any observations about any of the datasets, you can post them on MyRSC (http://my.rsc.org/home) in the Group “Analytical Methods Committee—Announcements and Discussions”.
This Technical Brief was drafted for the Statistical Subcommittee and approved by the Analytical Methods Committee on 28/07/15.
| This journal is © The Royal Society of Chemistry 2016 |

