 Open Access Article
Creative Commons Attribution 3.0 Unported Licence
Role of the nanocrystallinity on the chemical ordering of CoxPt100−x nanocrystals synthesized by wet chemistry
Farid
Kameche
ab,
Anh-Tu
Ngo
ab,
Caroline
Salzemann
ab,
Marco
Cordeiro
c,
Eli
Sutter
c and
Christophe
Petit
*ab
aSorbonne Universités, UPMC Univ Paris 06, UMR 8233, MONARIS, 4 place Jussieu, F-75005, Paris, France. E-mail: christophe.petit@upmc.fr
bCNRS, UMR 8233, MONARIS, 4 place Jussieu, F-75005, Paris, France
cCenter for Functional Nanomaterials, Brookhaven National Laboratory, Upton, NY 11973, USA
First published on 17th March 2015
Abstract
CoxPt100−x nanoalloys have been synthesized by two different chemical processes either at high or at low temperature. Their physical properties and the order/disorder phase transition induced by annealing have been investigated depending on the route of synthesis. It is demonstrated that the chemical synthesis at high temperature allows stabilization of the fcc structure of the native nanoalloys while the soft chemical approach yields mainly poly or non crystalline structure. As a result the approach of the order/disorder phase transition is strongly modified as observed by high-resolution transmission electron microscopy (HR-TEM) studies performed during in situ annealing of the different nanoalloys. The control of the nanocrystallinity leads to significant decrease in the chemical ordering temperature as the ordered structure is observed at temperatures as low as 420 °C. This in turn preserves the individual nanocrystals and prevents their coalescence usually observed during the annealing necessary for the transition to an ordered phase.
A. Introduction
Metallic nanoalloys will initiate important development in nanotechnologies due to their specific chemical and physical properties (i.e. in catalysis, magnetism, optics, etc.).1,2 It is now well known that these properties are mainly controlled by the fine tuning of structural parameters such as the size, the bimetallic composition and segregation processes.3 Concerning their fabrication, the bottom up approach, either physical or chemical, is ideal to design this specific class of nanomaterials due to its versatility, facility and low cost. However, the realization of well-controlled bimetallic nanoparticles is not always straightforward from the know-how developed for monometallic nanoparticles.In a sustainable approach, wet chemistry is well adapted to produce such nanoalloys in large amounts.4 However at the nanometer scale, as the properties are strongly dependent on the size and the surface state (raw or passivated), it is crucial to develop methods where the crystallinity, the polydispersity in size and composition are finely controlled. Furthermore, despite the large amount of work made on the synthesis of nanoalloys by the chemical way,1,2 there are still open questions considering the control of composition and especially the segregation process. For example, in chemical approaches, bimetallic nanoparticles are always passivated by an organic molecule and mainly obtained in a disordered A1 phase where both metals are randomly dispersed in the crystalline lattice (Fig. 1A).
Among the nanoalloys, magnetic nanocrystals (NCs) are promising materials due to their strong potential in the development of applications especially for high-density data storage.5–8 In this last domain, bimetallic alloys such as CoPt, FePt or CoRh represent a particularly interesting class of materials for the improvement of the recording on magnetic storage systems. Indeed, alloys such as CoPt (or FePt) have an ordered crystalline phase (L10) around the equi-atomic composition, which is intrinsic to the tetragonal symmetry (fct) of the crystal structure (Fig. 1C) and an ordered fcc structure (L12) for compositions around Co3Pt or CoPt3 (Fig. 1B).9,10 The ordered L10 phase of the CoPt system is of particular interest thanks to its high coercivity (10 kOe) and the high magnetocrystalline anisotropy (4.9 × 10⁶ J m−3). In fact, CoPt NCs in the L10 phase have large uniaxial magnetic anisotropy energy and thus have the potential to exceed the superparamagnetic limit.11,12 Moreover, these CoPt magnetic NCs are monodomain magnetic particles for a typical size below 10 nm.13 Beyond this typical size, the NCs become polydomain magnetic and this leads to domain wall formation.14 In the case of CoPt3, the L12 phase presents also a very high magnetocrystalline anisotropy (2 × 10⁶ J m−3). Therefore, high control of both the chemical composition and size of the NCs alloy is essential for optimizing the magnetic nanoscale behavior.
Using the colloidal route, the CoPt's synthesis leads to the formation of NCs with the A1 disordered structure. A thermal annealing is required to induce ordering toward L10 or L12 structure, depending on the composition.15 For supported nanoparticles, the thermal assistances at high temperature (>300 °C) can lead to coalescence and sintering effects, which increase the size, modify the shape and destroy their organization.15,16 Indeed, the driving force for coalescence and the change of shape is the minimization of surface energy by elimination of interfaces and appearance of grain boundaries and defects.15 Thus, the elaboration of well-defined nanoparticles in the L10 or L12 ordered phase remains very difficult. We report here a new approach for the synthesis of CoxPt100−x nanoalloys allowing control of the nanocrystallinity and as a consequence of the order/disorder phase transition of the bimetallic CoPt NCs. The enhanced crystallinity allows decrease the transition temperature and so to minimize the coalescence effect usually reported during the annealing process. This is demonstrated by comparing the evolution of same nanoalloys obtained by wet chemistry either at high or at low temperature.
B. Experimental method
B-1 Chemicals
Cobalt(II) chloride hexahydrate (CoCl2·6H2O) was from VWR. Platinum(II) acetylacetonate (Pt(acac)2, 98%), oleylamine (80–90%) and sodium borohydride (NaBH4, 99%) were from Acros. Sodium oleate (97%) and 1,2 hexadecanediol (98%) were from TCI. Oleic acid (90%), 1-octadecene (90%) platinum(IV) chloride (PtCl4, 99.9%), octylamine (99%) and tetrakis(decyl)ammonium bromide (TDAB, 99%) were from Aldrich.B-2 Apparatus
A JEOL (100 kV) model JEM-1011 transmission electron microscope (TEM) was used to determine the size of CoPt NCs. The average compositions of the nanocrystals are determined by energy dispersive spectrometry (EDS) analysis using a scanning electron microscope (SEM, JEOL 5510 LV) with IXRF Systems 500 digital processing. This has been done on a micrometric thick film made by slow evaporation of a concentrated solution of NCs on a silicon substrate at room temperature. The analysis is made on different parts of the sample. Magnetic measurements have been obtained by using a vibrating sample magnetometer (VSM) operating in a Quantum Design PPMS.B-3 In situ transmission electron microscopy study
Variable temperature in situ experiments were performed in a JEOL 2100F field emission transmission electron microscope operated at 200 kV, equipped with a Gatan 652 high-temperature sample holder. The CoPt nanoparticles synthesized by two different methods were cast dropped on 3–5 layer thick graphene substrates supported on standard nickel grids. Graphene is used as support for two reasons: (i) it is very thin (<1 nm) and allows the HRTEM imaging of small nanoparticles and atom clusters. (ii) It is relatively stable during annealing to high temperatures. It gives the advantage of less rearrangement and redistribution of carbon from the support upon heating compared to amorphous carbon supports. The so-prepared TEM samples were loaded in the holder and annealed in vacuum in the temperature range between room temperature and 700 °C at pressure below 2 × 10⁻⁷ Torr. The annealing experiments were carried out step-wise: the temperature between steps was increased at the rate of 20 °C min−1. Once the temperature of interest was reached the nanoparticles were stabilized for ∼30 minutes without exposure to the electron beam. Electron irradiation during imaging was kept intentionally low below 2 A cm−2 to prevent any uncontrolled electron beam induced structural changes.B-4 Synthesis of CoPt nanoalloys by the polyol process
There is numerous synthesis of CoPt by the polyol process using mainly acetylacetonate derivatives for both cobalt and platinum.17 However, they are quite complex, as the procedure requires different steps and always injection of the precursor at high temperature. Here in an attempt to control the crystallinity, a novel easy synthesis of CoPt nanoalloys by the so-called polyol process is achieved by mixing platinum(II) acetylacetonate (Pt(acac)2) and homemade cobalt(II)oleate (Co(oleate)2). The choice of oleate derivate is driven by the fact that above 100 °C, Pt(acac)2 reacts with oleic acid to form stable complexes such as Pt(oleate)2.18 We use Co(oleate)2 as precursor because in the chemical synthesis of nanoalloys, it is important to use precursor having similar chemical structure in order to control the composition.19 It is important to note that Pt(oleate)2 is not available commercially and very difficult to synthesize. Conversely Co(oleate)2 could be easily synthesized. The synthesis of the cobalt–oleate complex is adapted from the one of Fe(oleate)3.20 It is prepared by mixing cobalt(II) chloride hexahydrate (30 mmol in 30 ml of ultrapure water) and sodium oleate (60 mmol in a mixture of 40 ml of ethanol and 70 ml of hexane). The mixture is refluxed at 66 °C for 4 h and the organic phase is washed three times with ultrapure water in a separatory funnel. The remaining hexane in the organic phase is evaporated under vacuum in a rotavapor at 32 °C. The paste of cobalt–oleate complex is then dissolved in 130 ml of hexane and again evaporated at 32 °C. The purity and the atomic composition of the compound have been checked by quantitative energy dispersive spectrometry, EDS.In a typical synthesis procedure of CoPt nanoalloys, platinum acetylacetonate (1.25 × 10⁻¹ mmol), cobalt oleate (2.5 × 10⁻¹ mmol) and 1, 2 hexadecanediol (5.6 × 10⁻¹ mmol) are dissolved in a mixture of 10 ml of 1-octadecene, oleic acid (1.88 × 10⁻¹ mmol) and oleylamine (1.88 × 10⁻¹ mmol) in a three-necked round bottom flask, with magnetic stirring under nitrogen at room temperature for 1 h. In the reported polyol synthesis of CoPt, dioctyl-ether is often used as solvent but the obtained nanoparticles present crystalline defects.21 In order to control the nanocrystallinity, we use another solvent with a higher boiling point: 1-octadecene (b.p. 317 °C). Hence the mixture is heated to the boiling point of the solvent and is refluxed for 30 min and then cooled to room temperature, giving a black dispersion, indicating the formation of the nanoparticles. The NCs are isolated by centrifuging and washed with a large excess mixture containing hexane (4%) ethanol (43%) and acetone (43%). The NCs, capped by oleic acid, can be dispersed in organic solvents such as chloroform, hexane or toluene.
B-5 Synthesis of CoPt nanoalloys by liquid–liquid phase transfer method
Cobalt–platinum NCs are made by a slightly modified synthesis of the one reported by Demortière et al.19 A 168.45 mg sample of PtCl4 is dissolved in 5 mL of water and 10 mL of HCl to obtain PtCl62−. A 80 mL volume of toluene containing 2 g of TDAB was mixed with this platinum complex solution for 24 h. After the phase transfer, the aqueous phase is separated and discarded and we obtain the PtCl6(TDA)2 precursor. As for the platinum salt, 118.9 mg of CoCl2 was used to produce the CoCl4(TDA)2 precursor. The following step of synthesis is made under nitrogen in a glove box. 10 mL of platinum organic phase and 10 mL of cobalt organic phase were added to 20 mL of toluene. After addition of octylamine (1 mL), an aqueous solution of NaBH4 (378 mg, 10 mL of H2O) is subsequently introduced into the mixture with rapid stirring. The organic phase containing the CoPt NCs was separated after 21 h of stirring. The remaining toluene in the organic phase is evaporated (until 1 mL) under vacuum in a rotavapor at 35 °C. The NCs are isolated by centrifuging and washed with a large excess ethanol and redispersed in 4 mL of toluene with 20 μL of octylamine. After one night, a final centrifugation is performed to eliminate unstable NCs or aggregates in the solution.C. Results and discussion
C-1 Characterization of CoxPt100−x nanoalloys
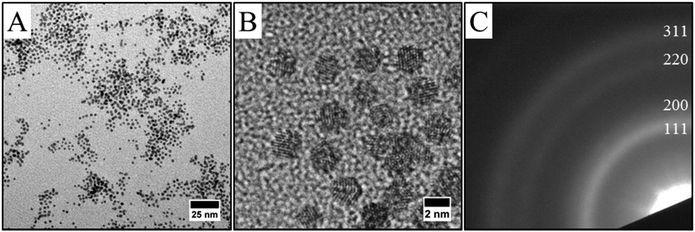
Single phase methods were developed in the last decade to synthesize metallic and bimetallic NCs.1,2 The “polyol process” is one of these methods. In this process, the diol or polyalcohol (as ethylene glycol for example) is the solvent, in which the metal salts are dissolved, but which also acts as a reducing agent. This reaction is performed at high temperature (typically 100–200 °C). FePt22 or NiPd23 nanoalloys have been synthesized by the polyol process. As example, the use of iron acetylacetonate (Fe(acac)3) and platinum acetylacetonate (Pt(acac)2) in ethylene glycol or tetraethylene glycol, generates FePt NCs that show partially ordered fct structures.24 Oleic acid or oleic amine are often used as capping agent and added directly in the chemical bath to limit the growth process. Furthermore, this high temperature process often allows to reach a better crystal quality and to avoid boron contamination often observed in monometallic nano-crystals obtained by single phase borohydride reduction.25However, only few reports on the synthesis of CoPt nanoalloys by the polyol route exist, due to the difficulty to synthesize stable cobalt precursor derivate from acetylacetonate. Thus, the synthesis described here presents an original alternative using cobalt oleate and platinum acetylacetonate as precursor. Fig. 2 shows CoxPt100−x nanoalloys obtained by the polyol process with two different compositions as determined by the EDS analysis (Fig. 2G and H). They can be obtained easily by tuning the initial salt composition: Co32Pt68 nanoalloys, in average composition are obtained by mixing 1.04 × 10⁻¹ mmol cobalt oleate to 1.25 × 10⁻¹ mmol platinum acetylacetonate (i.e., molar ratio 1.04–1.25) (Fig. 2A, C, E and G), while Co52Pt48 is obtained when the molar ratio is 2.5–1.25 (Fig. 2B, D, F and H). In both case, TEM images show well-dispersed spherical NCs (Fig. 2A and B). It can be seen that the NCs are homogeneous in size, shape and electronic contrast indicating the absence of segregation or core–shell structure.16 A slight decrease in the average size while preserving the same polydispersity is observed for different composition of the CoPt, i.e. 2.9 nm with a polydispersity of 13% for Co32Pt68 and 2.5 nm with a polydispersity of 13% for Co52Pt48. Furthermore, HRTEM observations reveal crystalline nanoparticles as evidenced by clearly resolved lattice fringes (Fig. 2C and D). The selected area electron diffraction patterns (Fig. 2E and F) are similar to platinum one,26 which indicates the formation of the face-centered-cubic (fcc) CoPt structure, which is on a chemically disordered phase A1 (Fig. 1A) independent of the composition. Diffraction patterns appear more diffuse as the cobalt composition increases, which is consistent with an increase of the chemical disorder. This is characteristic of an alloy by substitution where platinum and cobalt atoms are randomly distributed on the platinum lattice: the higher the cobalt content, the less structural order.19 As demonstrated previously, the combination of the SEM-EDS analysis (same composition for all the point of analysis on different film made with the same NCs) and the results obtained by TEM (homogeneous contrast and no segregation) and HR-TEM (no core–shell structure) confirms the formation of nanoalloys with the specified composition.27 The second method used to form nanoalloys involves transfer of the metal ion from a polar phase to a non-polar phase using a transferring agent. Such an approach has been developed for synthesis of metallic nanoparticles by Brust et al. in the 90's.28 This liquid–liquid phase transfer (LLPT) method, also called two-phase synthesis, has been largely used to synthesize metallic nanoparticles as silver, gold, platinum or palladium. It typically involves the transfer of the metal precursor (metallic ions) from an aqueous solution to an organic solution containing a capping molecule as alkanethiol or amine. The transfer is assisted by a phase transfer agent such as tetrakis(decyl)ammonium bromide (TDAB). Reduction of metallic precursor is then carried out by adding an aqueous solution of reducing agent (mainly NaBH4) under vigorous stirring. We have reported previously the synthesis of CoxPt100−x nanoalloys by using the LLPT method.19 In order to compare with the NCs prepared by the polyol process, nanoalloys with an average composition of the Co34Pt66 and an average size of 2.2 nm have been synthesized by the LLPT method (Fig. 3). TEM and HRTEM images confirm the formation of nanoalloys and the electron diffraction patterns are indexed to the face-centred cubic (fcc) phase (A1 phase, Fig. 1A).
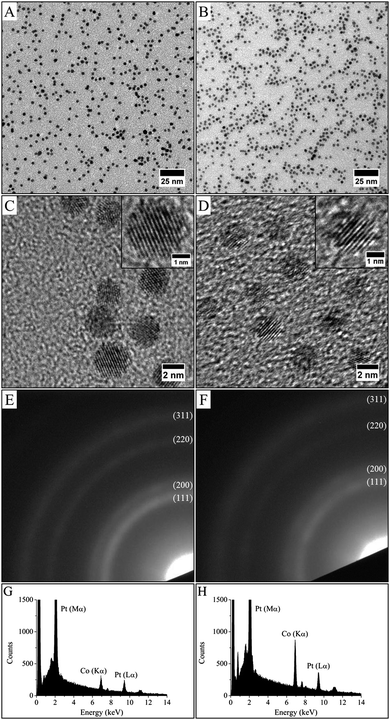 | ||
| Fig. 2 TEM images (A and B), HRTEM images (C and D), electronic diffraction (E and F) and EDX analysis (G and H) of (Co30Pt70)Polyol (left images) and (Co50Pt50)Polyol (right images). | ||
C-2 Magnetic properties of the native Co30Pt70 nanoalloys
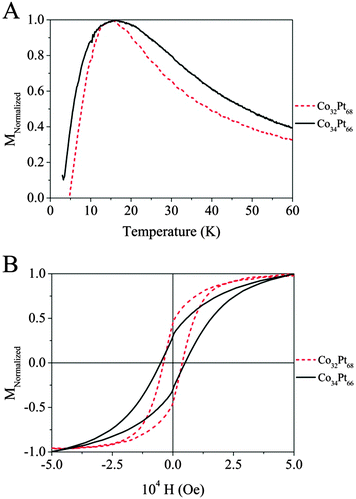
In the following, we chose to focus our study on the particles with the composition around Co30Pt70 obtained by the two process of synthesis. For this composition a crystalline phase L12 corresponding to the fcc-ordered CoPt3 is expected (see Fig. 1B).29 The ordered L12 phase of the CoxPt100−x system shows also a high coercivity and magnetocrystalline anisotropy. As for the L10 phase of CoPt, it can be obtained by annealing of the native NCs in the disordered phase. Magnetic measurements have been performed by using a VSM apparatus on the two previous samples of CoPt NCs in the A1 crystalline phase obtained either by polyol process (CoPt)Polyol or by the liquid–liquid phase transfer (CoPt)LLPT with a composition close to Co30Pt70. The susceptibility versus temperature behavior is measured by a zero field cooled (ZFC)/field cooled (FC) experiment. In the ZFC measurement, the sample is cooled down to 3 K without an applied field starting from a high temperature where all the particles are in the superparamagnetic state. Afterwards, the magnetization is measured as function of the increasing temperature in an applied field of 100 Oe. In the case of an ideal system of perfectly monodisperse particles, the magnetization measured in the ZFC curve drops upon cooling from a maximum, usually defined as being the blocking temperature, TB, to zero in a few degrees. As shown in Fig. 4A, the two ZFC curves exhibit a maximum at 15 K (Table 1). This confirms the superparamagnetic behaviour at room temperature of both samples as expected for 2–3 nm size CoPt NCs in the A1 phase and the ferromagnetic behavior at 3 K as seen on the hysteresis loop (Fig. 4B). Indeed, from the TB values and the average size, the particle magnetic anisotropy energy KV can be estimated by the relation KeffV = kbTB![[thin space (1/6-em)]](https://www.rsc.org/images/entities/char_2009.gif) ln(τ/τ0) ≈ 28kbTB, where V is the particle volume, Keff is the effective magnetic anisotropy energy per volume unit and τ0 ≈ 10−9–10−11 s.30
ln(τ/τ0) ≈ 28kbTB, where V is the particle volume, Keff is the effective magnetic anisotropy energy per volume unit and τ0 ≈ 10−9–10−11 s.30
| Average diameter | Polydispersity | T B | H C | M R-Normalized | |
|---|---|---|---|---|---|
| (Co30Pt70)Polyol | 2.9 nm | 11% | 15 K | 4000 Oe | 0.45 |
| (Co30Pt70)LLPT | 2.2 nm | 13% | 15 K | 5000 Oe | 0.30 |
These values take into account the volume anisotropy but also the shape and surface anisotropies. Thus the magnetic anisotropy is estimated to Keff = 5.7 × 10⁴ J m−3 for 2.9 nm CoPt obtained by the polyol route and 13 × 104 J m−3 for the 2.2 nm CoPt obtained by the LLPT method. These values are very low compare to that of bulk CoPt3 in the L12 phase (Ka = 2 × 10⁶ J m−3) however, there is a significant difference between the two values obtained for the two sample both in the A1 phase. It is mainly due to the surface effect contribution. This behavior is extremely important around 2 nm, where 70% of atoms are located at the surface. In fact the magnetic energy is due both to Ks, surface anisotropy and to Kv the volume anisotropy. As the size decreases the surface contribution increases. The high influence of surface atoms, which have coordination weaker than the atoms of the core, induces an important modification of the magnetic anisotropy energy.31 It should be noticed that the shape of the ZFC curve depends on the nature of the CoPt nanoalloys. For those synthesized by the LLPT method, CoPtLLPT, the width is significantly larger compare to those obtained by the polyol process, CoPtPolyol. This reflects a larger distribution of the magnetic anisotropy energy (MAE). As the size distributions are similar (Table 1), this effect arises from another source. Let us consider the crystalline structure of the native Co30Pt70 nanoalloys depending on the synthetic route. Table 2 summarizes the distribution of the crystalline structure for both samples as deduced from HRTEM studies (see Fig. 2 and 3). It is clear that the crystalline distribution is larger in the case of CoPtLLPT than for CoPtPolyol.
| Monocrystals (%) | Polycrystals (%) | Undetermined (%) | |
|---|---|---|---|
| (Co30Pt70)Polyol (236 particles) | 33 | 31 | 36 |
| (Co30Pt70)LLPT (525 particles) | 21 | 23 | 56 |
This cannot be explained by the size difference as the shape equilibrium calculation does not predict a drastic difference of stability between crystalline fcc structure and the non crystalline one as decahedron in this range of size.32 However, the polyol process occurs at a higher temperature than the liquid–liquid phase transfer method, which is known to favor a better crystallinity. As a matter of fact, it should be noticed that the percentage of undetermined structure and polycrystals is very high for CoPtLLPT, compare to that observed obtained by the polyol method (see Table 2). These amorphous or quasi-amorphous materials have a different magnetic anisotropy compared to the crystalline one, which could explain the larger distribution of MAE observed Fig. 4A. This is confirmed by the hysteresis loop measured in the ferromagnetic regime at 3 K (Fig. 4B and Table 1). The coercivity at 3 K is higher for CoPtLLPT than for CoPtPolyol, which is consistent with a higher magnetic anisotropy. Indeed, the coercivity increases with Keff.33 However, the reduced remanence, Mr/Ms, is lower for CoPtLLPT. This is surprising if we consider only the anisotropy value, but could be expected if we take into account the high level of amorphous or quasi-amorphous materials, which are softer magnets compare to the ones with crystalline structure. It should also be considered that for CoPtLLPT, some NCs are always in the superparamagnetic state even at 3 K due to the larger anisotropy distribution. This explains also the fact that magnetization at saturation is not reached even at 5 T in comparison to the CoPtPolyol.
C-3 Ordering of the Co30Pt70 nanocrystals
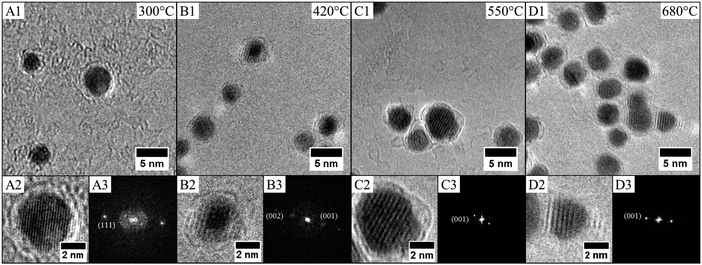
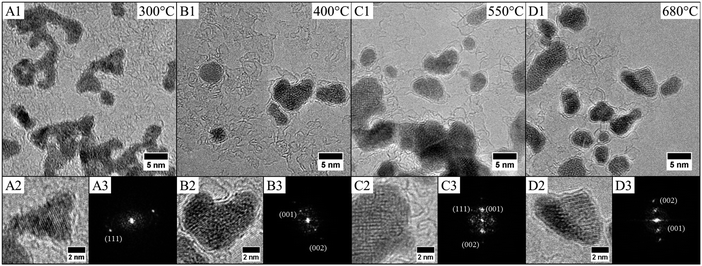
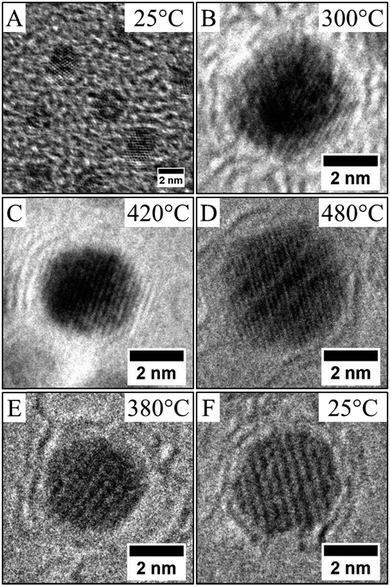
Thus the fcc-CoPt NCs in the disordered A1 phase exhibit a low magnetocrystalline anisotropy and soft magnetic properties as well. Therefore, high temperature annealing is needed (around 685 °C in the bulk phase) for the transformation from the fcc disordered A1 to the fcc ordered L12 phase. We have demonstrated above the influence of the nanocrystallinity on the magnetic properties. Here we will consider the effect of the nanocrystallinity on the ordering by comparing the order/disorder phase transition induced by annealing of CoPt nanoalloys. This has been investigated by an in situ annealing, in real time and on sub-nanometer scale, using HR-TEM studies on both samples (Co30Pt70)LLPT et (Co30Pt70)Polyols deposited on a graphene coated TEM grid (see Experimental section). The crystallinity of the graphene film does not disturb the imaging of the nanoparticles due to the large difference in the atomic number and mass/thickness of the nanoparticles (ZCo = 27, ZPt = 78) and the thin carbon layer (ZC = 6) below them.Fig. 5 shows a typical structural evolution of the (Co30Pt70)Polyols NCs during the in situ annealing process. It can be seen that, in comparison to the native NCs, there is a slight and continuous increase of the average size with the annealing temperature (Table 3). This has been already observed during annealing process of CoPt and attributed to an Ostwald ripening to the benefit of larger nanoparticles.34 HR-TEM patterns at 300 °C show lattices fringes of the NCs, characteristics of the disordered A1 phase with a lattice spacing equal to 2.14 Å (Fig. 5A). This is confirmed by the power spectrum, where only one pair of reflection corresponding to the (111) plane is observed. The deduced lattice parameter is equal to 3.70 Å, which is consistent with an A1 fcc structure. In fact no variation of the lattice parameters is observed compared to the value obtained at room temperature (Fig. 2C). Upon rising the temperature to 420 °C, (Fig. 5B), a drastic structural evolution is observed: some NCs exhibit different fringe patterns characteristics from the ordered fcc L12 phase with a lattice parameters of 3.85 Å as deduced from power spectrum (Fig. 5B3 and Table 4). Indeed the corresponding power spectrum clearly shows characteristics reflections corresponding to the (001) plane, which confirm the formation at low temperature of ordered CoPt3 nanoalloys. It should be noticed that no sintering effect is observed and the NCs still remain isolated on the graphene support. In fact, on the particles prepared by the polyol process at high temperatures graphitic shells can be observed (Fig. 5). These shells are very thin and might be due to the capping agent transforming during annealing, which actually protects the particles against coalescence.
| 25 °C | 300 °C | 420 °C | 550 °C | 680 °C | |
|---|---|---|---|---|---|
| Mean diameter | 2.9 nm | 2.7 nm | 3.0 nm | 3.3 nm | 3.2 nm |
| Polydispersity | 11% | 12% | 17% | 15% | 12% |
| Temperature | 300 °C | 420 °C | 550 °C | 680 °C |
|---|---|---|---|---|
| Number of nanoparticles studied with observable atomic planes | 161 | 161 | 191 | 77 |
| Lattice parameters (Å) | 3.70 | 3.85 | 3.86 | 3.90 |
| % A1 | 100 | 83 | 59 | 43 |
| % L12 | 0 | 17 | 41 | 57 |
| L12/A1 | 0 | 0.20 | 0.69 | 1.33 |
Further increase of the temperature induces the ordering of more and more NCs (Fig. 6 and Table 3) as well as a continuous increase of the lattice parameters. This isotropic expansion of the lattice parameter is characteristic of the ordering of CoPt3 indicating a homogeneous order–disorder transformation.34 The bulk value is equal to 3.9 Å,35 reached in our case at 680 °C, which indicates that the ordering is total.
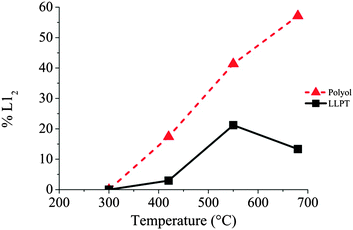
Table 4 shows also the statistical evolution of the ordering of the NCs. At 680 °C, 57% of the observed NCs are in the ordered L12 structure. In fact there is a linear evolution of this percentage with the annealing temperature as shown of Fig. 6 in relation with the evolution of the lattice parameters. This indicates a continuous and monotonic transition from the ordered to the disordered fcc structure of CoPt3. Indeed, this low temperature transition is surprising. Even if it has been reported, and calculated, a decrease of the transition temperature in the CoxPt1−x phase diagram in case of NCs compared to bulk materials,32,36 this value is close to 180 °C below the bulk value (around 760 °C29), for 3 nm in size NCs. Here we observe significantly larger decrease of 350 °C of the order/disorder transition.
Fig. 7 and Table 5 show the same experiment with Co30Pt70 NCs prepared by the LLPT method. The behavior of these NCs strongly differs from both structural and ordering point of view.
| Temperature | 300 °C | 400 °C | 550 °C | 680 °C |
|---|---|---|---|---|
| Number of nanoparticles studied with observable atomic planes | 51 | 101 | 99 | 30 |
| Lattices parameters (Å) | 3.91 | 3.60 | 3.84 | 3.63 |
| % A1 | 100 | 97 | 79 | 87 |
| % L12 | 0 | 3 | 21 | 13 |
| L12/A1 | 0 | 0.03 | 0.27 | 0.15 |
Similarly to the previous case of NCs prepared by the polyol process, no ordering is observed for the LLPT prepared NCs, upon increasing the temperature to 300 °C. For the NCs prepared by the LLPT process, however, significant coalescence occurs, even if isolated NCs are still present on the graphene support film. This effect probably arises from the nature of the passivating agent on the CoPt surfaces, depending on the chemical route. Indeed, alkylamines are used in this soft synthetic method where as (CoxPt100−x)Polyol are coated by carboxylate derivatives (see Experimental methods). In case of (CoxPt100−x)LLPT, this is due to the growth process taking place at room temperature, which is totally inhibited if chemically bond agents are used as a capping agent.37 As a result, their protection is not strong enough to avoid a coalescence process. However, operating in situ on deposited NCs on the TEM grid limit the progression of this process during the annealing and allows us to study the ordering of (Co30Pt70)LLPT. From a crystalline point of view, no transition is observed at 300 °C independent of the size of the NCs. The lattice parameter also corresponds to the (111) plane of the A1 disordered fcc structure (Table 5). At 400 °C only a very small part of NCs undergo a structural evolution towards the L12 fcc ordered phase: 3% of the observed NCs when it was 17% for the (Co30Pt70)Polyols. This finding cannot be explained only by a size effect as the corresponding transition is not observed for the smallest NCs. Further increase of the annealing temperature yields an increase of the number of NCs in the L12 phase, but their proportion is always significantly lower than for the (Co30Pt70)Polyols. (Fig. 6 and Table 5). At 680 °C only 15% of the observed NCs present a L12 structure.
The established strong difference of chemical ordering depending on the chemical route of preparation of the NCs can be understood if we take into account the difference of crystallinity reported above. It has been reported in similar annealing process of CoPt nanoalloys that the transformation of A1 to L10 (or L12) is a multi-step process.34 There is first a transition from polycrystalline, or non-crystalline phase as decahedron, to a fcc truncated octahedron structure. Simultaneously, the NCs size increases and their shape becomes more and more isotropic. Further increase of the temperature induces the chemical ordering of the NCs keeping a fcc octahedron structure. Indeed it has been reported that the non-crystallinity of the NCs is a limiting factor to achieve the chemical order. Furthermore coalescence of the NCs during the annealing process often yield to high angle grain boundaries, which also prevent or slow down the chemical ordering and the homogeneous crystalline transition as numerous energetic barriers should be overcome to achieve the correct crystalline structure.15 Thus chemical ordering can only be reached at higher temperature. In our case, on one hand (CoPt)LLPT present an important part of non crystalline or amorphous structure (Table 2), on the other hand the passivating agent is not strong enough to prevent the coalescence conversely to the case of (CoPt)Polyol. As a result the chemical ordering appears at lower temperature and on larger scale for CoPt nanoalloys made by the polyol process compared to similar NCs synthesized by the LLPT process. This is probably reinforced by the fact that the polyol process is a high temperature synthetic method, which favors a better crystallinity of the NCs. Thus the first step of the order transition considered above is limited or inexistent. Moreover, this assumption is further confirmed if we consider the chemical ordering of Co50Pt50 synthesized by the polyol process (Fig. 8). Again Co50Pt50 NCs present mainly a disordered fcc A1 crystalline structure, with a truncated octahedron shape, and only few NCs with non-crystalline structure are observed. As a consequence, similar behavior as reported above for Co30Pt70, is observed during the in situ annealing in the TEM. For a 50–50 composition the ordered structure, as deduced from the phase diagram, is the tetragonal fct L10 phase (see Fig. 1). It can be obtained by annealing because chemical synthesis only produce the disordered A1 structure. The in situ TEM experiments with these NCs show slight coarsening due to the Ostwald ripening of the NCs as their size increase from 2.5 to 3.0 nm but without coalescence. Furthermore, ordering occurs also at low temperature (420 °C) and the nanoparticles retain their ordered L10 structure after cooling down to low temperature as observed on Fig. 8E and F. Our previous study on NCs synthesized by the LLPT method with same size, but passivated also by alkylamine chains showed a huge coalescence and a chemical ordering only above 500 °C.16 Again, we observe the beginning of chemical ordering at lower temperature for (CoPt)Polyol than for (CoPt)LLPT independent of the composition.
D. Conclusion
We have reported here a new synthesis of bimetallic CoxPt100−x NCs by the polyol process, allowing substantial control over the composition of these nanoalloys. Structural analysis performed by TEM and HR-TEM show that, compared to conventional soft chemical approach, the nanocrystallinity of these nanoalloys strongly differs as fcc structure is mainly observed even for very low size. The decrease of the crystalline polydispersity induces a decrease of the magnetic anisotropy energy distribution as observed by magnetic measurement. Furthermore, the order/disorder transition induced by annealing and observed in situ by HR-TEM studies, clearly demonstrates a decrease of the chemical ordering temperature compared to the bulk value but also to NCs obtained by soft chemistry. The absence of coalescence during the annealing allows us to develop a new approach to obtain periodic 2D self-assembly of chemically ordered nanoalloys. Hence it is clearly demonstrated the importance of the chemical preparation route on the crystallinity of the NCs. This strongly influences the physical and chemical properties of the NCs.Acknowledgements
This work was supported by the French ANR within the program “Nanocrisnet” under Contract ANR-11-BS10-018 and by the LabEx MiChem part of French state funds managed by the ANR within the “Investissements d'Avenir” program under reference ANR-11-IDEX-0004-02. This research has been carried out in part at the Center for Functional Nanomaterials, Brookhaven National Laboratory, which is supported by the U.S. Department of Energy, Office of Basic Energy Sciences, under Contract No. DE-SC0012704. Thanks are also due to the “Service commun de microscopie de l'UFR de Chimie de l'UPMC” and to S. Casale for their help in the TEM characterization of the nanocrystals.References
- Nanoalloys, ed. D. alloyeau, C. Mottet and C. Ricolleau, Springer, 2012 Search PubMed.
- Nanoalloys: From Fundamentals to Emergent Applications, ed. F. Calvo, Elsevier, 2013 Search PubMed.
- R. Ferrando, J. Jellineck and R. L. Johnston, Chem. Rev., 2008, 108, 845 CrossRef CAS PubMed.
- Q. Zhang, J. Xie, Y. Yu and J. Y. Lee, Nanoscale, 2010, 2, 1962 RSC.
- M. L. Plumer, J. Van Ek and D. Weller, The Physics of Ultra-High-Density Magnetic Recording, Springer, 2001 Search PubMed.
- D. Weller and A. Moser, IEEE Trans. Magn., 1999, 35, 4423 CrossRef CAS.
- S. Sun, C. B. Murray and D. Weller, et al. , Science, 2000, 287, 1989 CrossRef CAS.
- P. Gambardella, S. Rusponi, M. Veronese, S. S. Dhesi, C. Grazioli, A. Dallmeyer, I. Cabria, R. Zeller, P. H. Dederichs, K. Kern, C. Carbone and H. Brune, Science, 2003, 300, 1130 CrossRef CAS PubMed.
- X. Sun, Z. Y. Jia, Y. H. Huang, J. W. Harrell, D. E. Nikles, K. Sun and L. M. Wang, J. Appl. Phys., 2004, 95, 6747 CrossRef CAS PubMed.
- T. J. Klemmer, N. Shukla, C. Liu, X. W. Wu, E. B. Svedberg, O. Mryasov, R. W. Chantrell and D. Weller, Appl. Phys. Lett., 2002, 81, 2220 CrossRef CAS PubMed.
- E. E. Carpenter, J. A. Sims, J. A. Wienmann, W. L. Zhou and C. J. O'Connor, J. Appl. Phys., 2000, 87, 5615 CrossRef CAS PubMed.
- Y. Huang, Y. Zhang, G. C. Hadjipanayis, A. Simopoulos and D. Weller, IEEE Trans. Magn., 2002, 38, 2604 CrossRef CAS.
- G. W. D. Spratt, P. R. Bissell, R. W. Chantrell and E. P. Wohlfarth, J. Magn. Magn. Mater., 1998, 75, 309 CrossRef.
- H. Zeng, S. Sun, T. S. Vedantam, P. Liu, Z. Dai and Z. L. Wang, Appl. Phys. Lett., 2002, 80, 2583 CrossRef CAS PubMed.
- T. J. Klemer, C. Liu, N. Shukla, X. W. Wu, D. Weller, M. Tanase, D. E. Laughlin and W. A. Soffa, J. Magn. Magn. Mater., 2003, 266, 79 CrossRef.
- A. Demortière and C. Petit, J. Appl. Phys., 2011, 109, 084344 CrossRef PubMed.
- M. Chen and D. E. Nikles, J. Appl. Phys., 2002, 91, 8477–8479 CrossRef CAS PubMed.
- F. Somodi, Z. Peng, A. B. Getsoian and A. T. Bell, J. Phys. Chem. C, 2011, 115, 19084 CAS.
- A. Demortière and C. Petit, Langmuir, 2007, 23, 8575 CrossRef PubMed.
- A. T. Ngo, J. Richardi and M. P. Pileni, Phys. Chem. Chem. Phys., 2013, 15, 10666 RSC.
- B. Hyun, J. H. Wu, H. L. Liu, S. P. Ko, J. S. Ju and Y. K. Kim, Colloids Surf., A, 2008, 313, 250 Search PubMed.
- S. Sun, Adv. Mater., 2006, 18, 393 CrossRef CAS.
- F. Ai; A. Yao, W. Huang, D. Wang and X. Zhang, Physica E, 2010, 42, 1281 CrossRef PubMed.
- L. C. Varanda and M. Jafelici, Jr., J. Am. Chem. Soc., 2006, 128, 11062 CrossRef CAS PubMed.
- J. Park, J. Joo, S. G. Kwon, Y. Jang and T. Hyeon, Angew. Chem., 2007, 46, 4630 CrossRef CAS PubMed.
- K. Wikander, C. Petit, K. Holmberg and M. P. Pileni, Langmuir, 2006, 22, 4863 CrossRef CAS PubMed.
- A. Demortière, R. Losno, C. Petit and J.-P. Quisefit, Anal. Bioanal. Chem., 2010, 397, 1485 CrossRef PubMed.
- M. Brust, M. Walker, D. Bethell, D. J. Schiffrin and R. Whyman, J. Chem. Soc., Chem. Commun., 1994, 801 RSC.
- C. Leroux, A. Loiseau, D. Broddin and G. Vantendeloo, Philos. Mag. B, 1991, 64, 57 CAS.
- E. Tronc, Il Nuovo Cimento D, 1996, 18, 163 CrossRef.
- A. Demortière, S. Buathong, B. P. Pichon, P. Panissod, D. Guillon, S. Bégin-Colin and B. Donnio, Small, 2010, 6, 1341 CrossRef PubMed.
- G. Rossi, R. Ferrando and C. Mottet, Faraday Discuss., 2008, 138, 193 RSC.
- L. Weil, J. Phys. Radium, 1951, 12, 437 CrossRef.
- P. Andreazza, C. Mottet, C. Andreazza-Vignolle, J. Penuelas, H. C. N. Tolentino, M. De Santis, R. Felici and N. Bouet, Phys. Rev. B: Condens. Matter Mater. Phys., 2010, 82, 155453 CrossRef.
- S. U. Jen, J. Alloys Compd., 1996, 234, 231 CrossRef CAS.
- D. Alloyeau, C. Ricolleau, C. Mottet, T. Oikawa, C. Langlois, Y. Le Bouar, N. Braidy and A. Loiseau, Nat. Mater., 2009, 8, 940 CrossRef CAS PubMed.
- C. Salzemann and C. Petit, Langmuir, 2012, 28, 4835 CrossRef CAS PubMed.
| This journal is © the Owner Societies 2015 |


