 Open Access Article
Creative Commons Attribution 3.0 Unported Licence
Self-assembled trityl radical capsules – implications for dynamic nuclear polarization†
I.
Marin-Montesinos
a,
J. C.
Paniagua
bc,
M.
Vilaseca
d,
A.
Urtizberea
e,
F.
Luis
e,
M.
Feliz
f,
F.
Lin
g,
S.
Van Doorslaer
g and
M.
Pons
*a
aBiomolecular NMR laboratory, Department of Organic Chemistry, University of Barcelona, Cluster Building, Barcelona Science Park, Baldiri Reixac, 10-12, 08028 Barcelona, Spain. E-mail: mpons@ub.edu
bDepartment of Physical Chemistry, University of Barcelona, Martí i Franquès, 1-11, 08028 Barcelona, Spain
cInstitute of Theoretical and Computational Chemistry, University of Barcelona (IQTCUB), Martí i Franqués, 1-11 08028 Barcelona, Spain
dMass Spectrometry Core Facility, Institute for Research in Biomedicine (IRB Barcelona), Baldiri Reixac, 10-12, 08028 Barcelona, Spain
eInstituto de Ciencia de Materiales de Aragón, CSIC-Universidad de Zaragoza, Pedro Cerbuna 12, 50009 Zaragoza, Spain
fUnitat de RMN, Centres Científics i Tecnològics, Universitat de Barcelona, Baldiri Reixac, 10-12, 08028 Barcelona, Spain
gDepartment of Physics, University of Antwerp, Universiteitsplein 1, B-2610 Wilrijk, Belgium
First published on 20th January 2015
Abstract
A new class of guest-induced, bi-radical self-assembled organic capsules is reported. They are formed by the inclusion of a tetramethylammonium (TMA) cation between two monomers of the stable trityl radical OX63. OX63 is extensively used in dissolution dynamic nuclear polarization (DNP) where it leads to NMR sensitivity enhancements of several orders of magnitude. The supramolecular properties of OX63 have a strong impact on its DNP properties. An especially relevant case is the polarization of choline-containing metabolites, where complex formation between choline and OX63 results in faster relaxation.
Introduction
The enhanced NMR sensitivity provided by dynamic nuclear polarization (DNP) experiments has opened the possibility for applications that would have not been feasible otherwise. Examples include solid-state NMR experiments performed under magic angle conditions on biological samples1–3 and surfaces4 as well as solution NMR studies of metabolites and imaging of hyperpolarized samples for medical diagnosis.5–7High NMR sensitivity is achieved by transfer, using microwave irradiation, of the large polarization of electron spins present at low temperatures and moderate magnetic fields to nuclear spins. For this purpose, samples are doped with paramagnetic species.
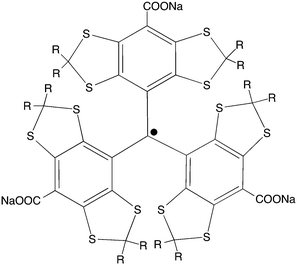
The trityl radical OX63 (Scheme 1) is the current choice for direct polarization of 13C or 15N nuclei in the context of metabolic and in vivo imaging studies that are based on dissolution DNP.8 In these experiments, trityl concentrations ranging from 15 to 30 mM are used for polarization at very low temperatures (1–2 K) in a glass matrix. After the nuclear polarization has been achieved, the sample is rapidly melted, dissolved and transferred to a standard NMR or MRI instrument by using pressurized hot solvent.9
OX63 is highly soluble in water and generally assumed to be monomeric in solution. Here, we show that OX63 aggregates at concentrations higher than 1 mM in aqueous solution. In the presence of tetramethylammonium (TMA) salts, OX63 forms well-defined dimeric capsules that host a TMA cation and bring two radical centers in close proximity. The interaction between the electron pair is clearly observed by electron paramagnetic resonance (EPR) and direct SQUID measurements and corroborated by DFT calculations.
Self-association of OX63 directly affects DNP. The polarization of tetraalkylammonium-containing species such as choline, an important cancer biomarker, is reduced as a result of the direct interaction with OX63. Addition of TMA and reduction of the concentration of OX63 results in 60% increase in the polarization of choline.
The present results highlight the supramolecular properties of the OX63 trityl radical, the first example of a new family of bi-radical, host-induced, self-assembled capsules.
Results and discussion
Self-association of OX63 changes the UV molar absorption coefficient
Fig. 1 shows the concentration dependence of the apparent molar absorption coefficient, i.e. absorbance divided by concentration and cell length, of OX63 obtained at 266 nm in 10 mM phosphate buffer, pH 7, and in 10 mM phosphate plus 1 M TMA solution at room temperature. In the absence of intermolecular interactions, the molar absorption coefficient should be constant. This was indeed observed at low concentrations. However, at OX63 concentrations above 1 mM strong deviations were observed indicating the onset of aggregation. In the presence of 1 M TMA we observed a consistent increase in the apparent molar absorption coefficient starting at an OX63 concentration just below 1 mM. The spectral shape did not change with concentration (Fig. S1, ESI†).At low OX63 concentrations the observed molar absorption coefficient is reduced by the presence of TMA indicating that TMA readily binds to monomeric OX63 (Fig. S2, ESI†). The concentration at which OX63 self-association starts is similar in the presence and in the absence of TMA suggesting that TMA is not required for self-association of OX63. However, the smooth concentration dependence of the molar absorption coefficient observed only in the presence of TMA suggests that the formation of well-defined supramolecular species requires the presence of a suitable guest. A similar behavior had been previously observed in guest-driven encapsulation processes.10
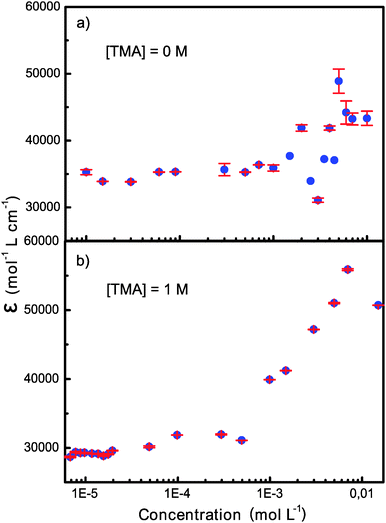 | ||
| Fig. 1 Concentration dependence of the molar absorption coefficient of OX63 in the absence and in the presence of 1 M TMA. | ||
Trityl radicals adopt a propeller conformation due to steric hindrance between the bulky substituents at the ortho positions. Changes in the intensity of the UV-Vis bands (hypochromicity or hyperchromicity) are a very sensitive probe of even small changes in the twist of the propeller caused by intermolecular interactions.11
Self-association of OX63 observed by mass spectrometry
Fig. 2 shows mass spectra of OX63 obtained by electrospray ionization (ESI). The presence of TMA interferes with the measurements and the most concentrated sample at which ESI-MS spectra could be recorded was 15 μM OX63 and 7.5 μM TMA. Under these conditions, the spectra are dominated by monomeric OX632+ formed by one OX63 radical (charge −3) and five cations with charge +1 (sodium, potassium or hydrogen), (Fig. 2a). At least one of the cations must be sodium or potassium, i.e. the species with 5 protons was not detected. Gas-phase doubly charged monomers do not contain TMA. However, broad signals centered at m/z 1474 and 990 were assigned to TMA-encapsulated in OX63 dimers (Fig. 2b). The peak at 1474 m/z is consistent with a doubly charged OX63 dimer with 7 Na and 1 TMA cations, while the peak at 990 m/z was assigned to a triply charged dimer with 8 Na and 1 TMA cations.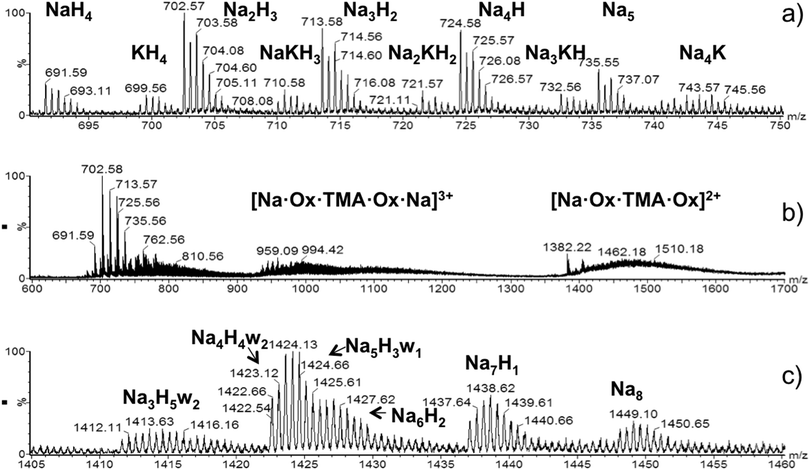 | ||
| Fig. 2 ESI-MS spectra of OX63. (a) Doubly charged monomers observed by injecting a 15 μM solution of OX63 into 7.5 μM TMA. The number and type of cations is indicated. (b) Details of TMA-stabilized dimers are observed in the same sample. Dimers with +3 and +2 charges are indicated. Ox refers to the neutral species with 3 sodium ions. Thus the number of sodium ions in the 3+ species is 8 and in the 2+ species is 7. (c) Doubly charged dimers extracted from ion-mobility edited ESI-MS spectra of a 1 mM OX63 solution in water. The number and type of cations and the presence of included water molecules (w) are indicated (see also Table 1). | ||
Solutions with higher OX63 concentration could be measured in the absence of TMA. Signals at m/z 1400–1450 increased in intensity with an increase in OX63 concentration, thus suggesting that they originate from OX63 oligomers (Fig. S3, ESI†). Ion mobility analysis of this region indicated a major contribution from doubly charged dimers, although triply charged trimers and higher species with similar m/z ratios were also detected. Fig. 2c shows an enlarged view of the spectra of doubly charged dimers. Various species were observed, differing in the number and type of cations present as well as in the presence of water molecules (Table 1).
| m/z | Na+ | H+ | H2O |
|---|---|---|---|
| 1448 | 8 | 0 | 0 |
| 1437 | 7 | 1 | 0 |
| 1426 | 6 | 2 | 0 |
| 1424 | 5 | 3 | 1 |
| 1422 | 4 | 4 | 2 |
| 1411 | 3 | 5 | 2 |
There is an inverse correlation between the number of water molecules and sodium ions. No additional water molecules were observed in doubly charged OX63 monomers with variable proportions of sodium, potassium and protons. Therefore, the presence of water molecules is consistent with OX63 dimers forming a capsule that can be occupied by either sodium or hydronium cations.
OX63 dimers show electron–electron coupling in EPR spectra
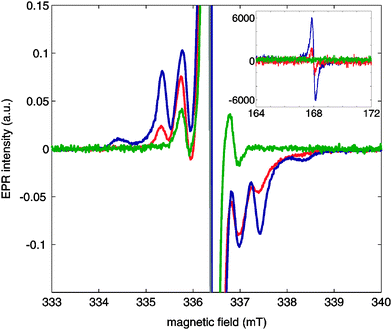
Fig. 3 shows continuous-wave (CW)-EPR X-band spectra of OX63 at 1.5 mM, 15 mM and 30 mM concentrations in the presence of 1 M TMA in glycerol–D2O (1![[thin space (1/6-em)]](https://www.rsc.org/images/entities/char_2009.gif) :
:![[thin space (1/6-em)]](https://www.rsc.org/images/entities/char_2009.gif) 1). The spectra of 15 mM and 30 mM OX63 solutions were recorded at 2.8 K by rapidly cooling the sample from room temperature. The CW-EPR spectrum of the 1.5 mM OX63 solution was recorded at 10 K due to severe saturation of the signal at lower temperatures. Fig. S4 in the ESI† shows a comparison between the EPR spectra of 15 mM and 1.5 mM OX63 with 1 M TMA recorded at 40 K under conditions where no saturation occurs, revealing the same tendency as observed here. The comparison between the EPR spectrum of a 15 mM sample of OX63 in the same solvent with and without TMA is also shown as a reference in Fig. S5 of the ESI.†
1). The spectra of 15 mM and 30 mM OX63 solutions were recorded at 2.8 K by rapidly cooling the sample from room temperature. The CW-EPR spectrum of the 1.5 mM OX63 solution was recorded at 10 K due to severe saturation of the signal at lower temperatures. Fig. S4 in the ESI† shows a comparison between the EPR spectra of 15 mM and 1.5 mM OX63 with 1 M TMA recorded at 40 K under conditions where no saturation occurs, revealing the same tendency as observed here. The comparison between the EPR spectrum of a 15 mM sample of OX63 in the same solvent with and without TMA is also shown as a reference in Fig. S5 of the ESI.†
At low concentrations, the spectra show a central line at g = 2.0032 with a set of side bands at about 15 MHz. The position of the central band agrees with the g value previously reported for OX63. The position of the side bands corresponds to those previously described and can be explained as the result of 13C hyperfine couplings and spin–flip satellite lines.12,13 An additional set of side bands shows up when the concentration of OX63 is increased in the presence of TMA. The sharp side-band peaks suggest well-defined inter-spin distances and is not consistent with unspecific freezing-induced aggregation. These side bands are consistent with the presence of radical dimers behaving as an S = 1 system, with D = 55 MHz and g = 2.003 (simulation shown in Fig. S6 of the ESI†). In a simple point-dipolar approximation this agrees with a distance of 11.2 Å between the two radicals. At high concentrations, a clear half-field signal was also observed (inset of Fig. 3), a signature of S = 1 species being present. This proves the presence of dimeric OX63 species under the conditions typical for DNP experiments.
The population of the species contributing to the S = 1 and S = 1/2 signals is difficult to determine accurately due to differential saturation effects. A rough estimate from simulation of the spectra in Fig. 3 suggests that the S = 1 contribution may represent 10–20% at 30 mM. UV-Vis results indicate self-association above 1 mM concentration. Although the high concentration plateau was not well defined and, therefore, the extension of the self-association could not be accurately determined, UV-Vis data obtained at room temperature suggest a high proportion of supramolecular species. This apparent contradiction may be reconciled by assuming that some of the supramolecular aggregates detected by UV-Vis spectrometry are “loose dimers” not showing appreciable coupling between the component radicals and, therefore, not distinguishable by EPR from bona fide monomers. The coexistence of structurally distinct “dimers” with significantly different EPR spectra will be discussed below in connection with low temperature annealing effects.
Density functional calculations
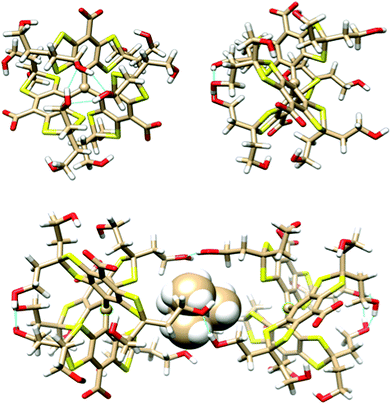
The geometry and stability of OX63 dimers was investigated using the density functional/Kohn–Sham formalism with the polarized split-valence basis set def2_SVP.14 The third version of Grimme's dispersion correction with Becke–Johnson damping15 was included to get an appropriate description of intermolecular interactions, and a geometrical counterpoise correction16 was used to compensate for the basis set superposition error. Solvent effects were accounted for using a self-consistent, conductor-like screening model,17 and sodium counterions were added to compensate for the carboxylate charges. Full geometry optimizations were performed in every case. All calculations were carried out using the Orca package.18 Further details are given in the Experimental section.A preliminary conformational study of the monomer showed that the three aromatic rings are arranged in propeller-like shape around the central sp2 carbon. Many existing conformations can be grouped into two classes. The lower energy class (see Fig. 4, top) has three hydroxyl groups located on one side of the propeller closing a 6-member ring with 3 hydrogen bonds preventing other atoms from approaching the central carbon from this side of the molecule. The other side remains open. Thus OX63 adopts a dome-like shape structure. The oxygen atoms of the three hydroxyethyl chains in the open side are separated by 8.5 Å in the lowest energy structure, leaving enough room for molecules as large as TMA to partially enter the concave side of the dome. The hydroxyethyl chains in the open side are flexible, roughly parallel to each other, aligned with the propeller axis and available for making intermolecular hydrogen bonds.
In the second class of conformers both sides of the propeller are open, in the sense that no 6-member hydrogen-bonded rings are formed by the hydroxyl groups, although individual hydrogen bonds are observed in some of the conformations. Their shape is thus roughly cylindrical, although the two sides have different sizes in most cases. Their energies are, at least, 24 kcal mol−1 higher than those of the dome shaped class and will not be further considered.
Insertion of a TMA molecule into the cavity of the OX63 dome conformation results in stable complexes with one methyl group aligned with the propeller axis. The calculated formation energy is 8.5 kcal mol−1 if this methyl group points to the inside of the dome, and 10.5 kcal mol−1 if it points outwards. In the two cases the TMA center lies near the plane of the three hydroxyl groups that crown the dome rim, at 6.5 and 6 Å distances, respectively, from the central C. This suggests that a single TMA molecule should be able to strongly link two OX63 molecules, forming an endohedral capsule. This is in fact the case, and a full optimization of the TMA-endohedral dimer has a stabilization energy of 29 or 30 kcal mol−1, depending on the orientation of the axial methyl group of TMA along the C3 symmetry axis. This is higher than the sum of the interaction energies of the two OX63–TMA complexes, because three HO⋯H hydrogen bonds strengthen the whole structure by linking together the rims of the two domes (see Fig. 4, bottom). Additional hydrogen bonds may be formed by recruiting water or other small molecules to fill the space between the linking hydrogen bonds, resulting in extra stabilization of a few kcal mol−1. The formation energy of the empty capsule is 15 kcal mol−1. The distance between the radical centers is about 13 Å for both the empty and TMA containing capsules. The orientation of TMA and the asymmetry of the intermolecular H-bonds make the two OX63 molecules in the dimer non-equivalent.
The supramolecular chemistry field has plenty of examples of semirigid aromatic frameworks displaying a concave cavity decorated at its edge by a cyclic array of hydrogen bond forming groups. Some of these systems show guest-induced self-association leading to the formation of hydrogen-bonded capsules with an internal cavity filled by the guest. Early examples of self-assembled capsules include Rebek's tennis balls19 and urea-substituted calix[4]arenes.20,21 The latter capsules are stabilized by a cyclic array of hydrogen bonds between urea groups contributed by each of the two units in an interdigitated arrangement.22 TMA is structurally related to choline and artificial receptors for acetylcholine based on calixarenes have been reported.23
EPR g, hyperfine and zero-field splitting (ZFS) tensors were calculated for the optimized geometries using the B3LYP functional24 with the Iglo-II basis set.25 The values obtained for the isotropic component of g are 2.0034 for the monomer, 2.0033 for the void dimer and 2.0035 for the endohedral capsule, in good agreement with the experimental value (2.003). Unpaired spin density is strongly delocalized leading to important hyperfine couplings (Fig. S7, ESI†). The calculated Fermi contact terms for the monomer are in good agreement with previous calculations and experimental measurements in other trityl radicals.13a Fermi contact energies in the radical dimers are calculated to be approximately half of the monomer values (Table S1, ESI†), as expected.26
High-level calculations of ZFS parameters D and E in triplet states of aromatic compounds27 have shown that the electron spin–spin component dominates over the spin–orbit contribution, and that the first one can be efficiently obtained from restricted open-shell wave functions (ROHFs) and moderate basis sets. On the other hand, although unrestricted Kohn–Sham formalism leads to a large deviation of those properties, the spin-unrestricted natural orbitals (UNOs) allow building a UNO determinant that renders almost exactly the D values resulting from the restricted formalism, provided that spin contamination is small.28 Using this methodology, a D value of 31 MHz was obtained for the empty and endohedral dimers, which underestimates the experimental value of 55 MHz measured by EPR. This may be due to the spin–orbit contribution being non-negligible because of the presence of sulfur atoms in the molecule. More accurate calculations of ZFS should also include a better account of electron correlation but even the simplest CASSCF calculations are beyond the scope of our computational means for such a large system.
Low temperature annealing of TMA–OX63 complexes
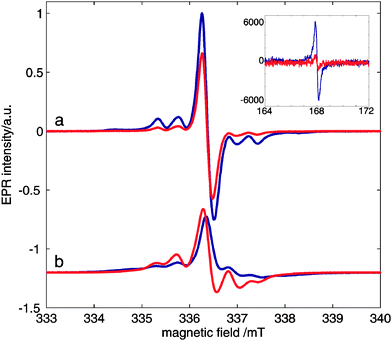
In DNP experiments samples are rapidly cooled below 2 K. We noticed that samples of OX63 in glycerol–water in the presence of 1 M TMA showed annealing phenomena observable by EPR, SQUID and DNP experiments. A similar behavior was observed in the presence of choline but no annealing effect was observed in OX63 alone, indicating that it is associated with the presence of tetraalkylammonium derivatives.Fig. 5 shows the effect of annealing a 30 mM OX63 sample with 1 M TMA for 30 minutes at 5 K. The sample was initially cooled to 2.8 K and EPR spectra were recorded at different values of microwave power. Then, the temperature was increased to 5 K for 30 minutes and, finally, the temperature was lowered again to 2.8 K and all EPR spectra were recorded again. Annealing results in a significant decrease of the half-field signal assigned to electron–electron coupling in the TMA-stabilized capsules (Fig. 5, inset). EPR spectra of rapidly cooled OX63 samples containing TMA were easily saturated when microwave power was increased, suggesting slower electronic relaxation rates compared to TMA-free samples. After annealing the saturation behaviour of samples with and without TMA is similar (Fig. 5 and Fig. S8, ESI†). An apparent decrease in the intensity of the side bands associated with the dipolar coupled electron spins is also observed, although a quantification of this decrease is less obvious due to the large change in electron relaxation (Fig. 5a).
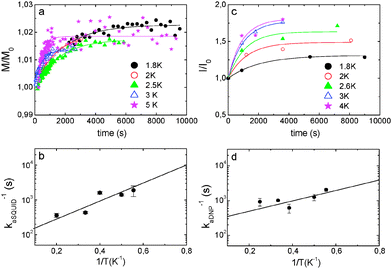
Direct magnetic measurements show that sample annealing also affects the electron magnetization. The paramagnetic contribution to the electron magnetization of a sample containing 30 mM OX63 and 1 M TMA in a glycerol–water buffer was measured using a commercial SQUID (superconducting quantum interference device) magnetometer, as described in the Experimental section. The magnetization was measured, at a constant temperature ranging from 1.8 K to 5 K, following a rapid cooling of the sample from room temperature, under conditions similar to those used for DNP experiments.
The time dependence of the magnetization measured at five different temperatures is shown in Fig. 6a. A small but clear increase of magnetization was observed, which cannot be attributed to temperature fluctuations (Fig. S9, ESI†). In all cases, the equilibrium magnetization, estimated from the extrapolation of relaxation curves to t → ∞, was found to be about 2% larger than the initial one. The magnetic relaxation can be described reasonably well by exponential curves, as shown in Fig. 6a. From these fits, the relaxation rate kaSQUID was determined at each temperature. It follows the Arrhenius law (see Fig. 6b) with an activation energy Ea/k ≈ 5.7 ± 0.05 K.
The build-up of 13C polarization of 1 M TMA, labeled with 13C in one methyl group, using 30 mM OX63 was measured at 1.4 K on a Hypersense® instrument. The steady-state polarization increased when the sample was annealed at temperatures between 2 and 5 K before polarization was started. A sample cooled to 1.4 K, annealed at 50 K and then cooled again to 1.4 K reached 80% higher polarization than a directly cooled sample (Fig. S10, ESI†).
The annealing kinetics at various temperatures was determined by measuring the steady-state polarization achieved at 1.4 K as a function of the annealing time at constant temperatures. The experiments were started by initial rapid cooling of the samples to 1.4 K. Then the samples were brought to the desired temperature in the range from 1.8 to 4 K and annealed for increasing times after which the sample was finally cooled again to 1.4 K. At this point, microwave irradiation was started and maintained until steady-state polarization was achieved. The experimental protocol is graphically summarized in Fig. S11, ESI.† The steady state polarization increases exponentially with the annealing time (Fig. 6c) with a rate constant kaDNP that depends on the temperature according to the Arrhenius law, with an activation energy of Ea/k ≈ 4 ± 1.6 K (Fig. 6d). The similarity with the activation energy obtained from the analysis of the temperature dependence of the relaxation measured in the SQUID experiments suggests that the two experiments are sensing the same underlying chemical phenomenon.
On the origin of annealing effects in the OX63–TMA system
The observed annealing effects include a decrease in the half-field signal and faster relaxation in EPR, increased electron magnetization and increased DNP polarization. The changes in electron magnetization are compatible with the presence of some of the radicals in the S = 0 state after rapid cooling, which are converted into non-interacting radicals by the annealing process. The increase in active paramagnetic centers can also explain the faster electron relaxation observed after annealing and enhanced nuclear polarization, with respect to the non-annealed state.The capacity of OX63 to form dimers (or higher oligomers) under a variety of conditions is clearly shown by UV-vis and mass spectrometry, EPR spectroscopy and DFT calculations. Coupled, radical pairs have triplet (S = 1) and singlet (S = 0) states, both of which are presumably populated at the temperatures of interest. The observation of the half-field signal is indicative of the formation of the S = 1 state. The magnetization increase caused by annealing can be accounted for by a structural change in OX63 capsules causing a decrease in the coupling between the component radicals. This process is functionally equivalent, from the EPR point of view, to a dimer-to-monomer conversion, although effective chemical dissociation of the dimers, with component monomers diffusing away from each other, is unlikely in the low temperature frozen glass.
A structural conversion between chemically distinct species should follow the Arrhenius law, as observed experimentally (Fig. 6). Although OX63 self-association seems to occur also in the absence of TMA, annealing has only been observed in the presence of TMA (or choline, see below).
DFT calculations predict the self-association of OX63, its capacity to bind TMA, and the templating effect of TMA in the formation of dimers.
TMA is oriented along the C3 axis of the complex with one methyl group pointing towards one of the radicals and the other three directed towards the other one. These two orientations are non-equivalent although they may become equivalent by rotation of TMA inside the capsule with a low energy barrier. On the other hand, the sum of the N–Ccentral distances of the two contributing OX63–TMA complexes (12.5 Å) is shorter than the distance between the radical centers in the dimer (13 Å). These observations suggest that subtle geometry changes in the position and/or orientation of TMA may change the properties of TMA-containing dimers. For example, the presence of TMA inside the OX63 capsule may enable coupling of the two unpaired electrons, in spite of the wide distance between them, through an indirect superexchange mechanism,29 and this could be affected by reorientations and/or small displacements of the guest. Thus, a coupled-radical pair could be converted into a pair of uncoupled radicals. Although similar activation energies suggest that the annealing phenomena observed by electron magnetization and DNP are related, the complex dependency of DNP on a number of parameters, including electron and nuclear relaxation, which may be affected in a complex way by the annealing process may explain the observed differences between the two annealing phenomena, and especially the much larger effects observed in DNP.
The possibility that annealing effects are mediated by changes in the water–glycerol glass, e.g. through hydrogen bonds between OX63 and the solvents affecting the dimer geometry, cannot be completely ruled out. However, changes in the bulk properties of the glass related to microwave penetration can be ruled out since the same annealing effects are observed by DNP and SQUID measurements.
14N DNP of TMA using OX63
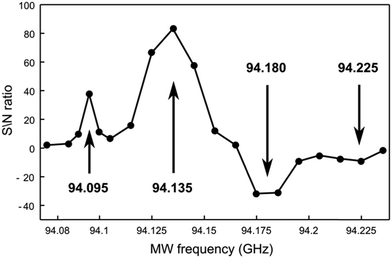
The high symmetry of TMA slows down quadrupolar relaxation and facilitates the observation of 14N nuclei polarized by OX63. The low gyromagnetic ratio of 14N provides a better resolution to probe the fine structure of the underlying EPR spectra by measuring the microwave frequency profile of the DNP. Although proton mediated 14N DNP had been described,30 direct dynamic nuclear polarization of 14N had not been previously reported.Fig. 7 shows the dependency of the 14N NMR signal intensity on microwave frequency, measured point-by-point after polarizing identical samples by carrying out the following polarization protocol. Identical solutions were first rapidly cooled to 1.4 K, polarized for one hour, dissolved and rapidly transferred to the spectrometer to measure liquid-state 14N NMR.
In addition to the expected pair of positive and negative bands, additional weaker side bands are observed at higher and lower frequencies from the main polarization bands. The frequency difference between the major and minor bands (around 40–45 MHz) is similar to the separation between the central line and the side bands observed in the X-band EPR spectra, suggesting that the unusual DNP profile also reflects the presence of radical clusters.
15N-choline DNP using OX63
Gabellieri et al.31 showed that dynamic nuclear polarization using OX63 could be used to enhance the signal from 15N choline in order to directly monitor the activity of choline kinase, an important target for anticancer drugs.Choline and TMA have a similar quaternary ammonium center. Similar to the case of TMA, X-band CW-EPR spectra of OX63 in the presence of 1 M choline obtained after direct cooling to 2.6 K showed the presence of side bands and half-field signals indicative of the formation of OX63 dimers (Fig. S12 and S13, ESI†) that are reduced by annealing. As in the case of TMA containing samples, annealing enhances electron relaxation, reducing saturation effects (Fig. S14, ESI†).
Although essential for DNP, paramagnetic agents also accelerate the loss of polarization by relaxation during the dissolution and transfer to the NMR spectrometer of hyperpolarized samples. Formation of complexes between tetraalkylammonium salts and OX63 can enhance this effect.
Table 2 compares the 1H-relaxation rates of methyl groups in TMA, choline, pyruvate, and a 1![[thin space (1/6-em)]](https://www.rsc.org/images/entities/char_2009.gif) :
:![[thin space (1/6-em)]](https://www.rsc.org/images/entities/char_2009.gif) 1 mixture of TMA and choline in the absence and in the presence of 0.38 mM OX63. This is the concentration achieved after the transfer process of a 15 mM OX63 sample, which implies a 40-fold dilution. At these concentrations OX63 remains monomeric.
1 mixture of TMA and choline in the absence and in the presence of 0.38 mM OX63. This is the concentration achieved after the transfer process of a 15 mM OX63 sample, which implies a 40-fold dilution. At these concentrations OX63 remains monomeric.
| R 1 (s−1) | TMA | Choline | TMA (choline) | Choline (TMA) | Pyruvate |
|---|---|---|---|---|---|
| a OX63 was added at 0.38 mM concentration. TMA, choline and pyruvate concentrations were 25 mM. Samples with TMA and choline were 25 mM in both compounds. Δ is the difference in R1 with and without OX63. Measurements were done by inversion-recovery on a 500 MHz spectrometer. | |||||
| Without OX63 | 0.137 | 0.385 | — | — | 0.130 |
| With OX63 | 0.227 | 0.476 | 0.208 | 0.435 | 0.141 |
| Δ | 0.090 | 0.091 | 0.071 | 0.050 | 0.011 |
The OX63-induced increase in R1 is nearly ten-fold higher in the tetraalkylammonium salts than in pyruvate and the competition between TMA and choline significantly reduces the effect of OX63. These results confirm that paramagnetic relaxation of TMA and choline is enhanced by the formation of complexes with OX63.
TMA competition could be used to increase the effective enhancement of choline NMR sensitivity achieved by dissolution DNP. The relative intensities of transferred 15N-choline polarized at two OX63 concentrations and in the presence or absence of 1 M TMA are shown in Table 3. When experiments with the same radical concentration are compared the enhancements are around 18% and 42% at 15 mM and 30 mM OX63, respectively. The optimal conditions (15 mM OX63 and 1 M TMA) give nearly 60% higher enhancement than using 30 mM OX63 without TMA. Unfortunately these improvements cannot be directly translated into clinical applications due to TMA toxicity but prove the principle that a decrease in choline binding to OX63 could be used to increase choline polarization. Recently, choline-based formulations have been suggested to enhance polarization of carboxylic acids and urea.32 The formation of complexes between OX63 and choline should be taken into account in these experiments.
| 0 M TMA | 1 M TMA | |
|---|---|---|
a After 1.5 hours of polarization at 94.120 GHz in glycerol![[thin space (1/6-em)]](https://www.rsc.org/images/entities/char_2009.gif) : :![[thin space (1/6-em)]](https://www.rsc.org/images/entities/char_2009.gif) H2O H2O![[thin space (1/6-em)]](https://www.rsc.org/images/entities/char_2009.gif) : :![[thin space (1/6-em)]](https://www.rsc.org/images/entities/char_2009.gif) D2O (50 D2O (50![[thin space (1/6-em)]](https://www.rsc.org/images/entities/char_2009.gif) : :![[thin space (1/6-em)]](https://www.rsc.org/images/entities/char_2009.gif) 45 45![[thin space (1/6-em)]](https://www.rsc.org/images/entities/char_2009.gif) : :![[thin space (1/6-em)]](https://www.rsc.org/images/entities/char_2009.gif) 5). Enhancements were calculated by comparison with the same samples after thermal equilibration. The absolute enhancement in 30 mM OX63 without TMA is 1019, not corrected for the temperature jump. 5). Enhancements were calculated by comparison with the same samples after thermal equilibration. The absolute enhancement in 30 mM OX63 without TMA is 1019, not corrected for the temperature jump.
|
||
| 15 mM OX63 | 1.35 | 1.59 |
| 30 mM OX63 | 1 | 1.42 |
Experimental section
OX63 (tris-(8-carboxyl-2,2,6,6-tetrakis(2-hydroxyethyl)-1,3,5,7-tetrathia-2,6-dihydro-s-indacene-4-yl)methyl sodium salt) was purchased from Oxford Instruments and used without further purification. TMA and choline were obtained from Sigma. 15N-choline was obtained from Cambridge Isotope Labs. 13C-methyl-tetramethylammonium was prepared by reaction of trimethylamine and 13C-iodomethane (both from Sigma) and was purified as the nitrate salt.UV spectra were recorded on a JASCO V-650 instrument at 298 K and pH 7.0 in carefully degassed 10 mM phosphate buffer using cells with light paths from 1 cm to 0.01 cm. The measurements were carried out in triplicate.
Ion mobility mass spectrometry experiments were performed on a Synapt G1 HDMS instrument (Waters, Manchester, UK) vacuum-modified for optimal transmission of non-covalent ions. Ions were produced by nanoESI using a Triversa Nanomate system (Advion BioSciences, Ithaca, NY, USA).
X-band continuous-wave (CW) EPR spectra were recorded on a Bruker ESP300E spectrometer equipped with a liquid helium cryostat (Oxford Inc.), allowing operation from room temperature down to 2.5 K. A modulation frequency of 100 kHz was used. Details about temperature, microwave frequency and power are given in the figure captions. The samples were evacuated at 1 mbar to remove excess O2.
Magnetic measurements were performed using a commercial SQUID magnetometer (MPMS_XL from Quantum Design), which is equipped with high sensitivity and continuous cooling option. The latter option enables the realization of measurements in the temperature region below 4 K for arbitrary long periods of time. Temperature stability was independently measured using a control LaEr sample.
DNP experiments were performed on a HyperSense (Oxford Instruments) with a 3.5 T magnet and capacity for direct measurement of 13C magnetization of the frozen sample. After dissolution the NMR experiments were acquired on an 11.7 T (500 MHz) Varian Unity + spectrometer.
14N hyperpolarization experiments were performed in samples of 1 M tetramethylammonium chloride (TMA) dissolved in glycerol/water (1![[thin space (1/6-em)]](https://www.rsc.org/images/entities/char_2009.gif) :
:![[thin space (1/6-em)]](https://www.rsc.org/images/entities/char_2009.gif) 1) at an OX63 radical concentration of 15 mM. After 1 hour polarization, the samples were transferred using 4 ml of H2O–EDTA (0.01%) solution within 2.5 s to a 10 mm NMR tube for NMR measurements.
1) at an OX63 radical concentration of 15 mM. After 1 hour polarization, the samples were transferred using 4 ml of H2O–EDTA (0.01%) solution within 2.5 s to a 10 mm NMR tube for NMR measurements.
The density functional theory (DFT) calculations were performed using versions 3.0.0, 3.0.1 and 3.0.2 of the Orca package.18 The pure, gradient-corrected Becke–Perdew functional BP86 was chosen for the geometry optimizations.33 The resolution of the identity approximation34 using the standard Ahlrichs auxiliary basis set35 was included to speed up the calculations. A finer than standard integration grid (grid 4 in Orca notation) was used to reduce the numerical noise in the SCF, and the very tight criterion was used for the SCF convergence to reduce the noise in the geometry optimization. Nevertheless, complete convergence of the dimer structures was very difficult to achieve, because the potential energy surface is very flat for the torsional coordinates of the hydroxyethyl chains. These optimizations were stopped after the maxima of the energy oscillations showed a clear stabilization, and the highest of these maxima was taken as the final energy. Therefore, these values are somewhat less accurate than the monomer energies, and have been rounded to kcal mol−1. The parameters used for the conductor-like screening model (COSMO) were 53 for permittivity and 1.4 for the refraction index. These are approximate values for a 50% glycol–water mixture at low temperature.36 Molecular graphics were prepared using the UCSF Chimera package.37 The Iglo II basis set used for property calculations is not defined for sodium atoms, for which the def2-SVP basis set was used instead. The “chain of spheres” approximation was used to speed up the calculation of HF exchange for the B3LYP functional.38a The spin–orbit coupling operator needed for calculating the g tensor and the zero field splitting (ZFS) was evaluated through the effective potential/mean-field approach38b with the most accurate choice available for the SOC flags (1,3,3,1, see the Orca manual for details). The origin for the angular momentum was taken at the center of the electronic charge. For details of the calculation of the ZFS tensor, see ref. 38c.
Conclusions
OX63 is one of the most widely used radicals in DNP and has been generally assumed to be monomeric under the usual DNP conditions. Our results clearly show that OX63 self-associates at neutral pH at concentrations above 1–2 mM, much lower than the usual DNP concentrations of 15 mM or higher. Previous intriguing results indicating that the cross-effect of thermal mixing plays an important role in OX63 polarization can be rationalized by our findings.39,40Intramolecular hydrogen bonding by the hydroxyethyl groups induces a dome-shaped conformation with a ligand-binding cavity. A TMA molecule fits well in this cavity, and intermolecular hydrogen bonding with a second OX63 dome gives rise to endohedral dimer capsules.
Complex formation between OX63 and TMA or choline strongly affects nuclear relaxation and reduces the achievable polarization in dissolution DNP.
Finally, self-assembled dimers formed by OX63 radicals with encapsulated TMA represent a new family of supramolecular species in which the interaction between persistent trityl radicals could be modulated by host–guest interactions. It is envisioned that modification of the substituents in trityl radicals could lead to the design of new materials.
Abbreviations
| DNP | Dynamic nuclear polarization |
| TMA | Tetramethyl ammonium |
| DFT | Density functional theory |
| ESI | Electrospray ionization |
| CASSCF | Complete active space self-consistent field |
Acknowledgements
We thank Prof. Shimon Vega, Prof. Daniella Goldfarb and Dr Frederic Mentink for useful discussions; Prof. Javier Tejada and Sergi Lendinez for preliminary SQUID measurements; Sotiris Katsikis, Christian Ludwig and Dr Ulrich Günther for granting access to their HyperSense instrument and Agilent for the kind loan of the NMR probe used for detecting 14N. We acknowledge the use of the facilities at “Centres Científics I Tecnològics” of the University of Barcelona and the NMR ICTS. This work was supported in part by funds from the Spanish government (BIO2010-15683, BIO2013-45793R, MAT2012-38318-C03-01 and Juan de la Cierva), the Catalan government (2009SGR1352 and Beatriu de Pinós), the European Commission (BioNMR contract 261863) and the COST action (TD1103). The Hypersense instrument and project BIO2013-45793R are co-financed by structural funds (FEDER) from the EU.Notes and references
- D. A. Hall, Science, 1997, 276, 930–932 CrossRef CAS PubMed.
- M. Rosay, J. C. Lansing, K. C. Haddad, W. W. Bachovchin, J. Herzfeld, R. J. Temkin and R. G. Griffin, J. Am. Chem. Soc., 2003, 125, 13626–13627 CrossRef CAS PubMed.
- M. Renault, S. Pawsey, M. P. Bos, E. J. Koers, D. Nand, R. Tommassen-van Boxtel, M. Rosay, J. Tommassen, W. E. Maas and M. Baldus, Angew. Chem., Int. Ed., 2012, 51, 2998–3001 CrossRef CAS PubMed.
- M. Lelli, D. Gajan, A. Lesage, M. A. Caporini, V. Vitzthum, P. Miéville, F. Héroguel, F. Rascón, A. Roussey, C. Thieuleux, M. Boualleg, L. Veyre, G. Bodenhausen, C. Coperet and L. Emsley, J. Am. Chem. Soc., 2011, 133, 2104–2107 CrossRef CAS PubMed.
- K. Golman, Proc. Natl. Acad. Sci. U. S. A., 2006, 103, 11270–11275 CrossRef CAS PubMed.
- F. A. Gallagher, M. I. Kettunen, S. E. Day, D.-E. Hu, J. H. Ardenkjær-Larsen, R. in 't Zandt, P. R. Jensen, M. Karlsson, K. Golman, M. H. Lerche and K. M. Brindle, Nature, 2008, 453, 940–943 CrossRef CAS PubMed.
- S. J. Nelson, J. Kurhanewicz, D. B. Vigneron, P. E. Z. Larson, A. L. Harzstark, M. Ferrone, M. van Criekinge, J. W. Chang, R. Bok, I. Park, G. Reed, L. Carvajal, E. J. Small, P. Munster, V. K. Weinberg, J. H. Ardenkjaer-Larsen, A. P. Chen, R. E. Hurd, L.-I. Odegardstuen, F. J. Robb, J. Tropp and J. A. Murray, Sci. Transl. Med., 2013, 5, 198ra108 Search PubMed.
- J. H. Ardenkjær-Larsen, I. Laursen, I. Leunbach, G. Ehnholm, L.-G. Wistrand, J. S. Petersson and K. J. Golman, Magn. Reson., 1998, 133, 1–12 CrossRef PubMed.
- J. H. Ardenkjær-Larsen, B. Fridlund, A. Gram, G. Hansson, L. Hansson, M. H. Lerche, R. Servin, M. Thaning and K. Golman, Proc. Natl. Acad. Sci. U. S. A., 2003, 100, 10158–10163 CrossRef PubMed.
- J. Rebek Jr., Acc. Chem. Res., 2009, 42, 1660–1668 CrossRef PubMed.
- C. R. Cantor and P. R. Schimmel, Biophysical Chemistry Part II. Techniques for the study of biological structure and function, W.H. Freeman and co., San Francisco, 1980, pp. 349–408 Search PubMed.
- A. J. Fielding, P. J. Carl, G. R. Eaton and S. S. Eaton, Appl. Magn. Reson., 2005, 28, 231–238 CrossRef CAS.
- (a) M. K. Bowman, C. Mailer and H. J. Halpern, J. Magn. Reson., 2005, 172, 254–267 CrossRef CAS PubMed; (b) R. Owenius, G. R. Eaton and S. S. Eaton, J. Magn. Reson., 2005, 172, 168–175 CrossRef CAS PubMed.
- (a) A. Schaefer, H. Horn and R. Ahlrichs, J. Chem. Phys., 1992, 97, 2571–2577 CrossRef CAS; (b) F. Weigend and R. Ahlrichs, Phys. Chem. Chem. Phys., 2005, 7, 3297–3305 RSC.
- (a) S. Grimme, J. Antony, S. Ehrlich and H. Krieg, J. Chem. Phys., 2010, 132, 154104 CrossRef PubMed; (b) S. Grimme, S. Ehrlich and L. Goerigk, J. Comput. Chem., 2011, 32, 1456–1465 CrossRef CAS PubMed.
- H. Kruse and S. Grimme, J. Chem. Phys., 2012, 136, 154101 CrossRef PubMed.
- S. Sinnecker, A. Rajendran, A. Klamt, M. Diedenhofen and F. Neese, J. Phys. Chem. A, 2006, 110, 2235–2245 CrossRef CAS PubMed.
- F. Neese, Wiley Interdiscip. Rev.: Comput. Mol. Sci., 2012, 2, 73–78 CrossRef CAS.
- R. Wyler, J. De Mendoza and J. Rebek Jr., Angew. Chem., Int. Ed. Engl., 1993, 32, 1699–1701 CrossRef.
- K. D. Shimizu and J. Rebek Jr., Proc. Natl. Acad. Sci. U. S. A., 1995, 92, 12403–12407 CrossRef CAS.
- O. Mogck, V. Boehmer and W. Vogt, Tetrahedron, 1996, 52, 8489–8496 CrossRef CAS.
- O. Mogck, M. Pons, V. Böhmer and W. Vogt, J. Am. Chem. Soc., 1997, 119, 5706–5712 CrossRef CAS.
- J. O. Magrans, A. R. Ortiz, M. A. Molins, P. H. P. Lebouille, J. Sánchez-Quesada, P. Prados, M. Pons, F. Gago and J. de Mendoza, Angew. Chem., Int. Ed. Engl., 1996, 35, 1712–1715 CrossRef CAS.
- (a) A. D. Becke, J. Chem. Phys., 1993, 98, 5648–5652 CrossRef CAS; (b) C. Lee, W. Yang and R. G. Parr, Phys. Rev. B: Condens. Matter Mater. Phys., 1988, 37, 785–789 CrossRef CAS; (c) B. Miehlich, A. Savin, H. Stoll and H. Preuss, Chem. Phys. Lett., 1989, 157, 200–206 CrossRef CAS.
- W. Kutzelnigg, U. Fleischer and M. Schindler, The IGLO-Method: Ab Initio Calculation and Interpretation of NMR Chemical Shifts and Magnetic Susceptibilities, NMR Basic Principles and Progress, Springer-Verlag, 1990, vol. 23, p. 165 Search PubMed.
- G. E. Pake and T. L. Estle, The Physical Principles of Electron Paramagnetic Resonance, W. A. Benjamin Inc., 1973, p. 175 Search PubMed.
- (a) O. Loboda, B. Minaev, O. Vahtras, B. Schimmelpfennig, H. Agren, K. Ruud and D. Jonsson, Chem. Phys., 2003, 286, 127–137 CrossRef CAS; (b) O. Loboda, I. Tunell, B. Minaev and H. Agren, Chem. Phys., 2005, 312, 299–309 CrossRef CAS.
- S. Sinnecker and F. Neese, J. Phys. Chem. A, 2006, 110, 12267–12275 CrossRef CAS PubMed.
- A. Bencini and D. Gatteschi, Electron Paramagnetic Resonance of Exchange Coupled systems, Springer-Verlag, 1990, p. 2 Search PubMed.
- V. Vitzthum, M. A. Caporini and G. J. Bodenhausen, Magn. Reson., 2010, 205, 177–179 CrossRef CAS PubMed.
- C. Gabellieri, S. Reynolds, A. Lavie, G. S. Payne, M. O. Leach and T. R. Eykyn, J. Am. Chem. Soc., 2008, 130, 4598–4599 CrossRef CAS PubMed.
- S. Bowen and J. H. Andenkjaer-Larsen, J. Magn. Reson., 2013, 236, 26–30 CrossRef CAS PubMed.
- (a) A. D. Becke, Phys. Rev. A: At., Mol., Opt. Phys., 1988, 38, 3098–3100 CrossRef CAS; (b) J. P. Perdew, Phys. Rev. B: Condens. Matter Mater. Phys., 1986, 33, 8822–8824 CrossRef.
- E. J. Baerends, D. E. Ellis and P. Ros, Chem. Phys., 1973, 2, 41–51 CrossRef CAS; J. L. Whitten, J. Chem. Phys., 1973, 58, 4496–4501 CrossRef.
- K. Eichkorn, O. Treutler, H. Ohm, M. Haser and R. Ahlrichs, Chem. Phys. Lett., 1995, 240, 283–290 CrossRef CAS.
- J. R. Huck, G. A. Noyel and L. Jorat, IEEE Trans. Electr. Insul., 1988, 23, 627–638 CrossRef CAS.
- E. F. Pettersen, T. D. Goddard, C. C. Huang, G. S. Couch, D. M. Greenblatt, E. C. Meng and T. E. Ferrin, J. Comput. Chem., 2004, 25, 1605–1612 CrossRef CAS PubMed.
- (a) F. Neese, F. Wennmohs, A. Hansen and U. Becker, Chem. Phys., 2009, 356, 98–109 CrossRef CAS; (b) F. Neese, J. Chem. Phys., 2005, 122, 034107 CrossRef PubMed; (c) F. Neese, J. Chem. Phys., 2007, 127, 164112 CrossRef PubMed.
- T. Maly, L. B. Andreas, A. A. Smith and R. G. Griffin, Phys. Chem. Chem. Phys., 2010, 12, 5872–5878 RSC.
- V. K. Michaelis, B. Corzilius, A. A. Smith and R. G. Griffin, J. Phys. Chem. B, 2013, 117, 14894–14906 CAS.
Footnote |
| † Electronic supplementary information (ESI) available: UV-vis, EPR, and ESI-mass spectra recorded at various concentrations. Control experiments of SQUID measurements. Experiments carried out in the presence of choline. Additional DFT results. See DOI: 10.1039/c4cp05225k |
| This journal is © the Owner Societies 2015 |

