 Open Access Article
Creative Commons Attribution 3.0 Unported Licence
Towards improving the robustness of electrochemical gas sensors: impact of PMMA addition on the sensing of oxygen in an ionic liquid†
Junqiao
Lee
,
Gert
Du Plessis
,
Damien W. M.
Arrigan
and
Debbie S.
Silvester
*
Nanochemistry Research Institute, Department of Chemistry, Curtin University, GPO Box U1987, Perth, Western Australia 6845, Australia. E-mail: d.silvester-dean@curtin.edu.au; Fax: +61 892662300; Tel: +61 892667148
First published on 18th May 2015
Abstract
The electrochemical reduction of oxygen (O2) has been studied on commercially-available integrated Pt thin-film electrodes (TFEs). Chemically reversible (but electrochemically quasi-reversible) cyclic voltammetry was observed in the room temperature ionic liquid (RTIL) 1-ethyl-3-methylimidazolium bis(trifluoromethylsulfonyl)imide ([C2mim][NTf2]), showing superior behaviour of TFEs compared to screen-printed electrodes for oxygen sensing. As a step towards the preparation of robust gas sensors, the RTIL was mechanically stabilised on the TFE surface by the addition of poly(methyl methacrylate) (PMMA). At a PMMA concentration in the RTIL of ca. 50% mass, electrolyte flow was not evident. O2 reduction peak currents were found to decrease systematically with increasing PMMA content, reflecting the higher viscosity of the electrolyte medium. Linear calibration graphs were obtained for 0–100% vol. oxygen at all PMMA–RTIL mixtures studied. The sensitivities decreased as [PMMA] increased, but the limits of detection were relatively unchanged. Mechanical stability of the sensors was tested in different orientations (flat, upside down, sideways) with both the neat RTIL and 50% mass electrolyte. Whilst the electrochemical responses were dramatically changed for the neat RTIL, the responses in the PMMA–RTIL mixture were independent of electrode orientation. Additionally, the oxygen response in the PMMA–RTIL mixture was less affected by atmospheric impurities and moisture, compared to the neat RTIL. This suggests that these low-cost miniaturised devices can successfully be used for oxygen sensing applications in field situations, especially where portability is essential.
1. Introduction
Amperometric gas sensors have been extensively used over the past several decades for measuring target gases including oxygen, carbon dioxide and hydrogen sulphide.1 Many commercial sensors comprise of three electrodes (working, counter and reference) connected by an electrolyte and covered by a gas-permeable membrane. In recent years, room temperature ionic liquids (RTILs) have been investigated as a replacement for traditional electrolytes in sensors due to their many favourable properties including wide electrochemical windows, intrinsic conductivity, high chemical and physical stability and the ability to dissolve a wide range of analyte gases.2–6 In particular, the non-volatile nature of RTILs eliminates the need for a membrane, and they have been suggested as electrolytes in “membrane-free” gas sensors.2 The removal of the membrane (where gases typically diffuse quite slowly) simplifies the rate of transport of analyte to the electrode surface, but the higher viscosity of the ionic liquid (i.e. lower analyte diffusion) also has to be taken into account when considering currents and response times.2Various electrode surfaces have been suggested for RTIL-based membrane-free gas sensing including traditional macrodisk and microdisk electrodes (see review by Rogers et al.),7 and more recently, devices where the working electrode is integrated with the reference and counter electrodes onto a single plane, typically requiring only very small volumes of RTIL electrolyte (e.g. a few μL) and allowing for miniaturisation of the sensor device. For example a gold disk integrated electrode was used for ethylene gas detection,8 and a platinum disk integrated electrode was used for the detection of NOx (nitric oxide and nitrogen dioxide).9 Oxygen sensing was performed on a gold microelectrode array,10 Pt and Cu microband electrodes,11 and Pt disk electrode,12 all with working electrode surfaces integrated with the counter and reference electrode onto a planar substrate. Additionally, disposable screen-printed electrodes (SPEs) have been used for ammonia13 and oxygen14,15 sensing.
In this work, we employ a new type of commercially-available integrated electrode, a so-called “thin film electrode” (TFE) for the detection of oxygen gas. Oxygen has been chosen as the target gas since its electrochemistry in RTILs is well understood at conventional electrodes where it undergoes a chemically reversible (but electrochemically quasi-reversible) one-electron reduction to superoxide.7 The oxygen reduction reaction is also important in various applications including metal–air batteries16 and fuel cells.17,18 The TFE employed is low-cost (only a few € Euro per unit) due to the small size and small amount of Pt metal used. Importantly, the electrode surface is purely metal-based, and does not contain additional materials such as polymers/binders that have been shown to complicate the electrochemical response for oxygen reduction, as described in our recent work for oxygen reduction in imidazolium RTILs on several SPE surfaces (platinum, gold, carbon and silver).14
However, one of the issues with “membrane-free” sensors is that they are not very robust for portable applications due to electrolyte leakage e.g. if the sensor is turned on its side. Although not containing ionic liquids, Panchompoo et al.19 have proposed a “membrane-less and spill-less” oxygen gas sensor employing a SPE covered with a ferrofluid containing iron oxide nanoparticles and a cationic polymer, poly(diallyldimethyl ammonium chloride). Several small magnets were placed on the underside of the electrode and the electrolyte did not visibly flow when a magnetic field was applied. A good response was seen, with linear current responses for oxygen reduction from 0 to 100% vol. oxygen. The ability to have a spill-less electrolyte could prevent problems such as leakage onto the electronics of a device, and instability due to movement during portable use (e.g. on the clothing of personnel exposed to gases or installed in vehicles). The aim of this work is to improve the mechanical robustness of a gas sensor, by incorporating a mixture of polymer and RTIL, called a gel polymer electrolyte (GPE).
Various polymers have been suggested for use in GPEs due to their practical significance in lithium-ion batteries, as summarised in a review paper by Song et al.20 GPEs have also been used specifically for electrochemical gas sensing applications. For example, Nadherna et al.21,22 used RTILs mixed with partially cross-linked poly(ethylene glycol)methyl ether (PEGMEMA) on a gold minigrid indicator electrode for the detection of NO2 gas. Carvalho et al.23 created an “ion-jelly” by mixing ionic liquids with a biopolymer (gelatin) for the sensing of eight different volatile organic compound vapours. Zhang et al.24 used a hydrogel modified electrode with agarose and a RTIL on a Pt microelectrode for oxygen detection. An oxygen gas sensor using a RTIL–porous polyethylene membrane coated electrode was suggested by Wang et al.25 Additionally, wearable/flexible sensors for oxygen26 and sulfur dioxide27 consisting of a membrane coated electrode have also been suggested. In both cases, the membrane contained a RTIL and porous polytetrafluoroethylene (PTFE).
In this study, poly(methyl methacrylate) (PMMA) was chosen as the polymer for preparation of GPEs with the RTIL. PMMA is an amorphous polymer and does not form rigid crystalline phases within the GPE. This is crucial for electrochemical-based sensing to ensure high levels of ionic-conductivity due to the fluidity of the PMMA molecules.20 This is the reason (in addition to the miscibility of PMMA with ionic liquids) that this polymer was chosen for our work. The results presented here provide a detailed insight into the effect of adding PMMA polymer into the RTIL electrolyte by studying the electrochemical responses; specifically the oxygen reduction currents, voltammetric peak shapes and analytical responses. The robustness of the TFE/GPE device was evaluated by placing the sensor in various geometries. It is shown that by employing an adequate amount of PMMA to form a physical gel, a robust, spill-less oxygen gas sensor can be easily achieved.
2. Experimental
2.1 Chemical reagents
The RTIL 1-ethyl-3-methylimidazolium bis(trifluoromethylsulfonyl)imide ([C2mim][NTf2]) was synthesized according to standard literature procedures,28 and kindly donated by Professor Christopher Hardacre of Queen's University Belfast, UK. Poly(methyl methacrylate) (PMMA, average MW ca. 15k, Sigma-Aldrich Pty Ltd., NSW, Australia), poly(vinyl chloride) (PVC, MW ca. 48 k, Sigma-Aldrich Pty Ltd., NSW, Australia), acetone (CHROMASOLV®, for HPLC, ≥99.9%, Sigma-Aldrich Pty Ltd., NSW, Australia), ethanol (EtOH 99%, Sigma-Aldrich Pty Ltd., NSW, Australia), tetrabutylammonium perchlorate (TBAP, Fluka, for electrochemical analysis ≥99.0%, Sigma-Aldrich Pty Ltd., NSW, Australia), ferrocene (Fc, 98%, Sigma-Aldrich Pty Ltd., NSW, Australia) were used as received. Ultrapure water (Milli-Q grade water) with a resistivity of 18.2 MΩ cm prepared by a Milli-Q laboratory water purification system (Millipore Pty Ltd., North Ryde, NSW, Australia) and acetonitrile (MeCN 99.8%, Sigma-Aldrich Pty Ltd., NSW, Australia) were used for rinsing the micro and thin-film electrodes before use. High purity oxygen gas (>99.5%) and high purity nitrogen gas (99.99%) cylinders were purchased from BOC Gases (North Ryde, NSW, Australia).2.2 Preparation of PMMA–[C2mim][NTf2] mixtures
Different concentrations of the PMMA–[C2mim][NTf2] mixtures (10–50% mPMMA/mTot) were prepared according to the mixing ratios illustrated in Table S1 in the ESI.† PMMA was accurately weighed into a 2 mL glass vial, and dissolved in 500 μL of acetone (assisted by ultrasonication), before respective aliquots of [C2mim][NTf2] were added to the vial, then shaken. The solutions were left to dry in air overnight to remove any acetone present. Small volumes of acetone (at 5, 10, and 20% vol. of the estimated total volume, VTot, as summarised in Table S1†) acting as the casting solvent was then added to the 30, 40, and 50% mPMMA/mTot sample vials to reduce the viscosity of the PMMA–RTIL mixture so that they could be pipetted onto the electrode. It is noted that acetone was shown not to react with the electrogenerated superoxide during the electrochemical reduction of O2.29 The volumes of the aliquots used were thus modified accordingly (by increasing the volumes of the aliquots) for those PMMA–RTIL mixture samples. This was done to ensure that the same total volume was present on the electrode for each mixing ratio.2.3 Electrochemical experiments
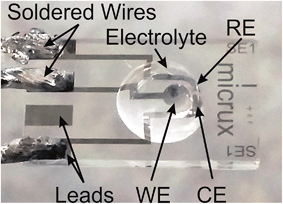
All voltammetric experiments were performed using a μ-Autolab Type III potentiostat (Eco-Chemie, Netherlands) interfaced to a PC with NOVA 1.8 software, recorded with a step potential of 2.5 mV. All experiments were carried out with the electrodes positioned inside a custom-made aluminium Faraday cage (Fig. S1, ESI†) to reduce ambient electromagnetic interferences (used as routine in all experiments within our laboratory), and internal temperatures were monitored to be 294 ± 1 K. Electrical wires were soldered onto the connecting leads of the platinum TFEs (Micrux Technologies, Oviedo, Spain) to allow for easy connection to the potentiostat. The working (WE), counter (CE), and reference (RE) electrodes of the integrated electrodes (Ref. ED-SE1-Pt) are all platinum (Pt) deposited onto a Pyrex substrate, and with a manufacturer specified WE-diameter of 1 mm. The TFEs were electrochemically activated in N2-purged 1 M H2SO4(aq) by scanning between 1.5 and −0.3 V (vs. Ag|AgCl) at 1 V s−1 for 100 cycles. For the activation cycles, the TFEs were employed in a conventional 3-electrode arrangement, with a Ag|AgCl|1.0 M KCl(aq) reference (BASi, Indiana, USA) and a 0.5 mm diameter platinum coil wire counter electrode (Goodfellow Cambridge Ltd., UK), inserted into a small home-made glass pot designed to hold up to 3 mL of solution. During the electrochemical activation step, all three integrated electrodes of the TFEs were connected as the working electrode to the potentiostat. 1 mL of the 1 M H2SO4(aq) solution was pipetted into the pot, and the solution was bubbled with nitrogen for 15 min before experiments were commenced. The electrochemically activated TFEs were then briefly ultrasonicated in ultrapure water to remove any residual acid, and then rinsed with water, EtOH and MeCN, before drying under a stream of N2.The TFEs were found to be reusable, and only three TFEs were used for all experiments presented in this paper. Between each experiment with a fresh PMMA–[C2mim][NTf2] sample, the TFEs were first ultrasonicated in acetone for 5 minutes (to remove the PMMA–[C2mim][NTf2]), and then rinsed with acetone, followed by a small amount of MeCN, and finally by ultrapure water, before repeating the above electrochemical cleaning protocol. For the oxygen sensing experiments, 10 μL aliquots (adjusted with respect to any %vol. of acetone added) of the PMMA–[C2mim][NTf2] were then drop casted onto the TFE with a micropipette (see Fig. 1), before inserting into a glass cell supported by a rubber bung (see Fig. S1†). The integrated Pt counter and reference electrodes were used for all oxygen sensing experiments.
The electrolyte was left under a N2 environment overnight to allow any O2 and other absorbed gases to be purged, and also to allow for any acetone casting solvent to volatilize before the electrochemical measurements were commenced. Cyclic voltammetry (CV) was conducted at 10 min intervals to ensure that the gas was fully saturated and that the CVs were stable. Approximately 20 minutes was found to be sufficient to saturate the 10 μL aliquot of neat [C2mim][NTf2] with O2 gas. However, at 50% mPMMA/mTot, it took ca. 1 hour to saturate. The saturation/equilibration times are very long, probably due to the relatively large volume of electrolyte used (10 μL) and the slow partitioning of gas from the gas phase into the electrolyte. As a result, the response times for oxygen detection in the various PMMA–RTIL mixtures were not determined. It is expected that response times could be reduced for practical devices if smaller volumes of electrolyte (e.g. thin layers) were employed. The starting potential used for each CV was typically 0 V vs. Pt, and a scan rate of 100 mV s−1 (unless otherwise indicated) was used for the experiments with the PMMA–[C2mim][NTf2] electrolytes. The electrode-electrolyte systems were conditioned by repeated scanning at 100% vol. O2 flow until stable voltammetry was obtained before commencing with the actual experiments (i.e. different O2 concentrations, variable scan rates studies).
Since the integrated Pt RE was used in all experiments, there was significant potential shifting observed on different freshly cleaned electrodes, and during the course of repeat potential scanning. Although it is advantageous to have a stable reference redox couple (e.g. Ag|AgCl|KCl) for sensing applications, the small size and integrated nature of the electrode device makes this very difficult. Various authors have suggested that ferrocene, cobaltocenium or their derivatives can be used as an internal reference in RTILs (i.e. mixed into the electrolyte with the analyte of interest).30–32 However it has also been reported that the currents of an analyte of interest can change in the presence of a second redox species (e.g. for mixtures of ferrocene and cobaltocenium,33 and hydrogen gas and cobaltocenium34 in RTILs). Since this has obvious implications from an analytical perspective (where currents are measured),32 the addition of an internal reference (e.g. ferrocene) into the system was avoided in our experiments; the focus was on the change in voltammetric peak currents, shapes and peak-to-peak separations, not on the absolute values of the potentials.
2.4 Gas mixing set-up
The general experimental setup for the gas-sensing work is illustrated in Fig. S1.† In order to vary the concentrations of oxygen gas, the oxygen line was diluted with a nitrogen carrier gas using a gas mixing system. This consists of two separate digital flow controller systems (labelled F1 and F2, purchased from John Morris Scientific, NSW, Australia) connected via a Swagelok T-joint (Swagelok, Kardinya, WA, Australia). Standard cubic centimetres per minute (sccm) are used as the units to describe the flow rates in this paper. To ensure proper mixing of the gas before it enters the glass T-cell, a flow-constriction “gas-mixing segment” (see enlargement at the top-left of Fig. S1†) as described in a previous publication.14 The relative flow rates of the O2 analyte gas and the inert N2 carrier gas (as monitored by the digital flow meters) were used to calculate the %vol. of O2 introduced into the cell. No attempt was made to dry the gases before entering the cell i.e. no water trap was used. An outlet gas line led from the other arm of the T-cell into a fume cupboard.3. Results and discussion
The thin-film electrode used in this work was chosen due to its relatively low cost and the fact that it is entirely metal-based, in contrast to screen-printed electrodes (SPEs), where unusual follow-up chemistry was observed for O2 reduction in imidazolium-based RTILs.14 In this study, an imidazolium RTIL, [C2mim][NTf2], was purposely chosen since it was one of the ionic liquids that gave chemically irreversible voltammetry on SPEs. Additionally, O2 reduction electrochemistry has been extensively studied in this RTIL on many conventional electrodes and is well understood.2 The polymer chosen for this work was PMMA since it was found to be miscible with the chosen RTIL. PVC was also tried, but significant leaching of the RTIL from the polymer was observed.3.1 Mixtures of PMMA and RTIL [C2mim][NTf2]
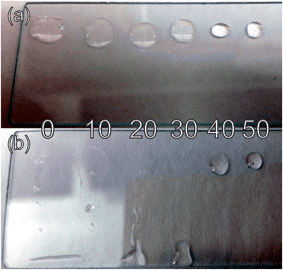
Various percentages of PMMA from 0–50% (by mass) were added to the RTIL to determine at which concentration the mixture is no longer a free-flowing liquid and becomes more “gel”-like. Fig. 2 shows a photograph of different PMMA–RTIL mixtures drop-cast (with a carrier solvent) onto a glass slide and allowed to dry for at least 1 hour. As can be seen in Fig. 2(a), in a flat orientation the mixture is a single droplet at all PMMA concentrations studied. Due to the different surface tensions of the mixtures on the glass slide, the spread of the droplet becomes less with increasing amounts of PMMA, and the contact angles are clearly different (within the range 27–74 degrees, see Table S2 in the ESI†). When the glass slide is placed vertically (Fig. 2(b)), the lower % mixtures flow freely down the glass slide; only the 40 and 50% mPMMA/mTot concentrations are stable in a vertical orientation. The 40% mPMMA/mTot mixture, however, still shows a small amount of flow as seen by the distorted shape of the droplet. At 50% mPMMA/mTot, the droplet appears very stable and this is determined as the concentration at which the mixture becomes “gel”-like. These six concentrations were chosen for use as electrolytes for the electrochemical study of oxygen reduction, to observe the impact of increasing PMMA concentrations on the voltammetric currents, shapes and analytical responses. A doping concentration of only up to 50% mPMMA/mTot was investigated since it was found that the 50% mPMMA/mTot was already sufficiently gellified. Higher PMMA doping levels would further increase the resistivity of the electrolyte (thus lowering sensitivity) and would be unfavorable for sensing purposes.3.2 Oxygen reduction voltammetry on TFEs with different PMMA–RTIL mixing concentrations
Fig. 3 shows cyclic voltammetry for the reduction of oxygen on Pt TFEs covered with a 10 μL droplet of a PMMA–RTIL mixture in the range 0% to 50% mPMMA/mTot. The voltammetry has been arbitrarily shifted on the potential axis so that the mid-points of the O2/O2˙− redox couple are approximately equal, and the reduction peak currents are presented in Table 1. The values given show the average of three independent measurements for each PMMA–RTIL concentration where a fresh film was made up for each measurement. The errors are the standard deviations of the three separate measurements, showing a small amount of variability between each measurement.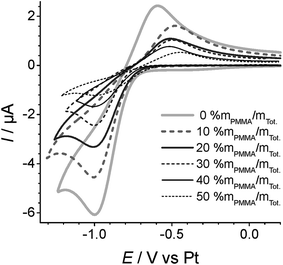 | ||
| Fig. 3 Overlayed cyclic voltammograms of O2/O2˙− redox couple, measured at 100 mV s−1 and subjected to 100% vol. O2vs. a Pt pseudo-RE for varying concentrations (0–50% mPMMA/mTot) of PMMA doping. | ||
| [PMMA]/%mPMMA/mTot | −Ip/μA | ΔEp–p/mV | Equation of calibration graph (where I/A and [O2]/%vol.) | R 2 | LOD/%vol. |
|---|---|---|---|---|---|
| 0 | 5.74 ± 0.13 | 413 ± 6 | −I = 5.84 × 10⁻⁸[O2] + 1.22 × 10⁻⁸ | 0.999 | 4.2 |
| 10 | 4.46 ± 0.35 | 492 ± 33 | −I = 4.12 × 10⁻⁸[O2] − 8.39 × 10⁻⁹ | 0.998 | 5.1 |
| 20 | 2.88 ± 0.20 | 496 ± 1 | −I = 2.96 × 10⁻⁸[O2] + 2.00 × 10⁻⁷ | 0.997 | 6.5 |
| 30 | 2.33 ± 0.14 | 520 ± 36 | −I = 2.46 × 10⁻⁸[O2] − 1.06 × 10⁻⁷ | 0.999 | 4.1 |
| 40 | 1.77 ± 0.11 | 527 ± 39 | −I = 1.64 × 10⁻⁸[O2] + 5.23 × 10⁻⁸ | 0.999 | 4.0 |
| 50 | 1.26 ± 0.12 | 527 ± 76 | −I = 1.12 × 10⁻⁸[O2] + 7.18 × 10⁻⁸ | 0.998 | 5.4 |
It is important to note here that oxygen reduction is chemically reversible on the Pt TFE. Our previous work on oxygen reduction on commercially-available screen-printed electrodes showed that the O2 reduction wave was chemically irreversible due to a reaction of the electrogenerated superoxide with the components of the screen-printing paste.14 However, the TFEs used in the current work behave more like ideal macrodisk electrodes, but with the added advantages of lower cost (less expensive metal required), easily mass-produced, and being integrated onto a sensing device with the CE and RE, requiring only small volumes of electrolyte (e.g. microliters). This is favourable for developing miniaturised, low-cost devices for oxygen sensing.
The peak-to-peak separations (ΔEp–p) vary from 382 to 527 mV for the different PMMA–RTIL mixtures studied, with the more separated peaks occurring for the electrolytes with higher PMMA content. This is unsurprising since the electrolytes are more viscous, resulting in slower ion movement and an increase in resistance (i.e. higher Ohmic drop contribution). The peak-to-peak separations are all larger than that reported on an ideal Pt macrodisk electrode (314 mV at 100 mV s−1 in neat [C2mim][NTf2]),14 suggesting that the surface state of the TFE may not be as ideal as a freshly polished macrodisk electrode. In the ESI,† CVs for the reduction of oxygen at a range of scan rates for all PMMA contents are also presented (Fig. S2†). In all cases, the plots of peak current vs. the square root of scan rate are linear (Fig. S3†), suggesting that the reduction of oxygen is diffusion controlled. It can be seen from Fig. S2† that the scans become much more distorted at higher scan rates (e.g. 3 V s−1) in the 50% mPMMA/mTot compared to the neat RTIL. This is probably due to the increased resistance in the more viscous medium resulting in an increased Ohmic drop contribution (which is especially significant on the mm-sized electrode used in this work, compared to, for example, a microdisk electrode). However, the CVs at moderate scan rates (e.g. 100 mV s−1) were less impacted by Ohmic drop and are subsequently used for peak current analysis in this paper.
The extent of the stability of the superoxide reduction product was further probed by normalising the CVs at different scan rates (Fig. S4, ESI†). Generally, it can be seen that the superoxide is stable on the timescale of all CVs at the wide range of scan rates studied (50 to 3000 mV s−1) as shown by the presence of the reverse oxidation peak. The relative height of the superoxide peak does not appear to vary much over all PMMA doping concentrations studied, suggesting that the presence of PMMA does not affect the stability of the electrogenerated superoxide. However, it is clear from the normalised CVs that the peak-to-peak separation increases more substantially at higher PMMA doping concentrations, as would be expected in more viscous electrolytes.
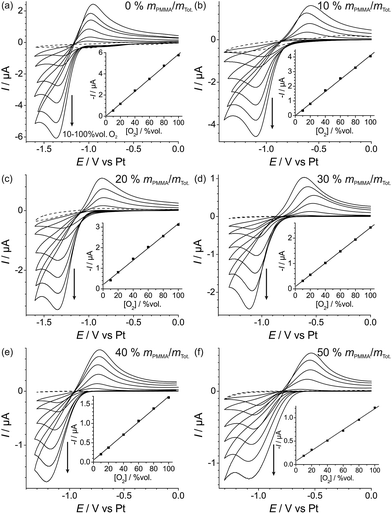
In order to test the analytical performances of the electrodes at different PMMA–RTIL concentrations, the reduction of oxygen was studied at a range of concentrations of O2 in the flow. Fig. 4 shows the voltammetry for oxygen reduction at 10–100% vol. O2 concentration, with the response in the absence of oxygen shown as the dotted line. As can be seen, chemically reversible voltammetry is observed at all oxygen concentrations for all PMMA–RTIL mixtures studied. The insets show the corresponding calibration graphs of reduction peak current (baseline corrected) vs. concentration and the lines of best fit. The equations of the linear regression lines are given in Table 1 with the R2 values all 0.997 or above, showing excellent linear fitting. From these calibration graphs, the limits of detection (LODs) were obtained and found to vary from 4.0 to 6.5% vol. O2 over the PMMA concentrations studied (see Table 1). However, the data are relatively scattered, suggesting that there is no systematic effect of PMMA content on the LOD for oxygen sensing. The reason for the scattering is likely to be due to experimental variations in measuring the currents at different concentrations, and probably not due to large scattering of background noise, as low background currents are observed in the CVs (see Fig. 4).
Fig. 5 shows a plot of the sensitivity (gradient of the calibration graph) at each PMMA–RTIL concentration. The sensitivity is observed to decrease systematically with increasing %mPMMA/mTot, which is unsurprising given the higher viscosity of the mixture as more PMMA is added. The higher viscosity will likely result in lower diffusion coefficients and hence smaller current responses for oxygen as observed in Fig. 3. Of course, the solubility of oxygen in the various mixtures will also influence the peak currents and sensitivities. The error bars associated with the plot in Fig. 5 are shown as 3.3 standard deviations of the slope (99.99% confidence interval), from three repeat measurements at each PMMA–RTIL mixture, and show quite good reproducibility.
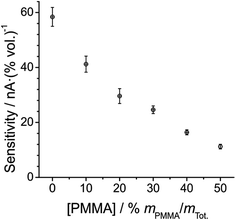 | ||
| Fig. 5 Plot of sensitivity vs. [PMMA] at each PMMA–RTIL mixture studied, from the data in Table 1. The error bars presented are the 99.9% confidence intervals (3.3 standard deviations) of the slopes of the linearly fitted calibration data from three separate measurements. | ||
3.3 Effect of changing the electrode orientation on oxygen reduction voltammetry: neat vs. gelled RTIL
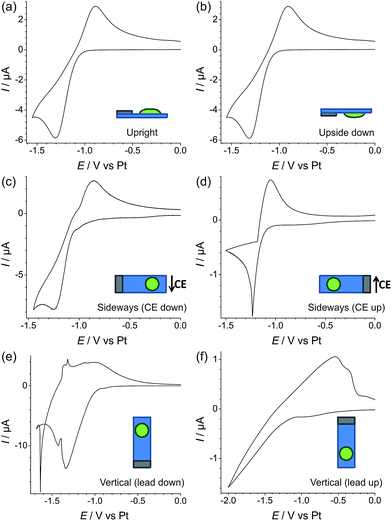
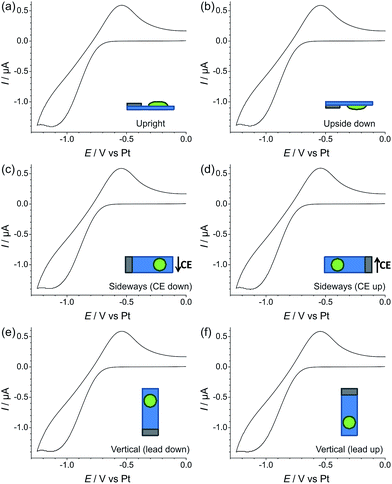
In order to test the robustness of the electrode for a gas sensing application, the reduction of 100% vol. oxygen was performed on Pt TFEs at different orientations (upright, upside down, sideways with the CE down, sideways with the CE up, vertical with the electrical contacts down, and vertical with the electrical contacts up). The experiments were performed with both the neat RTIL (Fig. 6) and the 50% mPMMA/mTot gelled mixture (Fig. 7). In each experiment, a stable voltammogram was first obtained at a flat/upright orientation before changing the orientation of the TFE and recording cyclic voltammetry.For the neat RTIL (Fig. 6), it is obvious that the voltammetry has significantly changed at different electrode orientations. When the TFE is placed upside down (b), the response is almost identical to the upright TFE (a), with very similar peak currents and peak-to-peak separations. This could be due to surface tension preventing the RTIL from flowing or dropping off the electrode. However, when the electrode is tilted on its side with the CE down (c), some movement of the RTIL was observed, and the voltammetry changes, with a larger peak current and an unstable baseline voltammetry. When the TFE is also on its side, but with the CE up (d), the voltammetry changes significantly, with less than one third of the original peak current, and a very sharp reduction peak. The worst responses are seen when the electrodes are in a vertical orientation (e) and (f). In both cases, the voltammetry does not resemble the reversible redox peaks that are usually observed for oxygen reduction. For easy comparison, an overlay figure at all six orientations is given in Fig. S5(a) of the ESI.† These experiments show that, unlike in Fig. 2 where the neat RTIL flowed off the glass slide, there is still some electrolyte remaining on the TFE to connect the three electrodes (WE, RE and CE).
For the 50% mPMMA/mTot mixture, as shown in Fig. 7, the CV responses at all orientations are almost identical. The overlay figure in Fig. S5(b) of the ESI† shows that the graphs are virtually identical. Not only does this show good reproducibility of the oxygen response, but also suggests that the gelled electrolyte can be used for oxygen gas sensing for applications where the sensor may need to be tilted, moved in any orientation, or subjected to mechanical shocks (e.g. on clothing of personnel exposed to gases, or in a moving vehicle).
3.4 Comments on the reproducibility, reusability and advantages of TFEs
Good reproducibility between different electrodes from two different batches was observed. Table 1 shows standard deviations for 100% vol. O2 on three separately prepared samples on different electrodes, with a percentage relative standard deviation (RSD) of ca. 2% or the neat ionic liquid, and ca. 6% averaged across all the PMMA concentrations investigated. This demonstrates that the fabrication process has been carefully refined, and the reproducibility of the electrodes from batch-to-batch should be sufficient for implementation in real sensor devices. These TFEs were also found to be highly robust and reusable, where only three different TFEs have been employed for all the experiments reported in this paper.The main advantages of TFEs are thus obvious: low-cost, small size, reusability (good responses for at least several months on one electrode) and highly reproducible current responses. Due to the ease of experimental setup (compared to standard Clark type working electrodes), TFEs based sensors would also be ideal for untrained personnel in the field.
However, a build-up of reaction products would also have to be taken into account if employing these electrode/electrolyte systems in real sensors. For example, during long-term experiments (more than 100 CV cycles in the presence of 100% vol. O2), a tarnishing of the electrodes was observed, likely due to a build-up of reaction products e.g. from the counter-electrode reaction (see Fig. S6 in the ESI†). However, these dark-coloured products could be removed by rinsing the electrode with acetonitrile, followed by brief ultrasonication (i.e. 1–3 minutes) in acetone, drying under a stream of nitrogen gas and depositing a new aliquot of PMMA–RTIL mixture (i.e. a subsequent H2SO4 activation step was not absolutely necessary once the electrode was first activated).
3.5 Assessment of the practical utility of the sensor in real gas environments
In order to test if the sensor would perform in a realistic sample gas environment, CV was conducted on both the neat RTIL and the 50% mPMMA/mTot mixture in the presence of different types of air environments (dried, under ambient conditions and humidified). The dried air sample was passed through a regular air scrubber/filtration system in the laboratory building, ambient air was sucked into the cell using a vacuum connected to the electrochemical cell, and humidified air was introduced by bubbling the building's air supply vigorously through a container of water. Fig. S7 in the ESI† shows the CVs obtained in the different air environments, compared to the 20% vol. oxygen reduction CV. Table S3† also shows the reduction peak potentials and peak currents for all the CVs obtained. The addition of PMMA to [C2mim][NTf2] is thought to increase the hydrophobicity of the electrolyte (which can be observed in the increase in contact angles on glass, summarized in Table S2†). For the neat RTIL, an increase in current (∼42%) and broadening of the peaks was observed in the presence of dry air. However, a much larger effect was seen in the presence of ambient and humidified air, with the wave shapes changing dramatically and the peak currents increasing substantially (∼198% for ambient air and 180% for humidified air). However, for the 50% mPMMA/mTot mixture, a less dramatic change in the peak currents was observed, with an 18% increase for dried air, 40% increase for ambient air and 38% increase for humidified air. This suggests that the 50% mPMMA/mTot mixture is less affected by atmospheric moisture impurities, which further supports the use of the PMMA–RTIL gel over the neat RTIL for robust oxygen sensing applications.4. Conclusions
In this work, a new commercially-available integrated electrode has been used for oxygen sensing. Chemically reversible voltammetry was observed for oxygen reduction, similar to that seen on ideal polished macrodisk electrodes, but with slower electrode kinetics on the TFE surface. Both PMMA and PVC were investigated as polymers for mixing with the RTIL, but PVC visibly leached out of the mixture over time resulting in instability of the sensor response. Experiments were conducted at increasing concentrations of PMMA in the PMMA–RTIL mixture, from 0 to 50% mPMMA/mTot. The peak currents systematically decreased with increasing PMMA content, but all mixtures showed diffusion-controlled voltammetry for oxygen reduction. All the mixtures gave chemically reversible voltammetry, but there was an increase in peak-to-peak separations, especially at high PMMA concentrations, suggesting that the iR (Ohmic) drop is greater in the more viscous media. Linear calibration curves were observed for 10–100% vol. oxygen at all PMMA–RTIL mixtures studied. The sensitivity was found to decrease as [PMMA] increases, but there was no systematic effect on the LOD. The different orientation experiments showed significant changes in the voltammetry for O2 reduction in the neat RTIL, but very stable voltammetry was observed for the 50% mPMMA/mTot. These results demonstrate that the addition of PMMA can improve the mechanical stability of the RTIL film, and hence the robustness of sensors incorporating them, whilst having minimal impact on the LOD and a predictable impact on sensitivity. The PMMA–RTIL mixture was also found to be less impacted by the presence of ambient moisture, which could lead to potentially more robust “membrane-less” and “spill-less” sensors for real world gas sensing applications.Acknowledgements
The authors would like to thank Professor Christopher Hardacre at the Queen's University of Belfast, UK for the kind donation of the ionic liquid, and the group of Professor Richard Compton at the University of Oxford, UK for the gift of the microelectrode used in this work. DSS acknowledges the Australian Research Council for funding via a Discovery Early Career Researcher Award (DECRA: DE120101456). JL thanks Curtin University for a Curtin International Postgraduate Research Scholarship.References
- J. R. Stetter and J. Li, Chem. Rev., 2008, 108, 352–366 CrossRef CAS PubMed.
- M. C. Buzzeo, C. Hardacre and R. G. Compton, Anal. Chem., 2004, 76, 4583–4588 CrossRef CAS PubMed.
- D. S. Silvester, Analyst, 2011, 136, 4871–4882 RSC.
- D. S. Silvester and R. G. Compton, Zeitschrift für Physikalische Chemie, 2006, 220, 1247–1274 CrossRef CAS.
- L. E. Barrosse-Antle, A. M. Bond, R. G. Compton, A. M. O'Mahony, E. I. Rogers and D. S. Silvester, Chem.–Asian J., 2010, 5, 202–230 CrossRef CAS PubMed.
- M. C. Buzzeo, R. G. Evans and R. G. Compton, Phys. Chem. Chem. Phys., 2004, 5, 1106–1120 CAS.
- E. I. Rogers, A. M. O'Mahony, L. Aldous and R. G. Compton, ECS Trans., 2010, 33, 473–502 CAS.
- M. A. G. Zevenbergen, D. Wouters, V. A. T. Dam, S. H. Brongersma and M. Crego-Calama, IEEE Sens. J., 2011, 585–587 Search PubMed.
- R. Toniolo, N. Dossi, A. Pizzariello, A. P. Doherty and G. Bontempelli, Electroanalysis, 2012, 24, 865–871 CrossRef CAS.
- X. J. Huang, L. Aldous, A. M. O'Mahony, F. J. del Campo and R. G. Compton, Anal. Chem., 2010, 82, 5238–5245 CrossRef CAS PubMed.
- L. H. J. Xiong, P. Goodrich, C. Hardacre and R. G. Compton, Sens. Actuators, B, 2013, 188, 978–987 CrossRef CAS.
- R. Toniolo, N. Dossi, A. Pizzariello, A. P. Doherty, S. Susmel and G. Bontempelli, J. Electroanal. Chem., 2012, 670, 23–29 CrossRef CAS.
- K. Murugappan, J. Lee and D. S. Silvester, Electrochem. Commun., 2011, 13, 1435–1438 CrossRef CAS.
- J. Lee, K. Murugappan, D. W. M. Arrigan and D. S. Silvester, Electrochim. Acta, 2013, 101, 158–168 CrossRef CAS.
- S. Q. Xiong, Y. Wei, Z. Guo, X. Chen, J. Wang, J. H. Liu and X. J. Huang, J. Phys. Chem. C, 2011, 115, 17471–17478 CAS.
- M. A. Rahman, X. Wang and C. Wen, J. Appl. Electrochem., 2014, 44, 5–22 CrossRef CAS.
- J. M. Andújar and F. Segura, Renewable Sustainable Energy Rev., 2009, 13, 2309–2322 CrossRef.
- A. Kirubakaran, S. Jain and R. K. Nema, Renewable Sustainable Energy Rev., 2009, 13, 2430–2440 CrossRef CAS.
- J. Panchompoo, M. Ge, C. Zhao, M. Lim and L. Aldous, ChemPlusChem, 2014, 79, 1498–1506 CrossRef CAS.
- J. Y. Song, Y. Y. Wang and C. C. Wan, J. Power Sources, 1999, 77, 183–197 CrossRef CAS.
- M. Nadherna, F. Opekar and J. Reiter, Electrochim. Acta, 2011, 56, 5650–5655 CrossRef CAS.
- M. Nadherna, F. Opekar, J. Reiter and K. Stulik, Sens. Actuators, B, 2012, 161, 811–817 CrossRef CAS.
- T. Carvalho, P. Vidinha, B. R. Vieira, R. W. C. Li and J. Gruber, J. Mater. Chem. C, 2014, 2, 696–700 RSC.
- M. Zhang, L. Xiong and R. G. Compton, Anal. Methods, 2013, 5, 3473–3481 RSC.
- R. Wang, T. Okajima, F. Kitamura and T. Ohsaka, Electroanalysis, 2004, 16, 66–72 CrossRef CAS.
- X. Y. Mu, Z. Wang, X. Q. Zeng and A. J. Mason, IEEE Sens. J., 2013, 13, 3976–3981 CrossRef CAS.
- H. T. Li, X. Y. Mu, Z. Wang, X. W. Liu, M. Guo, R. Jin, X. Q. Zeng and A. J. Mason, IEEE Engineering in Medicine and Biology Society, 2012, 503–506 Search PubMed.
- P. A. D. Bonhôte, N. Papageorgiou, K. Kalyanasundaram and M. Grätzel, Inorg. Chem., 1996, 35, 1168 CrossRef.
- M. Mohammad, A. Y. Khan, M. S. Subhani, N. Bibi, S. Ahmad and S. Saleemi, Res. Chem. Intermed., 2001, 27, 259–267 CrossRef CAS.
- E. I. Rogers, D. S. Silvester, D. L. Poole, L. Aldous, C. Hardacre and R. G. Compton, J. Phys. Chem. C, 2008, 112, 2729–2735 CAS.
- D. S. Silvester, E. I. Rogers and R. G. Compton, in Electrodeposition from Ionic Liquids, ed. F. Endres, D. R. MacFarlane and A. Abbot, Wiley, Weinheim, Germany, 2008 Search PubMed.
- A. A. J. Torriero, J. Sunarso and P. C. Howlett, Electrochim. Acta, 2012, 82, 60–68 CrossRef CAS.
- M. J. A. Shiddiky, A. A. J. Torriero, C. Zhao, I. Burgar, G. Kennedy and A. M. Bond, J. Am. Chem. Soc., 2009, 131, 7976–7989 CrossRef CAS PubMed.
- D. S. Silvester, K. R. Ward, L. Aldous, C. Hardacre and R. G. Compton, J. Electroanal. Chem., 2008, 618, 53–60 CrossRef CAS.
Footnote |
| † Electronic supplementary information (ESI) available: Figure of the gas mixing system with TFEs, table of the calculated masses and actual masses used for the preparation of the different PMMA–RTIL mixtures, table of the contact angles, cyclic voltammetry at different scan rates, plots of peak current vs. square root scan rate for each PMMA–RTIL mixture, and overlaid cyclic voltammograms for the orientation experiments shown in Fig. S7 and S8, and photo of TFE after experiments where the electrodes show visible fouling. See DOI: 10.1039/c5ay00497g |
| This journal is © The Royal Society of Chemistry 2015 |

