DOI:
10.1039/C6RA28032C
(Paper)
RSC Adv., 2017,
7, 16392-16400
Exploring the potential of curcumin for control of N-acyl homoserine lactone-mediated biofouling in membrane bioreactors for wastewater treatment†
Received
10th December 2016
, Accepted 8th March 2017
First published on 14th March 2017
Abstract
Biofouling remains a critical issue in membrane bioreactors (MBRs) for wastewater treatment. Thus, exploring novel approaches for biofouling inhibition is of crucial importance. Here, effects of curcumin incorporation in MBR-activated sludge in terms of permeate quality, extracellular polymeric substance (EPS) concentration, an increase in transmembrane pressure (TMP), and N-acyl homoserine lactone inhibition in the initial stage of treatment were investigated. Results showed that TMP of the test MBR (with curcumin) reached a critical level of 40 kPa after 22 days compared to 3 days for the control MBR (without curcumin). Chemical oxygen demand removal efficiencies from the control and test bioreactors permeate were 99% and 97%, respectively. Additionally, total phosphorus and nitrogen removal from both the bioreactors were almost 99%. Quorum sensing inhibition bioassay of MBR-activated sludge suggests that curcumin addition results in inhibition of short-chain AHLs. EPS analysis of the MBR-activated sludge showed that curcumin incorporation led to 14% lower EPS content than that found in the control bioreactor. Confocal microscopy revealed that the lower membrane biofouling in the curcumin-incorporated MBR occurred because of lower biofilm surface coverage (12% for test vs. 82% for control MBR) and average thickness (0.2 μm for test vs. 1.2 μm for control MBR). Field emission scanning electron microscopy images further confirmed the effect of curcumin on biofilm inhibition. The fouled membrane was characterized using Fourier transform infrared spectroscopy, with proteins found to be the major constituents. These results show that curcumin could be a promising agent for controlling quorum sensing-mediated membrane biofouling in MBRs for wastewater treatment.
1 Introduction
The membrane bioreactor (MBR) is a highly efficient hybrid wastewater treatment technology, which integrates into one unit the biodegradation of organic and inorganic constituents by activated sludge and the generation of clean effluent from mixed liquor using ultra- or micro-filtration (UF/MF) membranes.1 MBRs have a series of advantages over conventional activated sludge treatment processes such as rapid start-up, small footprint, high loading rate, complete liquid–solid separation, low sludge production, short process time for water release, absolute control of sludge retention time (SRT) and hydraulic retention time (HRT), production of superior quality effluent with no suspended solids, thus saving on capital expenditure.2–5 However, membrane fouling, which reduces permeation flux, drives the need for frequent cleaning, resulting in increased operational cost. This limits the acceptance of MBRs as primary options for wastewater treatment.4
Fouling in wastewater-treating MBRs can occur via deposition or adsorption of macromolecules onto the membrane surface, adsorption onto the pores, or complete pore-blocking.6 Fouling can also occur because of microbial growth on the membrane surface due to cell attachment through a self-secreted matrix of extracellular polymeric substances (EPSs), which results in biocake layer formation and thus pore plugging.4 Among these fouling mechanisms, biocake layer formation (bacterial biofilm) is considered an important form of fouling in MBRs because it can significantly reduce the permeability of membranes.7 Therefore, mitigation of membrane fouling by inhibiting bacterial adhesion and/or aggregation is the first priority of the scientific community concerned with the MBR technology.
To date, several methods have been employed to control membrane biofouling in MBRs, including (i) physical cleaning, (ii) chemical cleaning, and (iii) pretreatment of the influent, but not all are always successful.8 Physical cleaning by means of relaxation and backwashing can detach a loosely bound cake layer from the membrane surface, but is not enough to eliminate all the fouling layers and thus the remaining portions lead to irreversible fouling.9,10 Chemical cleaning with a strong acidic or alkaline solution such as sodium hypochlorite can remove the irreversible fouling, but the chemicals used in this method can damage the membranes and shorten their lifespan.11 Alternatively, the incorporation of quorum quenching (QQ) bacteria in MBRs or the application of microencapsulated or alginate-immobilized QQ enzymes such as N-acyl homoserine lactone (AHL)-acylase have been tested to see if they inhibit the attachment of bacteria to membrane surfaces.12–14 Moreover, incorporation of the quorum sensing inhibition (QSI) compound vanillin into MBR for wastewater treatment has been studied regarding membrane biofouling reduction.15
Because AHLs-mediated quorum sensing (QS) systems are key in the expression of the biofilm-forming phenotype of Gram-negative bacteria, interference with such signaling mechanisms, known as QSI, has been suggested as a promising target for the mitigation of membrane biofouling in MBRs.15,16 Interference with bacterial QS systems can be accomplished by inhibiting signal molecule synthesis, degrading signal molecules, mimicking signal receptors, or inhibiting AHL/receptor complex formation.17 QSI strategies, including the incorporation of QQ bacteria in MBRs and use of encapsulated or immobilized QQ enzymes that degrade AHLs, have been tested but do not completely inhibit bacterial colonization and cannot thus significantly prevent biofouling over a long period of time.13,18 Hence, use of natural QSI to interfere with bacterial QS and inhibit membrane biofouling in MBR for wastewater treatment has been suggested.15
Several studies describe the QS-mediated anti-biofilm activity of synthetic and natural compounds such as 2(5H)-furanone, 4-hydroxy-2,5-dimethyl-3(2H)-furanone, vanillin, curcumin, and (−)-epigallocatechin gallate.19–22 Curcumin, a diphenolic compound found in turmeric has been reported to inhibit biofilm formation in both Gram-positive and Gram-negative bacteria.22,23 Additionally, it was equally effective in eradicating the established biofilm of Staphylococcus aureus.23 Curcumin is known to exert antibiofilm activity by interfering with the QS signal molecules.22,24 Previously, we have investigated the combined effect of curcumin and (−)-epigallocatechin gallate on inhibition of N-acyl homoserine lactone (AHL)-mediated biofilm formation in nine activated sludge bacteria by CDC biofilm reactor study under controlled environmental conditions.22 Looking towards the ability of curcumin to effectively inhibit AHLs-mediated biofilm formation even at low concentration, the present study aimed to explore its potential further with a pilot sale MBR containing real MBR-activated sludge and operation conditions. The activated sludge is known to contain a diverse group of bacteria, where a lot of bacteria are responsible for membrane biofouling. Hence, we focused on the effect of curcumin addition on control of membrane fouling as well as water quality parameters such as chemical oxygen demand (COD), total nitrogen (TN), and total phosphorus (TP) which are considered important for evaluating the process. This work is also of great interest for researchers as it creates a paradigm for future studies on the use of natural QSI for membrane biofouling control.
2 Material and methods
2.1. Laboratory-scale MBR setup and operation
A laboratory-scale MBR setup consisting of two cylindrical reactors was used in this study. A schematic of the MBR system is shown in Fig. 1. Both the reactors were equipped with 0.04 μm polyvinylidene fluoride (PVDF) hollow fiber membrane (Zee-Weed 500, GE-Zenon, USA) modules. The effective filtration area of the membrane module was 155 cm2. Each reactor was seeded with 3 L of activated sludge taken from a local MBR wastewater treatment plant (Guri, Gyeonggi-do, Republic of Korea) and acclimated to synthetic wastewater (feed) for two weeks (Table 1). Feed was used to provide a continuous source of biodegradable organic constituents and avoid any fluctuation in the organic load. Thereafter, the bioreactors were operated under a constant flux of 25 L m−2 h−1 in a controlled temperature environment at 28 ± 1 °C, with the pH of MBR-activated sludge maintained between 6.9 and 7.3. An HRT and SRT of 8 h and 30 d, respectively, were set as the optimum operating conditions based on a previous study.15 Water level sensors placed inside the reactor, which actuated feed pumps, controlled the HRT of both MBRs. A mixed liquor suspended solids (MLSS) concentration of 6000 ± 300 mg L−1 was maintained in the MBRs throughout the experimental period. The MBR contents were aerated continuously by providing air at 2.0 L min−1 through air diffusers placed in the bottom of the reactor, away from the membrane module. This was to (i) mix the MBR-activated sludge completely and (ii) provide oxygen for the biological process. The one-half minimum inhibitory concentration (MIC) of curcumin as determined against MBR-activated sludge bacteria, i.e., 150 mg L−1 curcumin was added to the feed tank and then pumped to the test MBR.22 The feed contents were kept well mixed with overhead stirrer mixers (PL-S10, Techno Lab-system, Seoul, Korea). Permeate was collected at a constant flux (25 L m−2 h−1) from outside to the inside of the membrane fiber via suction by a peristaltic pump (GT-150D, Green Tech Co. Ltd., Gyeongsangbuk-do, Korea). Membrane fouling was assumed as the function of transmembrane pressure (TMP) increase over time, as monitored by a digital pressure transducer (ZSE40AF-01-R, SMC Corporation, Tokyo, Japan). The TMP data was averaged within a 24 h interval to clearly show the difference between control and test MBR. The filtration was stopped after TMP rose to the critical level of 40 kPa.15 Common practices to control membrane fouling, i.e., periodic suction relaxation and backflush, were skipped to reach fouling more quickly. Detailed operating conditions of the lab-scale MBR experiment are given in Table 2.
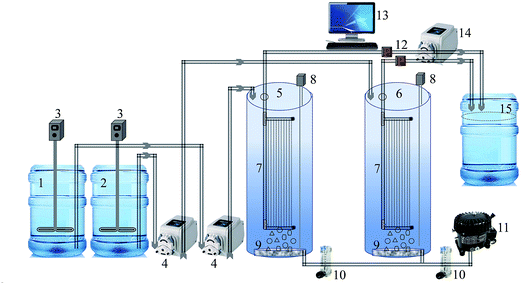 |
| | Fig. 1 Schematic of the laboratory-scale MBR system (1) feed tank, (2) feed with curcumin tank, (3) feed mixer, (4) feed pump, (5) MBR-control, (6) MBR-test, (7) membrane module, (8) level sensor, (9) air diffuser, (10) air flowmeter, (11) air compressor, (12) pressure gauge, (13) computer for data acquisition, (14) suction pump, (15) permeate tank. | |
Table 1 Composition of the synthetic wastewater used in this study
| Substance |
Concentrations (g L−1) |
| Glucose |
0.4 |
| Yeast extract |
0.014 |
| Bacto peptone |
0.115 |
| (NH4)2SO4 |
0.105 |
| KH2PO4 |
0.022 |
| MgSO4·7H2O |
0.032 |
| FeCl3·6H2O |
0.0001 |
| CaCl2·2H2O |
0.003 |
| MnSO4·5H2O |
0.003 |
| NaHCO3 |
0.256 |
Table 2 Operating conditions of the lab-scale MBR system
| Parameter |
Value |
| Working volume (L) |
3 |
| Membrane filtration area (cm2) |
155 |
| pH |
6.9–7.3 |
| DO (mg O2 per L) |
3.6–4.3 |
| Temperature (°C) |
28 ± 1 |
| HRT (h) |
8 |
| SRT (days) |
30 |
| Filtration flux (L m−2 h−1) |
25 |
| Aeration intensity (L min−1) |
2 |
| Feed COD (mg L−1) |
550 |
| Permeate COD (mg L−1) |
10–20 |
| MLSS (mg L−1) |
6000 ± 300 |
| Seeding sludge |
GURI WWTP |
2.2. Activated sludge and permeate quality analyses
The MBR-activated sludge and permeate quality parameters such as COD, MLSS, TN, and TP were determined according to the Standard Methods described by the APHA.25 Dissolved oxygen (DO) concentration was measured directly by using a DO probe inserting into the bioreactor cylinders (HI 9146, Hanna Instruments Inc., Woonsocket, RI, USA). The pH and sludge temperature were measured in situ employing a digital pH meter (Orion 5 star, Thermo Fisher Scientific, Waltham, MA, USA). All analyses were performed at least in duplicate.
2.3. Detection of QSI in MBR-activated sludge
The QSI potential of curcumin against AHLs-mediated phenotype expression in the known AHLs-deficient biosensor strain Chromobacterium violaceum CV026 was investigated using an agar plate cross-feeding bioassay.15 For this, AHLs were extracted from the MBR-activated sludge using an equal volume of acidified (0.1% acetic acid) ethyl acetate.26 The resultant AHLs extracts were then streak inoculated onto Luria-Bertani (LB) agar (BD-Difco, Franklin Lakes, NJ, USA) plates containing C. violaceum CV026. After incubation for 24–48 h at 28 °C, the plates were observed for formation of violet color along the biosensor strain.
2.4. EPS extraction and quantification
To investigate the impact of curcumin addition on membrane fouling, EPS from mixed liquor was extracted as described previously.27 Briefly, a 25 mL aliquot of the MBR-activated sludge was centrifuged (8000×g for 6 min, 4 °C). The resultant supernatant was filtered through a 0.22 μm membrane filter and the subsequent filtrate was used for soluble EPS measurements directly. The sludge pellet left inside the centrifuge tube was resuspended in a 0.85% (w/v) NaCl solution to its original volume for the loosely bound EPS measurements.
EPS in the membrane surface biocake layer were extracted as follows. First, the membrane modules were removed from the reactor tanks and washed with tap water. Next, the membrane fibers were cut into small pieces (1 cm) and the biofilm was detached from the membrane surface by sonication (60 min). Thereafter, the extraction of EPS was carried out via a modified thermal method.28 Finally, protein and polysaccharide concentrations in the EPS were determined by the Lowery method with bovine serum albumin as the standard29 and the Anthrone method with glucose as the standard, respectively.30
2.5. Membrane biofilm characterization by confocal laser scanning microscopy (CLSM)
Membrane surface biofilm morphology and quantification analysis were carried out using CLSM. The fouled membrane modules were taken from both MBRs and the membrane fibers were cut into small pieces. Care was taken to retain the foulant layer fixed on the membrane surface. The membrane pieces were washed twice with deionized sterile water to remove nonadherent bacteria and stained with 3 μM SYTO 9 green fluorescent stain (Molecular Probes, Life Technologies, Grand Island, NY, USA) in accordance with the manufacturer's instructions. Confocal images were obtained using a confocal laser scanning microscope (LSM710 upright confocal microscope, Carl Zeiss, Oberkochen, Germany) equipped with a diode laser and 10× water-immersion objective (NA: 0.95). A minimum of 20 stacks was collected for each sample with a slice thickness of 1.2 μm to get a representative portion of the biofilm. Reconstruction of the image stacks was performed with Zen 2009 software. Finally, the quantification of biofilm in terms of surface coverage and biomass thickness was performed in the MATLAB-mediated software COMSTAT v1.1.31
2.6. Field emission scanning electron microscopy (FESEM)
The surface and internal morphologies of the fouled membranes were investigated using a field emission scanning electron microscope (Inspect F, Thermo Fisher Scientific, Hillsboro, OH, USA). First, wet fouled membranes were freeze-dried (−80 °C) for 20 h without chemical fixation. For cross-sectioning, the freeze-dried membranes were kept in liquid nitrogen for 10 min and fractured into small pieces (1 cm) using a clean, sharp razor blade. Membrane pieces were then mounted on stubs by carbon double adhesive tape and sputter-coated with a thin layer of platinum for 1 min at 45 °C. Thereafter, surface and cross-sectional views of the membrane were imaged at different magnifications.
2.7. EPS analysis by Fourier transform infrared spectroscopy (FTIR)
Characterization of the organic foulant within the EPS deposited on the membrane surfaces was conducted using FTIR (Nicolet iS 10 FTIR Spectrometer, Thermo Fisher Scientific, Waltham, MA, USA). The fouled membranes were cut into small pieces and washed thrice with deionized sterile water to remove residual compounds. After drying at 25 ± 1 °C in the dark for 5 h, the FTIR spectra of the membrane pieces at wave numbers ranging from 400–4000 cm−1 were acquired by compiling 16 scans at a resolution of 4 cm−1, in transfer mode.
3 Results and discussion
3.1. Membrane fouling monitoring
Biocake layer formation and pore blocking reduce the permeate flux across membranes by increasing the resistance of the entire membrane.32 This leads to an increase in TMP or decline in permeate flux. Hence, membrane fouling in accordance with TMP variations was monitored for 30 days as shown in Fig. 2. Here, the activated sludge MLSS concentration was maintained at 6000 ± 300 mg L−1 for better filterability. The TMP profiles of the bioreactors were compared, with the results suggesting that the control MBR took 3 days to reach a critical TMP of 40 kPa. The TMP profiles of control MBR with an expanded x axis are shown in Fig. S1–S3.† Contrarily, the curcumin-incorporated MBR did not show much increase in TMP within that period; rather, it took 22 days to reach the critical level at which a QSI effect would be expected. This confirms the inhibition of membrane biofouling in the curcumin-incorporated MBR. Nam et al.15 similarly observed a noticeable TMP increase within 3 days of control MBR operation, whereas the MBR incorporated with the natural QSI compound vanillin showed a delay in TMP increase for 27 days. Piper betle extract has been reported to delay an increase in TMP during continuous MBR operation.33 Moreover, Kim et al.12 reported a similar observation where an MBR with QQ bacteria-entrapped macrocapsules showed a more delayed increase in TMP profile than the control bioreactor in continuous operation mode. It was suggested that this rapid TMP jump was due to the deposition of EPS on the membrane surface, which blocks membrane pores and forms a biocake layer on the membrane surface. This is supported by the observation of the membrane modules in the present study (Fig. 3), in which the membrane fibers from the control MBR (Fig. 3a) had a denser biofilm layer, whereas only a small amount was observed on the curcumin-incorporated membranes (Fig. 3b).
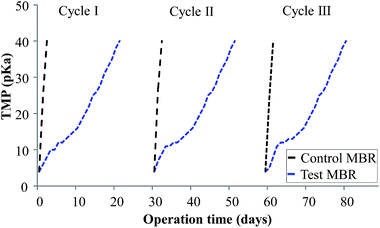 |
| | Fig. 2 TMP profiles of control (w/o curcumin) and test (with curcumin) MBRs under continuous operation. | |
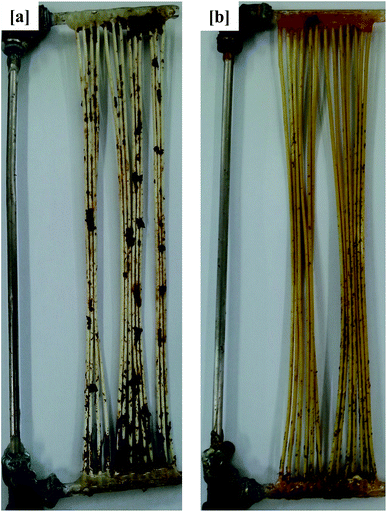 |
| | Fig. 3 Photographs of the membrane module from the (a) control MBR (w/o curcumin) and (b) test MBR (with curcumin). The membrane modules were removed when the TMP of the control MBR reached 40 kPa. | |
3.2. Treatment performance
For treatment of wastewater, the removal of COD and nitrogen are considered important parameters for evaluating the process. The water quality parameters were measured daily until the TMP of control MBR reached a critical level of 40 kPa and given as mean. As shown in Table 3, the COD removal efficiencies of the control and curcumin-incorporated MBRs, operated at an HRT of 8 h, were 99% and 97% respectively, indicating effective wastewater treatment. Additionally, at the sustained MLSS concentration of 6000 ± 300 mg L−1, nitrogen and phosphorus removals from the permeates of both MBRs were almost 99%. As compared to the control MBR permeate quality, the COD removal efficiencies were similar (99% for control and 97% for test), which demonstrated that even though the addition of curcumin in the test MBR increased the influent COD, the permeate COD fell within the permissible limit. Additional research, however, is needed to screen efficient QSI that will not increase the influent organic load but will inhibit membrane biofouling.
Table 3 Water quality parameters of the MBRsa
| Parameters |
Control MBR |
Test MBR |
| Activated sludge |
Permeate |
Activated sludge |
Permeate |
| Values are given as mean ± SD, obtained from three replicates. |
| COD (mg L−1) |
1810 ± 10.0 |
18 ± 1.5 |
2035 ± 10.0 |
67 ± 1.52 |
| TP (mg L−1) |
813 ± 4.0 |
4 ± 0.6 |
818 ± 3.05 |
5 ± 0.5 |
| TN (mg L−1) |
774 ± 3.5 |
0.22 ± 0.01 |
778 ± 3.0 |
0.23 ± 0.01 |
3.3. Detection of QSI activity in MBR-activated sludge
Because AHLs-mediated QS is known to regulate expression of the biofilm-forming phenotype in Gram-negative bacteria, its inhibition in curcumin-incorporated MBR sludge was thus evaluated using the known biosensor strain C. violaceum CV026. As shown in Fig. 4, the activated sludge extract from the curcumin-incorporated MBR inhibited violacein pigmentation in C. violaceum CV026. On the other hand, the sludge extract from the control MBR displayed violet coloration along the C. violaceum CV026 inoculation line. These observations suggest that the reduced membrane fouling by the curcumin-incorporated MBR was QS-mediated, which decreased the accumulation of EPS on the membrane surface and thus delayed an increase in TMP. This is in agreement with a previous study in which curcumin was reported to inhibit short-chain C4 and C6 homoserine lactone (HSLs)-mediated biofilm formation in Gram-negative bacteria.22 Siddiqui et al.33 investigated the role of Piper betle extract in mitigation of QS-mediated membrane biofouling and found the addition of the extract in MBR-activated sludge delayed the increase in TMP by inhibiting the production of autoinducers.
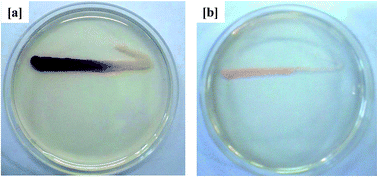 |
| | Fig. 4 QSI activity of MBR-activated sludge extract in AHLs-deficient biosensor strain C. violaceum CV026 from the (a) control MBR (w/o curcumin) and (b) test MBR (with curcumin). The opaque growth indicates inhibition of violacein pigmentation in C. violaceum CV026. | |
3.4. Quantification of EPS from activated sludge and membrane surface
EPS are excreted by bacteria and considered a major factor that causes membrane biofouling.34 The main components of EPS are polysaccharides and proteins.35 The functions of EPS-proteins and EPS-polysaccharides in the biofilms are associated with adhesion, aggregation, sorption of organic compounds and inorganic ions, and enzyme activity.36,37 EPS not only adhere to the membrane surface but also contribute to irreversible fouling, which is not removed by aeration and backwashing.38 Results of the EPS analysis from the activated sludge during the early stage of MBR operation (3 days) suggest that incorporation of curcumin led to a 14% lower EPS content compared to the control bioreactor sludge, but that the amount of biocake on the membrane surface was lower by 29% (Table 4). A relatively lower EPS concentration in the sludge and on the membrane surface of the curcumin-incorporated MBR during the early stages of operation might be attributed to a QSI effect. It has been reported that EPS play a crucial role in membrane biofouling,39 and the 14% lower EPS concentration through curcumin incorporation could be related to mitigation of biofouling. This is consistent with a previous study in which vanillin addition reduced the EPS concentration by 16% and 31% of MBR-activated sludge and membrane surface biocake, respectively.15 Moreover, many previous studies on bacterial QQ-MBRs reported reduced EPS concentrations in QQ-MBRs.9,18,40,41 The current findings revealed a direct impact of curcumin incorporation on EPS concentration and consequently a lower TMP in the test MBR.
Table 4 Residual polysaccharide and protein concentrations representing the amount of EPS in MBR-activated sludge and membrane surface biocakea
| Constituent |
Control MBR |
Test MBR |
| Sludge |
Biocake |
Sludge |
Biocake |
| Values are the mean of three replicates ± standard error of mean (SEM). * Membrane biocake. The membrane modules were removed when TMP of the control MBR reached 40 kPa. |
| Protein (mg L−1 & *mg cm−2) |
72 ± 2.0 |
*478 ± 6.0 |
60 ± 2.0 |
*138 ± 4.0 |
| Carbohydrates (mg L−1 & *mg cm−2) |
15 ± 1.0 |
*114 ± 2.0 |
13 ± 1.0 |
*34 ± 2.0 |
| EPS (mg L−1 & *mg cm−2) |
87 ± 3.0 |
*592 ± 8.0 |
73 ± 3.0 |
*172 ± 4.0 |
CLSM image analysis provides information regarding biofilm morphology and distribution of the biocake layer on the membrane surface. As shown in Fig. 5, the membrane from the control MBR (Fig. 5a) was very green, whereas a dispersed and lower intensity of green color was observed on the curcumin-incorporated bioreactor membrane (Fig. 5b), indicating reduced biofouling. CLSM images were analyzed to quantify the structural parameters, which showed significantly thicker biofilm (1.2 μm) on the control reactor membrane surface than on that of the test bioreactor (0.2 μm) (Table 5). Additionally, much higher surface coverage (82%) was observed compared to that of the test bioreactor membrane (12%). Biofilm formation of such a thickness with more surface coverage would result in a significant increase in TMP in 3 days. These observations suggest that the curcumin incorporation likely limited the biofilm formation on the membrane surface.
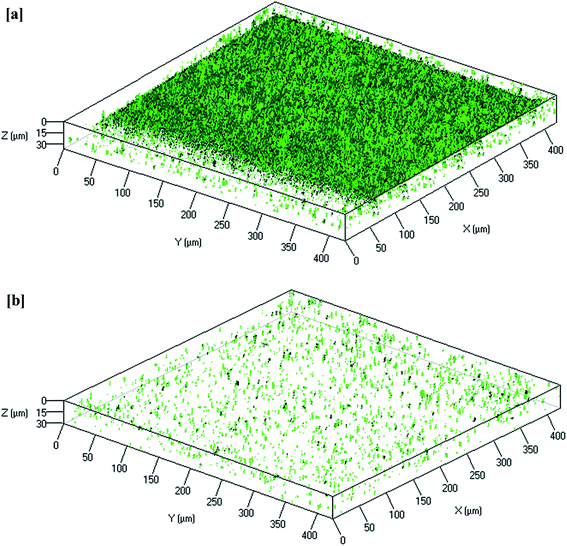 |
| | Fig. 5 Reconstructed 3D images of typical CLSM of the biofilm that remained attached to the PVDF membrane surfaces from the (a) control MBR (w/o curcumin) and (b) test MBR (with curcumin). The membrane modules were removed when TMP of the control MBR reached 40 kPa. | |
Table 5 Quantification of the biocake formed on the membrane surfacea
| Constituents |
Control MBR |
Test MBR |
| Values are the mean of three replicates ± SEM. |
| Surface coverage (%) |
82 ± 2.0 |
12 ± 0.5 |
| Mean thickness (μm) |
1.2 ± 0.1 |
0.2 ± 0.05 |
3.5. FESEM analysis of membranes
Membrane surface and internal morphologies were characterized by FESEM and images of such are shown in Fig. 6. The outer surface and cross-sectional views of virgin PVDF hollow fiber membrane are presented as a reference (Fig. 6a and a1). It can be seen from Fig. 6b that the membrane from the control bioreactor appears to have a thick fouling layer over its entire surface. Additionally, the highlighted areas in the cross-sectional view show the presence of biofilm inside the membrane pores indicating irreversible fouling (Fig. 6b1). Irreversible fouling is the strong attachment of polysaccharide-like organic matter inside membrane pores that cannot be removed by physical processes, e.g., backwashing or vibrations.42 Hence, the rapid increase of TMP in the control bioreactor was attributed to both reversible and irreversible fouling. The membrane from the test, i.e., curcumin-incorporated bioreactor was also investigated and it had a significantly thinner biofilm layer, making it similar to the virgin PVDF membrane surface morphology (Fig. 6c). However, the cross-sectional view of the test bioreactor membrane does not show the presence of biofilm, suggesting the beginning of outer surface, i.e., reversible, fouling only. These results confirm that the incorporation of curcumin in MBR-activated sludge inhibited membrane biofouling during the initial stages of operation.
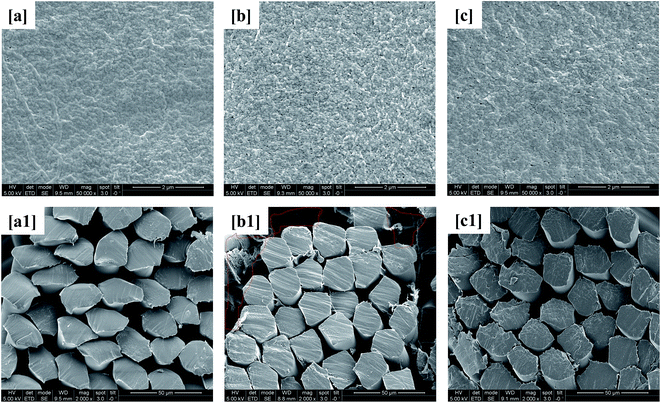 |
| | Fig. 6 FESEM images of the membrane surfaces of the (a) virgin PVDF, (b) control MBR (w/o curcumin), and (c) test MBR (with curcumin) and the membrane cross sections of the (a1) virgin PVDF, (b1) control MBR, and (c1) test MBR. | |
3.6. FTIR analysis of membranes
To obtain more insights into bacterial membrane fouling, the polysaccharide and protein contents of the EPS from the membrane surface were characterized by FTIR analysis. Determining the chemical composition of the membrane surface biofilm layer is useful for understanding the fouling phenomena. Fig. 7 presents the FTIR spectra of the surfaces of the virgin PVDF hollow fiber, control bioreactor, and test bioreactor membranes. The virgin PVDF and curcumin-incorporated MBR membranes had similar profiles with no considerable difference in their peak intensities, suggesting absence or a negligible amount of biofilm on the test bioreactor membrane [Fig. 7a and c]. The FTIR spectrum of the control bioreactor membrane exhibited peaks at the 1695 and 1570 cm−1 wavelengths associated with the protein secondary structures of amide I and amide II respectively [Fig. 7b], indicating the presence of proteins on the membrane surface.43 The presence of a giant peak at the wavelength of 1035 cm−1 attributed to C–O stretching of alcohols, demonstrates the existence of polysaccharides or polysaccharide-like substances, which are major components of the EPS of biofilm.44 It is evident from this peak pattern that proteins and polysaccharides were the main organic components deposited on the control bioreactor membrane surface. Thus, the curcumin incorporation in MBR-activated sludge has significantly increased the retardation of biofilm formation on the membrane surface.
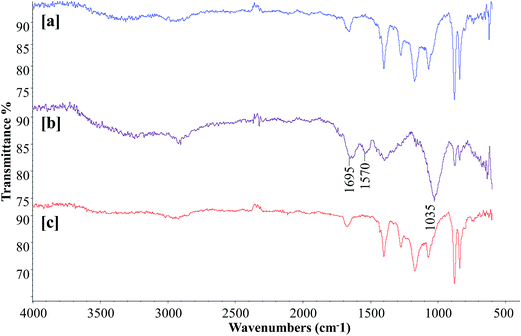 |
| | Fig. 7 FTIR spectra of the (a) virgin PVDF, (b) control MBR (w/o curcumin), and (c) test MBR (with curcumin) membranes. The membrane modules were removed when TMP of the control MBR reached 40 kPa. | |
4 Conclusions
Here, two parallel submerged MBRs (with and without curcumin) were operated at a sustained MLSS concentration of 6000 ± 300 mg L−1 for 30 days. The incorporation of curcumin into the MBR-activated sludge maintained the filtration capacity of the hollow fiber membranes for a longer time by reducing biofouling via a low level of EPS content and a delayed increase in TMP. Permeate analysis indicating that organic load removal was not affected by the addition of curcumin. The inhibition of C. violaceum CV026 violacein pigmentation from curcumin-incorporated MBR sludge extract proved that the reduced membrane fouling was QS-mediated, which decreased the accumulation of EPS on the membrane surface. Overall results of the study showed that curcumin was highly effective in controlling membrane biofouling. However, further efforts should be made to screen out the active component of curcumin, so that using curcumin will not increase influent organic load, but will mitigate QS-mediated membrane biofouling.
Acknowledgements
This paper was supported by the KU Research Professor Program of Konkuk University. Additional support for this work was provided by the National Research Foundation of Korea funded by the Korean Government Ministry of Science, ICT and Future Planning (Project No. 2015-NRF-2015R1A2A2A03005392).
References
- M. D. Williams and M. Pirbazari, Water Res., 2007, 41, 3880–3893 CrossRef CAS PubMed.
- P. Le-Clech, V. Chen and T. A. G. Fane, J. Membr. Sci., 2006, 284, 17–53 CrossRef CAS.
- W. Yang, N. Cicek and J. Ilg, J. Membr. Sci., 2006, 270, 201–211 CrossRef CAS.
- F. Meng, S.-R. Chae, A. Drews, M. Kraume, H.-S. Shi and F. Yang, Water Res., 2009, 43, 1489–1512 CrossRef CAS PubMed.
- A. F. van Nieuwenhuijzen, H. Evenblij, C. A. Uijterlinde and F. L. Schulting, Water Sci. Technol., 2008, 57, 979–986 CrossRef CAS PubMed.
- A. P. Trzcinski and D. C. Stuckey, Bioresour. Technol., 2016, 204, 17–25 CrossRef CAS PubMed.
- J. Wu, C. He, X. Jiang and M. Zhang, Desalination, 2011, 279, 127–134 CrossRef CAS.
- L. Malaeb, P. Le-Clech, J. S. Vrouwenvelder, G. M. Ayoub and P. E. Saikaly, Water Res., 2013, 47, 5447–5463 CrossRef CAS PubMed.
- N. A. Weerasekara, K. H. Choo and C. H. Lee, Water Res., 2014, 67, 1–10 CrossRef CAS PubMed.
- P. J. Smith, S. Vigneswaran, H. H. Ngo, R. Ben-Aim and H. Nguyen, J. Membr. Sci., 2005, 255, 99–106 CrossRef CAS.
- K. Calderón, B. Rodelas, N. Cabirol, J. González-López and A. Noyola, Bioresour. Technol., 2011, 102, 4618–4627 CrossRef PubMed.
- S. R. Kim, K. B. Lee, J. E. Kim, Y. J. Won, K. M. Yeon, C. H. Lee and D. J. Lim, J. Membr. Sci., 2015, 473, 109–117 CrossRef CAS.
- J. H. Kim, D. C. Choi, K. M. Yeon, S. R. Kim and C. H. Lee, Environ. Sci. Technol., 2011, 45, 1601–1607 CrossRef CAS PubMed.
- W. Jiang, S. Xia, J. Liang, Z. Zhang and S. W. Hermanowicz, Water Res., 2013, 47, 187–196 CrossRef CAS PubMed.
- A. Nam, J. H. Kweon, J. H. Ryu, H. Lade and C. H. Lee, Membrane Water Treatment, 2015, 6, 189–203 CrossRef.
- A. L. Kim, S. Y. Park, C. H. Lee, C. H. Lee and J. K. Lee, J. Microbiol. Biotechnol., 2014, 24, 1574–1582 CrossRef CAS PubMed.
- H. Lade, D. Paul and J. H. Kweon, Int. J. Biol. Sci., 2014, 10, 550–565 CrossRef PubMed.
- S. R. Kim, H. S. Oh, S. J. Jo, K. M. Yeon, C. H. Lee, D. J. Lim, C. H. Lee and J. K. Lee, Environ. Sci. Technol., 2013, 47, 836–842 CrossRef CAS PubMed.
- K. Poonusamy, D. Paul, Y. S. Kim and J. H. Kweon, Braz. J. Microbiol., 2010, 41, 227–234 CrossRef.
- S. C. Choi, C. Zhang, S. Moon and Y. S. Oh, J. Microbiol., 2014, 52, 734–742 CrossRef CAS PubMed.
- K. Ponnusamy, S. Kappachery, M. Thekeettle, J. H. Song and J. H. Kweon, World J. Microbiol. Biotechnol., 2013, 29, 1695–1703 CrossRef CAS PubMed.
- H. Lade, D. Paul and J. H. Kweon, J. Microbiol. Biotechnol., 2015, 25, 1908–1919 CrossRef CAS PubMed.
- M. Moshe, J. Lellouche and E. Banin, in Science and Technology against microbial pathogens: research, development and evaluation, ed. A. Mendez-Vilas, World Scientific Publishing Company, Singapore, 2011, vol. 89, pp. 89–93 Search PubMed.
- T. Rudrappa and H. P. Bais, J. Agric. Food Chem., 2008, 56, 1955–1962 CrossRef CAS PubMed.
- A. D. Eaton, L. S. Clesceri and A. E. Greenberg, Washington, DC, 2005, pp. 20001–23710.
- H. S. Oh, K. M. Yeon, C. S. Yang, S. R. Kim, C. H. Lee, S. Y. Park, J. Y. Han and J. K. Lee, Environ. Sci. Technol., 2012, 46, 4877–4884 CrossRef CAS PubMed.
- C. Zhang, Z. Liang and Z. Hu, Water Res., 2014, 50, 350–358 CrossRef CAS PubMed.
- H. Zhang, J. Xia, Y. Yang, Z. Wang and F. Yang, J. Environ. Sci., 2009, 21, 1066–1073 CrossRef CAS.
- O. H. Lowry, N. J. Rosebrough, A. L. Farr and R. J. Randall, Protein measurement with the Folin phenol reagent, J. Biol. Chem., 1951, 193, 265–275 CAS.
- M. DuBois, K. A. Gilles, J. K. Hamilton, P. A. Rebers and F. Smith, Anal. Chem., 1956, 28, 350–356 CrossRef CAS.
- A. Heydorn, A. T. Nielsen, M. Hentzer, C. Sternberg, M. Givskov, B. K. Ersbøll and S. Molin, Microbiology, 2000, 146, 2395–2407 CrossRef CAS PubMed.
- I. S. Chang and C. H. Lee, Desalination, 1998, 120, 221–233 CrossRef CAS.
- M. F. Siddiqui, M. Sakinah, L. Singh and A. W. Zularisam, J. Biotechnol., 2012, 161, 190–197 CrossRef CAS PubMed.
- D. Al-Halbouni, J. Traber, S. Lyko, T. Wintgens, T. Melin, D. Tacke, A. Janot, W. Dott and J. Hollender, Water Res., 2008, 42, 1475–1488 CrossRef CAS PubMed.
- J. R. Pan, Y. Su and C. Huang, Desalination, 2010, 250, 778–780 CrossRef CAS.
- H. Flemming and J. Wingender, Nat. Rev. Microbiol., 2010, 8, 623–633 CAS.
- J. Zeng, J. M. Gao, Y. P. Chen, P. Yan, Y. Dong, Y. Shen, J. S. Guo, N. Zeng and P. Zhang, Sci. Rep., 2016, 6, 26721 CrossRef CAS PubMed.
- Z. Wang, J. Ma, C. Y. Tang, K. Kimura, Q. Wang and X. Han, J. Membr. Sci., 2014, 468, 276–307 CrossRef CAS.
- Z. Wang, Z. Wu and S. Tang, Water Res., 2009, 43, 2504–2512 CrossRef CAS PubMed.
- S. Lee, S. K. Park, H. Kwon, S. H. Lee, K. Lee, C. H. Nahm, S. J. Jo, H. S. Oh, P. K. Park, K. H. Choo, C. H. Lee and T. Yi, Environ. Sci. Technol., 2016, 50, 1788–1795 CrossRef CAS PubMed.
- W. S. Cheong, S. R. Kim, H. S. Oh, S. H. Lee, K. M. Yeon, C. H. Lee and J. K. Lee, J. Microbiol. Biotechnol., 2014, 24, 97–105 CrossRef CAS PubMed.
- H. Choi, K. Zhang, D. D. Dionysiou, D. B. Oerther and G. A. Sorial, Sep. Purif. Technol., 2005, 45, 68–78 CrossRef CAS.
- S. Mafirad, M. R. Mehrnia, H. Azami and M. H Sarrafzadeh, Biofouling, 2011, 27, 477–485 CrossRef CAS PubMed.
- K. Chon, J. Cho and H. K. Shon, Bioresour. Technol., 2013, 130, 239–247 CrossRef CAS PubMed.
Footnote |
| † Electronic supplementary information (ESI) available. See DOI: 10.1039/c6ra28032c |
|
| This journal is © The Royal Society of Chemistry 2017 |
 Open Access Article
 a,
Won Jung Songa,
Young Jae Yua,
Jun Hee Ryua,
G. Arthanareeswaran
 b and
Ji Hyang Kweon*a


