
Resolving the organization of CO2 molecules confined in silica nanopores using in situ small-angle neutron scattering and molecular dynamics simulations†
Sohaib
Mohammed
 ,
Meishen
Liu
and
Greeshma
Gadikota
*
,
Meishen
Liu
and
Greeshma
Gadikota
*
School of Civil and Environmental Engineering, Cornell University, Ithaca, NY 14853, USA. E-mail: gg464@cornell.edu; Tel: +1 607 255 4796
First published on 1st June 2021
Abstract
Determining the organization of CO2 molecules confined in nanoporous environments is essential for unlocking our understanding of the fate of CO2 stored in nanoporous materials. In this study, we investigate the organization of pressurized CO2 molecules in silica materials, MCM-41 and SBA-15 with cylindrical pore geometries and pore diameters of 3.3 nm and 6.8 nm, respectively at pressures ranging from vacuum to about 55 bar, using in situ small angle neutron scattering (SANS) measurements and classical molecular dynamics (MD) simulations. The nanoconfined CO2 molecules are organized into core–shell structures with the shell resulting from CO2 adsorption on the silica surfaces. The shell thicknesses of the adsorbed CO2 molecules in MCM-41 pores obtained by SANS measurements are 0.7 ± 0.1 Å, 2.1 ± 0.1 Å, 2.2 ± 0.1 Å, 6.7 ± 0.1 Å, 11.5 ± 0.2 Å, and 12.6 ± 0.1 Å at equilibrated pressures of about 1.0, 14.9, 24.9, 34.7, 45.0 and 54.9 bar, respectively. The shell thicknesses of the adsorbed CO2 molecules in SBA-15 pores are 2.2 ± 0.1, 2.9 ± 0.1, 5.1 ± 0.1, 8.8 ± 0.1, 12.4 ± 0.1, and 20.0 ± 0.1 at pressures of 0.9, 15.4, 24.9, 34.9, 45.0 and 55.5 bar, respectively. Close agreement between the experimental and MD simulations results are obtained. MD simulations also suggest that the adsorption of the CO2 molecules is primarily driven by van der Waals interactions with minor contribution from the electrostatic interactions and hydrogen bonding with the surface hydroxyl groups. These findings inform the development of novel strategies to advance low carbon energy and resource recovery and to use and store CO2 in natural and engineered materials.
Environmental significanceThe societal need to transition to a sustainable low carbon energy and resource future requires rapid advancements in technologies to capture, convert, store, and remove CO2 from our emissions. In this context, the ability to store CO2 in geologic formations and in engineered porous materials is gaining increasing attention. One of the less studied but highly important consideration is the organization of confined CO2 in nanoporous environments. A fundamental understanding of the organization of CO2 molecules in nanoconfinement can unlock novel pathways for CO2 separation or CO2 storage in geologic and engineered materials. In this study, we investigate the organization of pressurized CO2 molecules in silica materials, MCM-41 and SBA-15 with cylindrical pore geometries and pore diameters of 3.3 nm and 6.8 nm, respectively at pressures ranging from vacuum to about 55 bar, using small angle neutron scattering (SANS) measurements and classical molecular dynamics (MD) simulations. Our results reveal that the nanoconfined CO2 molecules are organized into core–shell structures with the shell resulting from CO2 adsorption on the silica surfaces. The shell thickness increased systematically with the applied pressure. We believe this paper is relevant to the field of low carbon energy and resource utilization technologies while achieving a stable and predictable climate on Earth. Thus, this study is a significant contribution to Environmental Science: Nano. |
1. Introduction
The societal need to transition to a sustainable low carbon energy and resource future requires rapid advancements in technologies to capture, convert, store, and remove CO2 from our emissions. In this context, the ability to store CO2 in geologic formations and in engineered porous materials for on-demand and distributed utilization is gaining increasing attention. One of the less studied but highly important considerations is the organization of confined CO2 in nanoporous environments. Fluids confined in nanoporous environments have been shown to exhibit anomalous reactive behavior.1–3 Anomalous reactive behaviors, particularly in nanoconfined pores, influences our ability to predict the fate of CO2 in geologic environments where CO2 can mineralize to produce water insoluble calcium or magnesium carbonates.4–6 In the context of engineered carbon removal, there is an emerging interest in harnessing nanoporous minerals and materials to store CO2 as mineralized inorganic carbonates.7–12 However, one of the more fundamental knowledge gaps that needs to be addressed is the organization of CO2 in nanoporous media. Delineating the organization of nanoconfined CO2 is essential to advance calibrated insights into the nano-scale reactivity of confined CO2.One of the less explored hypotheses associated with the transport and adsorption of solutes in pressurized CO2 is the anomalous partitioning and reactivity due to the core–shell organization of pressurized CO2 in confinement. With increasing interest in storing CO2 in subsurface environments, predictions of multi-component ion transport and reactivity in these environments is limited by our understanding of the organization of confined CO2. Further, there is interest in understanding how multiphase fluids are organized in nano-confinement in the context of long-term CO2 storage, CO2 utilization for heat mining, and for using pressurized CO2 to extract organics in multiphase mixtures. To develop robust prediction capabilities associated with the fate and transport of CO2 for these applications, the first step is to characterize the organization of pressurized CO2 molecules in nanoconfinement. In this study, we investigate the organization of CO2 molecules compressed in silica nanopores using small angle neutron scattering (SANS) measurements and classical molecular dynamics (MD) simulations.
The chemical interactions of CO2 with solid interfaces have been investigated extensively in the context of the separation of CO2 from multi-gas streams.13–15 CO2 adsorption and separation has been extensively investigated using a variety of porous sorbents such as carbonaceous materials,16–18 zeolites,19–21 alumina,22 silica,23,24 titania,25 aerogels26 and metal organic frameworks (MOFs).27–29 Mesoporous silica-based sorbents have been widely utilized to selectively capture CO2 from gaseous mixtures owing to the ease in tailoring their porous structure as well as the flexibility in tuning the surface chemistry by attaching different functional groups. Amine-incorporated mesoporous silica sorbents showed superior CO2 uptake extents, high selectivity, high stability on adsorption/desorption performance and low energy requirements.23,30 The outstanding performance of amine–silica composites stems from integrating the high CO2 affinity of amines with large surface area of the mesoporous silica.
A wide range of characterization approaches were used to determine the performance of various silica-based sorbents for capturing CO2. Experimental investigations of CO2 capture in silica-based sorbents have been performed using X-ray diffraction (XRD),30,31 neutron diffraction,32 adsorption isotherms,30 thermogravimetric analysis (TGA)31 and Fourier transform infrared spectroscopy (FTIR).33 In addition, different computational methods have been utilized to obtain microscopic insights into CO2–silica interfacial properties, including molecular dynamics (MD) simulations.34–37 The design basis for developing novel sorbents for CO2 capture has conventionally been the separation efficiency and the associated energy needs.38–41 However, uncertainties associated with the molecular-scale organization of CO2 molecules as a function of confinement and interfacial interactions in the context of CO2 separation remain less studied.
Rising interest in storing acid gases in minerals motivated the investigation of the organization of these gases such as CO2 and H2S in porous minerals, clay minerals and silica.35,42–47 These studies predicted the organization of acid gas molecules at solid interfaces and in confinement using classical MD simulations.48–50 Compressed fluid storage in engineered and natural materials motivated the investigation of methane51–54 hydrogen,55–57 oxygen58 and CO2.59
The feasibility of experimentally validating molecular scale models predicting the organization of confined gases has been made possible by advancements in SANS measurements. Spatial resolution of the organization of confined fluids is possible using SANS measurements. For example, Melnichenko and co-workers60 showed the formation of a dense adsorbed CO2 phase in pores with diameters smaller than 4 nm at temperatures of 22 °C, 35 °C, and 60 °C in porous fractal silica using SANS measurements. The existence of two phases of CO2 in silica aerogel nanopores at temperature range of 25–35 °C was also determined using SANS measurements.61 Holewinski and co-workers62 linked the CO2 adsorption to the polymer morphology in poly(ethyleneimine)/mesoporous silica composites using SANS measurements, and showed an enhanced CO2 capacity and uptake rates by the polymer supported on hydrophilic silica. Despite these advances, the following research questions remain unresolved in literature, and are therefore addressed in this study: (i) How does the organization of CO2 in nano-confinement in silica nanopores change as a function of pressure? (ii) What is the level of agreement in the predictions and experiments of the organization of confined CO2? (iii) What are the energetic interactions underlying the organization of confined CO2 molecules?
To address these research questions, in situ SANS measurements of the organization of pressurized CO2 molecules in mesoporous silica materials such as MCM-41 and SBA-15 mesoporous silica with pore diameters of 3.3 nm and 6.8 nm are probed at CO2 pressures ranging from 0.93 bar to about 55 bars at ambient temperature. These experimental studies are complimented by classical MD simulations. The hypothesis that pressurized CO2 molecules under confinement form core–shell structures with the shell arising from the adsorption of CO2 on the pore surface is investigated. The findings from this study have implications for several applications associated with advancing low carbon energy recovery and utilization, and greenhouse gas storage. In the context of storing CO2 in depleted gas reservoirs, the organization of CO2 and methane molecules in nanoconfined environments provides the basis for assessing the fate of these molecules and potential displacement of fluids or gases. The rising need to use anthropogenic CO2 in distributed locations calls for developing novel engineered CO2 storage materials. In this context, determining the organization of CO2 in confinement and the ease of storing and recovering CO2 from these materials is essential. The experimental and simulation methodologies described in this study facilitate the core–shell description of compressed confined fluids.
2. Methods
2.1. Small-angle neutron scattering measurements
The MCM-41 and SBA-15 mesoporous silica powders with pore diameters of 3.3 nm and 6.8 nm, respectively, were purchased from Sigma-Aldrich. The powders were degassed at 100 °C for 1.5 hours to remove the adsorbed water. 0.05 g of the degassed powder was then transferred to a special aluminum pressure cell with a diameter of 11 mm and a thickness of 1 mm. The effective thickness (Leff) of the silica sample is less than the nominal thickness of the aluminum cell due to the presence of interparticle voids. The effective thickness of the silica powder is calculated as follows: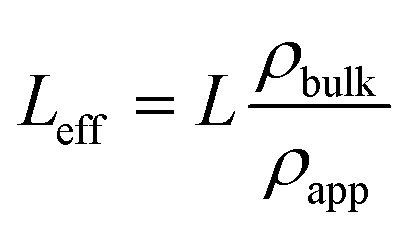 | (1) |
CO2 gas was injected to the powder and the neutron scattering intensities were collected at various pressures ranging from vacuum to about 55 bars in MCM-41 and SBA-15 samples (see Fig. 1(a)). The SANS measurements were performed at the 10 m SANS instrument at the National Institute of Standards and Technology (NIST), Center of Neutron Research (NCNR). The incident neutron beam has wavelengths (λ) of 5 Å and 12 Å, and the sample-to-detector distances (SSDs) were 1.2 m and 5.2 m to cover a wavevector (Q) range of 0.004 to 0.6 Å−1. SANS data were corrected for the transmission, the background and the detector sensitivity.64 The wavevector is 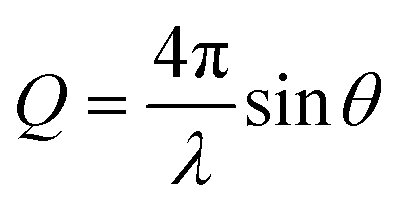 , where λ is the incident beam wavelength and θ is half of the scattering angle (2θ). Further information on the SANS measurements and data analysis are included in Mohammed and co-workers.51
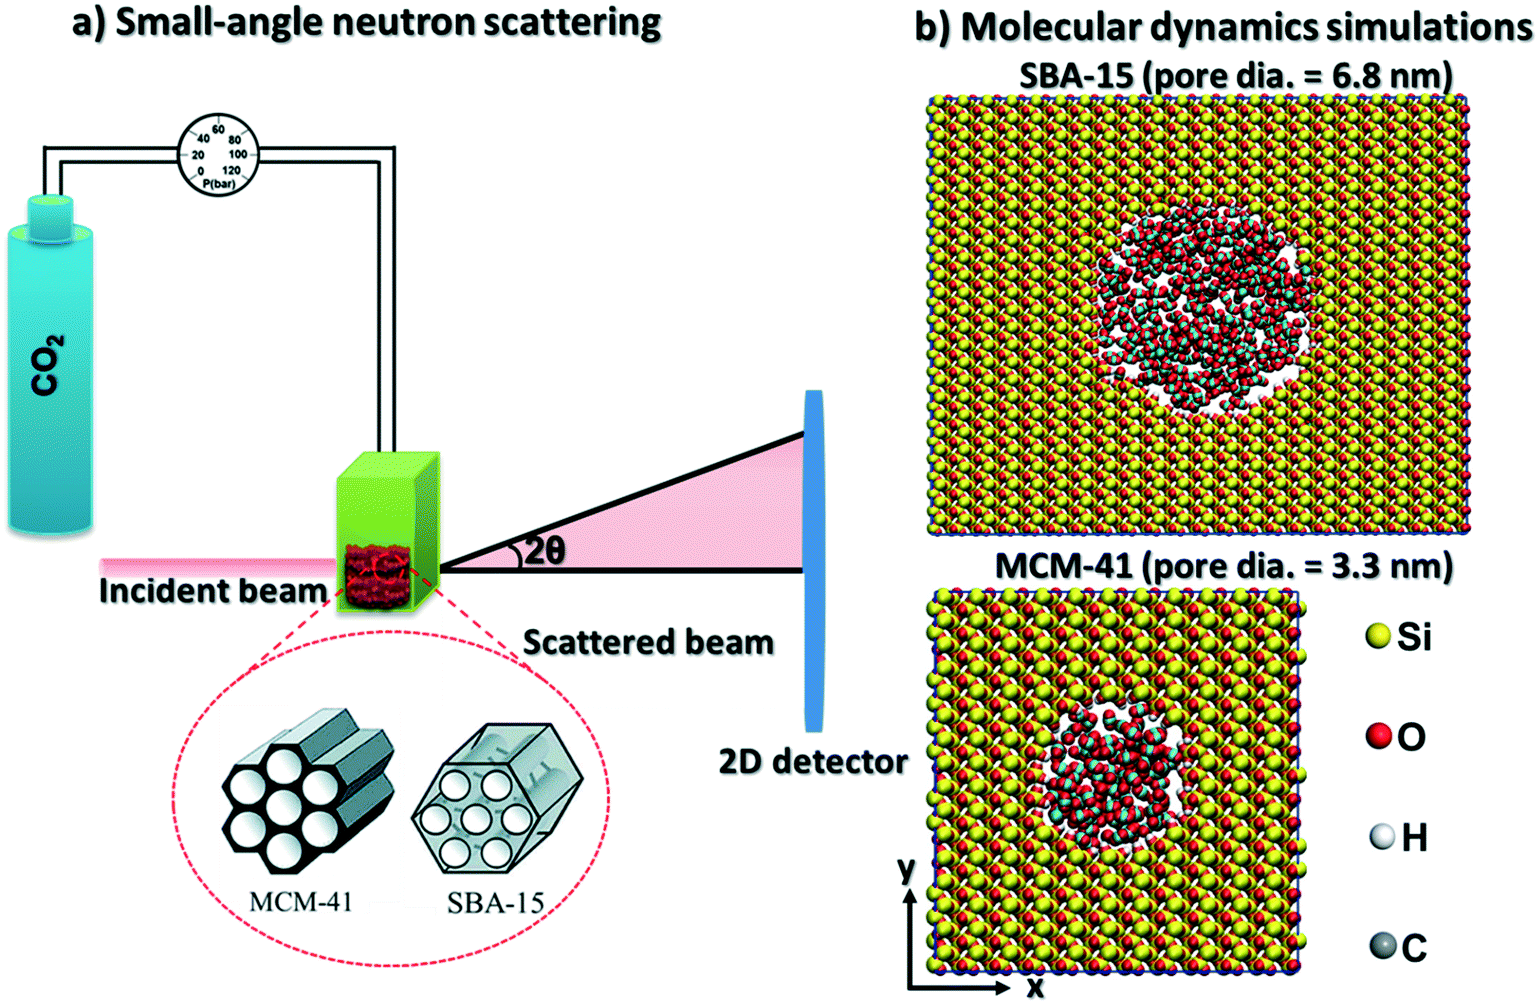 | ||
| Fig. 1 Schematic representation of the experimental setup for small-angle neutron scattering (SANS) measurements for determining the organization of confined CO2 molecules in the pores of MCM-41 (pore diameter of 3.3 nm) and SBA-15 (pore diameter of 6.8 nm) silica materials is shown in (a). Snapshots of the simulated initial configurations showing CO2 molecules and the simulated SBA-15 (top), and MCM-41 (bottom) silica pores are shown in (b). The atoms of silica pores and CO2 molecules (see the color coding for the atoms below (b)) are drawn using VDW drawing method implemented in VMD software. | ||
2.2. Classical molecular dynamics simulations
CO2 and β-cristobalite silica unit cell were built using Avogadro software. The initial configurations of isolated cristobalite unit cell were optimized using density functional theory algorithm implemented in Quantum Espresso software. The kinetic energy cutoff for wavefunctions and K-points mesh were converged based on the total energy values. The converged energy cutoff and K-points mesh were used to optimize the silica unit cell (see the initial and optimized unit cell coordinates in Fig. S1 and Table S1 in the ESI†). Ultrasoft pseudopotentials were used in which the generalized gradient approximation (GGA)65,66 was selected for the exchange correlation functional. The structural optimization of the silica unit cell has been performed using the Broyden–Fletcher–Goldfarb–Shanno (BFGS) algorithm.The optimized silica unit cell was replicated in x, y and z directions and MCM-41 and SBA-15 pores are cleaved in surfaces with dimensions of 77.96 Å × 76.43 Å × 39.8 Å and 124.45 Å × 152.85 Å × 49.78 Å in x, y, and z directions, respectively. Cylindrical-shaped pores with diameters of 3.32 nm and 6.83 nm were cleaved in the silica surfaces to mimic the MCM-41 and SBA-15 pores used in the SANS measurements (see Fig. 1(b)). The pore length of MCM-41 and SBA-15 are 3.54 nm and 4.98 nm, respectively. The nonbridging oxygens on the cleaved pore surfaces were protonated to achieve hydroxyl group density of about 8 OH per nm2.67,68 CO2 molecules were distributed randomly in the pore space with the required number of molecules to match the pressure used in the SANS measurements. Silica surfaces were modeled using ClayFF forcefield.69 CO2 molecules were modeled using the forcefield developed by Potoff and Siepmann70 (see Table 1 for the modeling parameters). The constructed simulation cells were set to be periodic in 3 dimensions.
| Atom | σ (nm) | ε (kJ mol−1) | Charge (q) |
|---|---|---|---|
| Silica | |||
| Si | 0.3706 | 7.700 × 10⁻⁶ | +2.1000 |
| Obridging | 0.3553 | 0.6502 | −1.0500 |
| Ohydroxyl | 0.3353 | 0.6502 | −0.9500 |
| Hhydroxyl | 0.0000 | 0.0000 | +0.4250 |
| CO2 | |||
| C | 0.2800 | 0.2245 | +0.7000 |
| O | 0.3050 | 0.6569 | −0.3500 |
The initial simulation cells were optimized using steepest descent energy minimization algorithm for 50![[thin space (1/6-em)]](https://www.rsc.org/images/entities/char_2009.gif) 000 steps to eliminate the inappropriate geometries. NVT ensemble with a time step of 1 fs was performed on the optimized cells for 50 ns at 298 K using the Nosé–Hoover thermostat.71,72 The bonded interactions are accounted for bonds stretching and angle bending in CO2. Bond stretching in –OH groups in silica is also accounted for. The van der Waals and electrostatic nonbonded interactions were modeled by 12–6 Lennard-Jones and Coulomb's functions, respectively. The short range interactions were calculated within a cutoff of 14 Å, while long-range electrostatic interactions were modeled using particle mesh Ewald (PME).73 GROMACS 2018 was used to perform and analyze the MD simulations.74 VMD software were used for visualizing the simulation trajectories.75 The simulations were tested for equilibrium based on the potential energy profile of the system. The simulation was considered to reach equilibration once the potential energy profile become uniform and stable.
000 steps to eliminate the inappropriate geometries. NVT ensemble with a time step of 1 fs was performed on the optimized cells for 50 ns at 298 K using the Nosé–Hoover thermostat.71,72 The bonded interactions are accounted for bonds stretching and angle bending in CO2. Bond stretching in –OH groups in silica is also accounted for. The van der Waals and electrostatic nonbonded interactions were modeled by 12–6 Lennard-Jones and Coulomb's functions, respectively. The short range interactions were calculated within a cutoff of 14 Å, while long-range electrostatic interactions were modeled using particle mesh Ewald (PME).73 GROMACS 2018 was used to perform and analyze the MD simulations.74 VMD software were used for visualizing the simulation trajectories.75 The simulations were tested for equilibrium based on the potential energy profile of the system. The simulation was considered to reach equilibration once the potential energy profile become uniform and stable.
The structure of the adsorbed CO2 on MCM-41 and SBA-15 pores was analyzed by calculating the thickness of the adsorbed layers (shell thickness) and the radial distribution function (gAB). gAB describes the density variations with the distance from a reference particle (r) as follow:
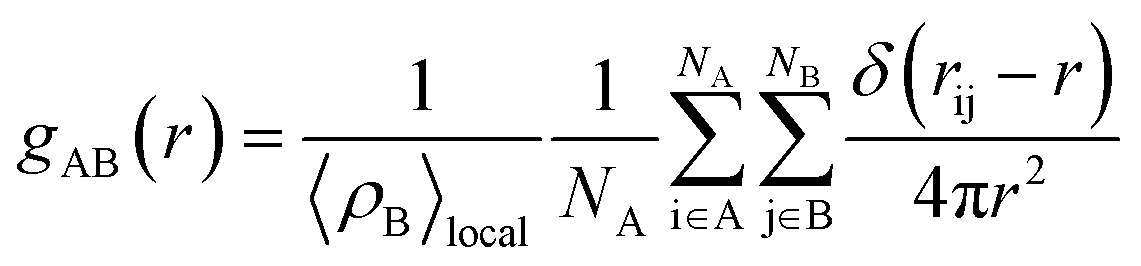 | (2) |
3. Results and discussion
3.1. The adsorption of confined CO2
The pressure dependent SANS intensities of CO2 loaded MCM-41 and SBA-15 powders are depicted in Fig. 2. The intensity curves I(Q) describe the influence of pressure on the form factor [P(![[Q with combining right harpoon above (vector)]](https://www.rsc.org/images/entities/i_char_0051_20d1.gif) )] and the structure factor [S()] such that:
)] and the structure factor [S()] such that:| I(Q) = n〈P()S()〉 | (3) |
) (high Q region) represents CO2 loaded mesopores. S() (low Q region) provides information on the hexagonally packed cylindrical pores in MCM-41 and SBA-15 matrices.
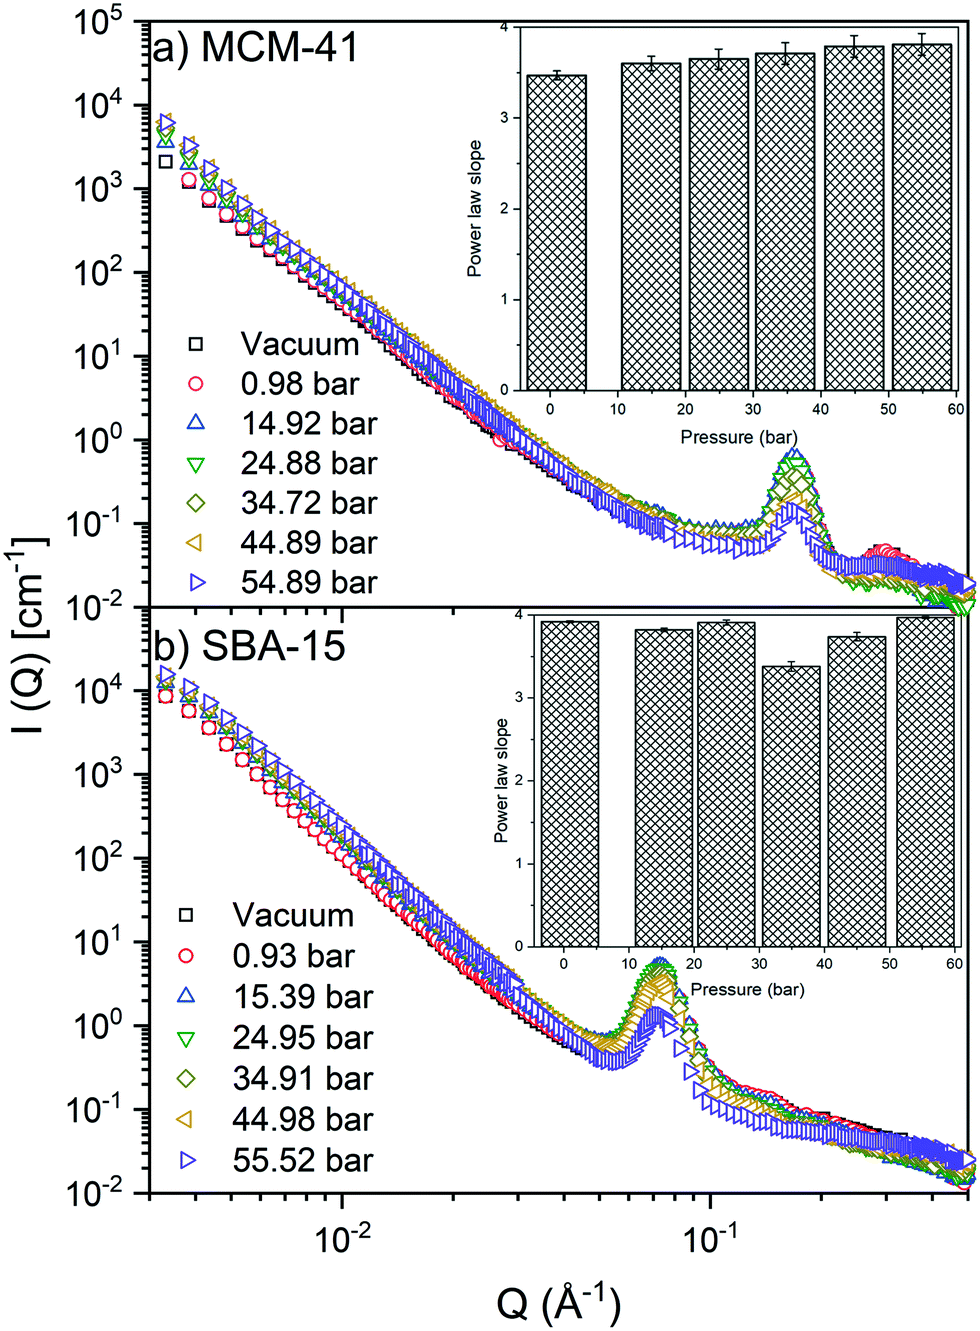 | ||
| Fig. 2 The small-angle neutron scattering intensities of CO2-loaded (a) MCM-41 and (b) SBA-15 pores as a function of the wavevector and the applied pressure are shown. The insets represent the power law slope values as a function of the applied pressure. | ||
S() modeling at Q < 0.04 Å−1 suggests that the scattering intensity follows a power law trend (I(Q) ∼ Q−D) with slopes of 3.64 ± 0.13 and 3.80 ± 0.20 in MCM-41 and SBA-15, respectively (see Fig. 2). The power law slopes of 3 < D < 4 indicates scattering from surface geometry or pore size polydispersity.76,77 As S() retains a relatively unchanged power law slope values, it can be inferred that increasing CO2 pressure has a negligible impact on the morphology of MCM-41 and SBA-15 matrices. These observations are consistent with that of confined methane in porous silica with similar pore sizes.51
The pressure effect on the form factor, P() is more significant compared to that on S() and was monitored by observing the change in the first-order peak behavior. Under vacuum, the first-order peak intensity of MCM-41 and SBA-15 powders are located at Q of about 0.17 Å−1 and 0.074 Å−1, respectively (see Fig. 2). The peak positions suggest that the mesopores in the silica matrices are aligned in a p6mm hexagonal packing78 with pore-center to pore-center distances of 42.93 Å and 99.11 Å in MCM-41 and SBA-15 matrices, respectively. These results are in agreement with previous studies that discussed methane organization in architected porous silica materials.51,79,80 As the pressure increases, the intensity of the first order peaks decreases considerably in both MCM-41 and SBA-15 mesopores to reach its minimum at the highest applied pressures (55 bars). Slight decrease in the peak intensity is observed in MCM-41 as the pressure increase from vacuum to 24.88 bar followed by a significant drop on increasing the pressure to 44.89 bars (see Fig. 3(a)). However, in SBA-15, slight decrease was noticed as the pressure increase to 34.91 followed by a substantial decrease as the pressure increased to 55.52 bar (see Fig. 3(b)). This decline is mainly attributed to the reduction of the scattering contrast between the pore surface and the adsorbed CO2 molecules on that surface. A quantitative analysis of the peak intensities as a function of the pressure is obtained by calculating the full width half maximum (FWHM) using Gaussian fitting (see Fig. 3(c) and (d)) as follows, where C is the scale factor and σ is the peak width (FWHM/2.345).81
 | (4) |
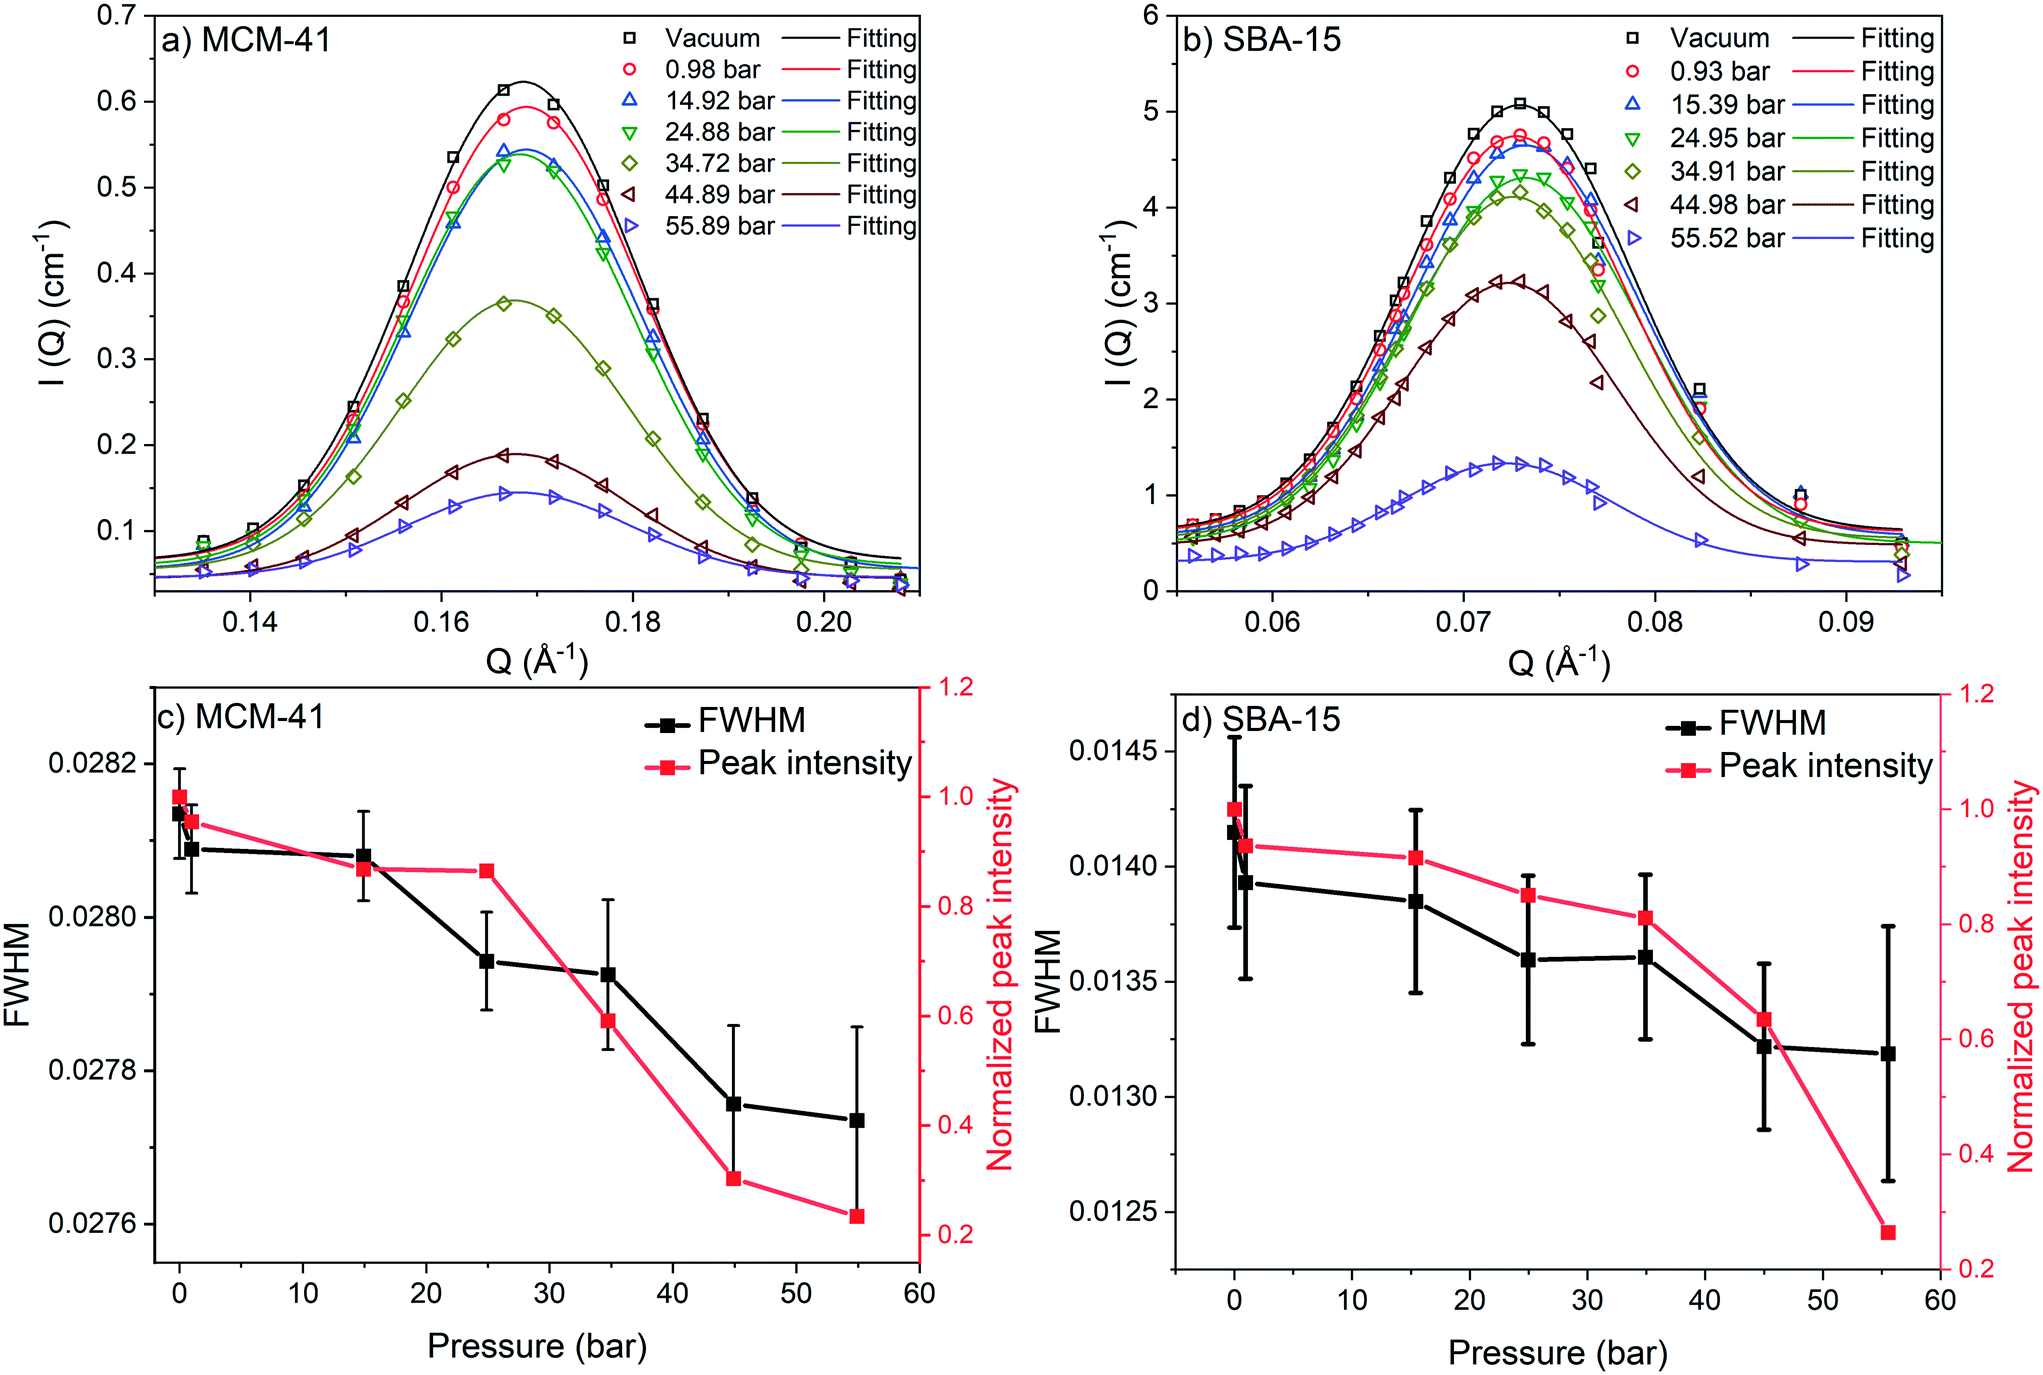 | ||
| Fig. 3 The fitted first-order peak intensity of MCM-41 and SBA-15 as a function of the applied pressure are represented in (a) and (b), respectively. The full width half maximum (FWHM) and the peak intensity normalized by the intensity of the pore under vacuum for MCM-41 and SBA-15 are shown in (c) and (d), respectively. | ||
FWHM for MCM-41 and SBA-15 showed a systematic decrease with an increase in the pressure (Fig. 3(c) and (d)). The observed profiles of FWHM are resulted from the magnitude of the peak intensity decrease as the pressure increase. Similarly, the normalized peak intensity decreased substantially from 1 to about 0.2 as the pressure increase from 0 to 55 bar, respectively.
As CO2 molecules are adsorbed on the pore surfaces of MCM-41 and SBA-15, the contrast between the pore surface and the adsorbed gas layer decreases. The scattering length density (SLD) of amorphous silica is 3.21 × 10⁻⁶ Å−2 at a mass density of 2.20 g cm−3.82 SLD of the adsorbed CO2, in Å−2 units, is proportional to the density of the adsorbed layer on the pore surface such that:
| ρSLD = (2.49 × ρCO2) × 10−6 | (5) |
The neutron scattering intensity of binary systems, such as CO2–silica system, is proportional to the difference of the SLD of the scattering object and the surrounding medium.63 Thus, the contrast matching point, the point at which the contrast between the silica matrix and the adsorbed CO2 becomes zero (i.e., I(Q) = 0).83,84 can be estimated by plotting the square root of the maximum intensity [I(Qmax)1/2] as a function of the applied pressure (see Fig. 4). It is interesting to observe that I(Qmax)1/2 decreases linearly with pressure in MCM-41 while exponential decay is noted in SBA-15 pores. The pressure at which the contrast matching point occurs in MCM-41 is about 110 bar, which corresponds to a density of 0.83 g cm−3. In SBA-15, the contrast matching point occurs at a pressure of about 72 bar which corresponds to 0.75 g cm−3. The lower pressure required to reach the contrast matching point in SBA-15 can be attributed to the larger pore size that results in higher CO2 partitioning into the pore space compared to MCM-41.
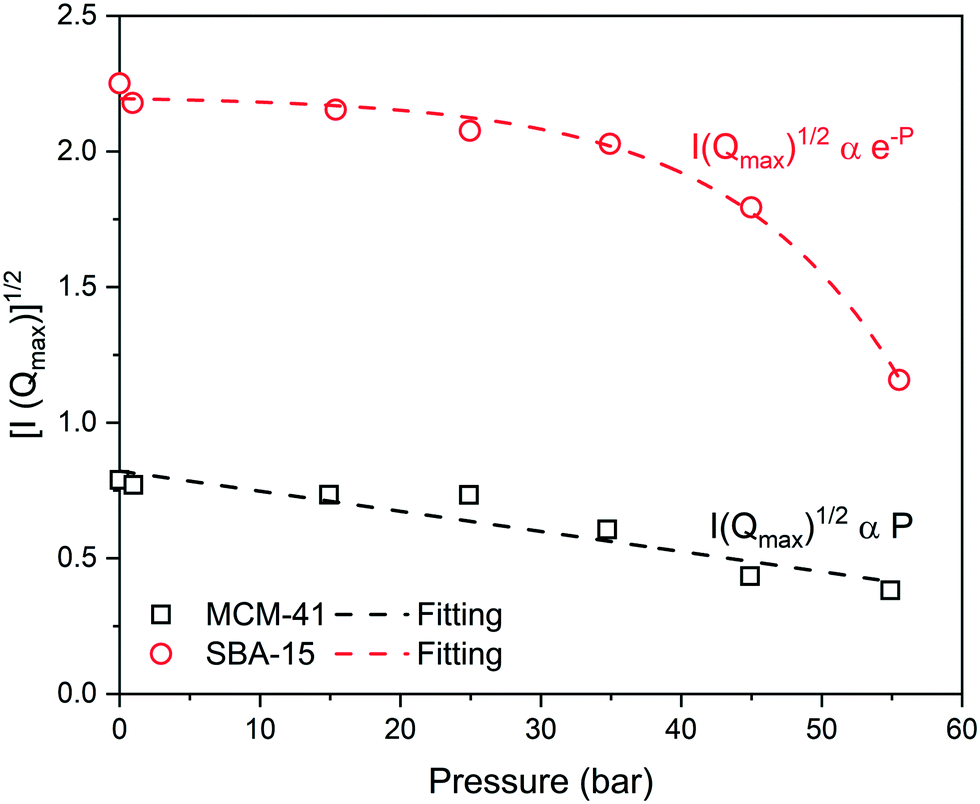 | ||
| Fig. 4 The amplitudes of the SANS intensity [I(Qmax)1/2] at the maximum of the first-order peak as a function of the applied pressure in MCM-41 and SBA-15 pores are shown. The pressures at which the intensity reaches zero average contrast in MCM-41 and SBA-15 are about 110 bar and 72 bar, respectively. | ||
The spatial distribution of the adsorbed CO2 molecules on the pore surfaces is determined by calculating the 2D density maps over the axis parallel to the pore length (z-axis) using MD simulations (Fig. 5 and 6). Anisotropic distribution of confined CO2 is observed in both MCM-41 and SBA-15 pore spaces, with higher densities noted at the pore surfaces compared to the center of the pore which is attributed to confinement effect.35,85–87 At pressures under 15 bars, almost all the confined molecules were adsorbed on the MCM-41 and SBA-15 pore surfaces. Traces of CO2 molecules are distributed unevenly outside the adsorbed layers and closer to the pore center. The thickness of the adsorbed layer and the concentrations of CO2 molecules closer to the center of the pore were systematically increased as the pressure increased from about 1 bar to about 55 bar. The anisotropic distribution of CO2 molecules in MCM-41 and SBA-15 pores are also evident from the snapshots taken from the equilibrated trajectories during the last 1 ns of the simulation time (see Fig. S2†).
 | ||
| Fig. 5 The 2D density maps of the CO2 molecules adsorbed on the pore walls of MCM-41 as a function of the pressure obtained from the classical molecular dynamics simulations are shown. The pore diameter of MCM-41 is 3.3 nm. The density maps are averaged over the last 10 ns of the simulation time. | ||
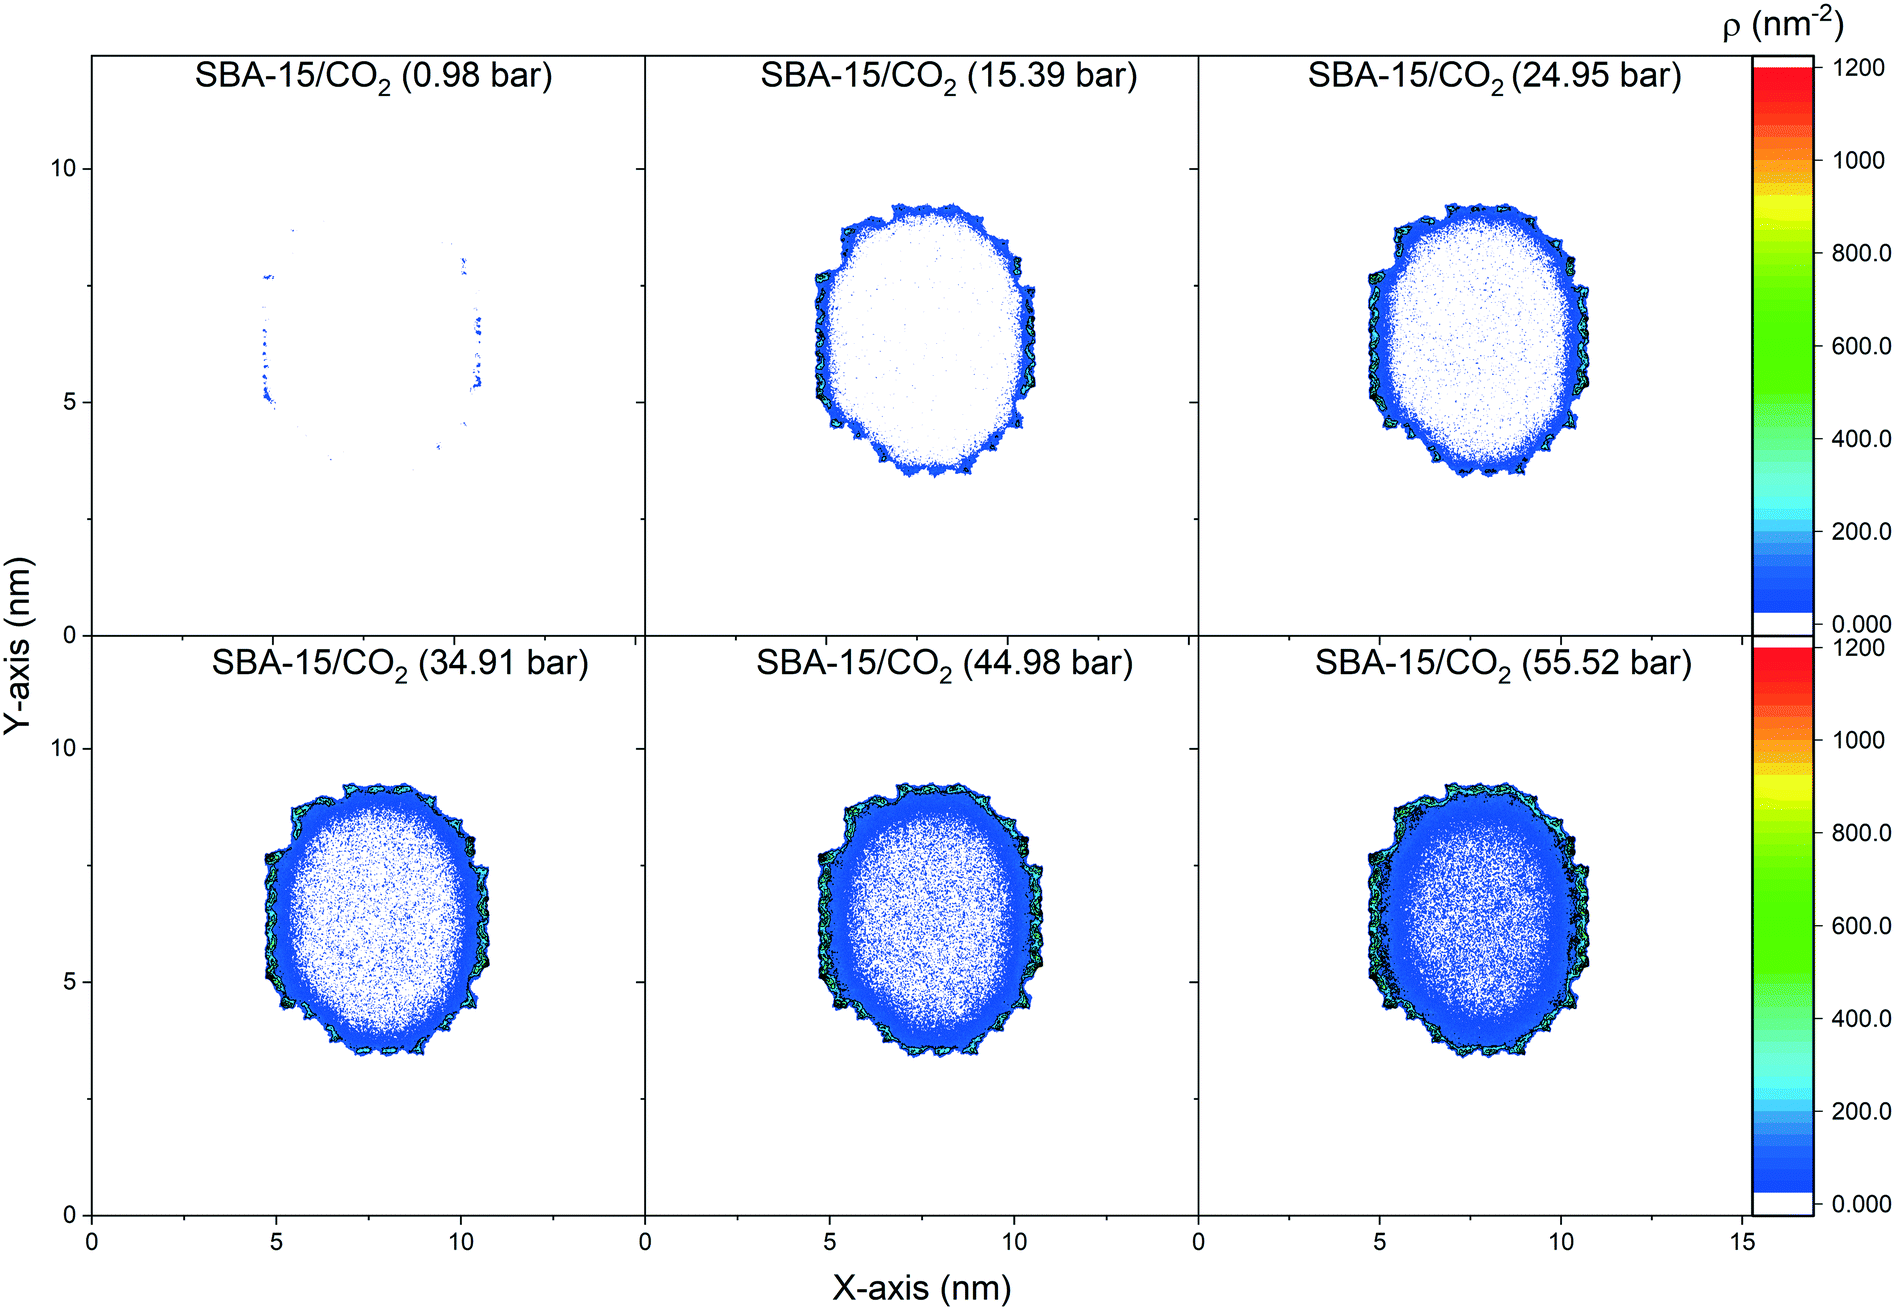 | ||
| Fig. 6 The 2D density maps of the CO2 molecules adsorbed on the pore walls of SBA-15 as a function of the pressure obtained from the classical molecular dynamics simulations are shown. The pore diameter of SBA-15 is 6.8 nm. The density maps are averaged over the last 10 ns of the simulation time. | ||
3.2. Core–shell structure of confined CO2
The experimental SANS intensities of the confined CO2 in MCM-41 and SBA-15 are modeled using a core–shell cylindrical geometry with multilevel densities to probe the pressure dependent shell thickness and core radius.79,80,88,89 The shell is defined as the thickness of the adsorbed CO2 layer on the pore surface while the core is the diameter of the silica pore excluding the CO2 shell. These data are then compared with the MD simulation data to determine the density of the confined fluids (see Fig. 7 and Table S2†). The shell thickness are obtained from SANS measurements by utilizing the model developed by Chiang and co-workers,79,80 while those from MD simulations are directly calculated from the 2D density maps. The model developed by Chiang and co-workers involves the shell thickness of the adsorbed gas, the core radius and the scattering length densities of the adsorbed gas and silica matrix (see Fig. S3†). This model has been applied to predict the adsorption extent of CD4 in MCM-41 and SBA-15 with cylindrical pore geometries. The shell boundaries in MD density maps are the pore surface and the point where the density of the adsorbed CO2 start to decline steeply.51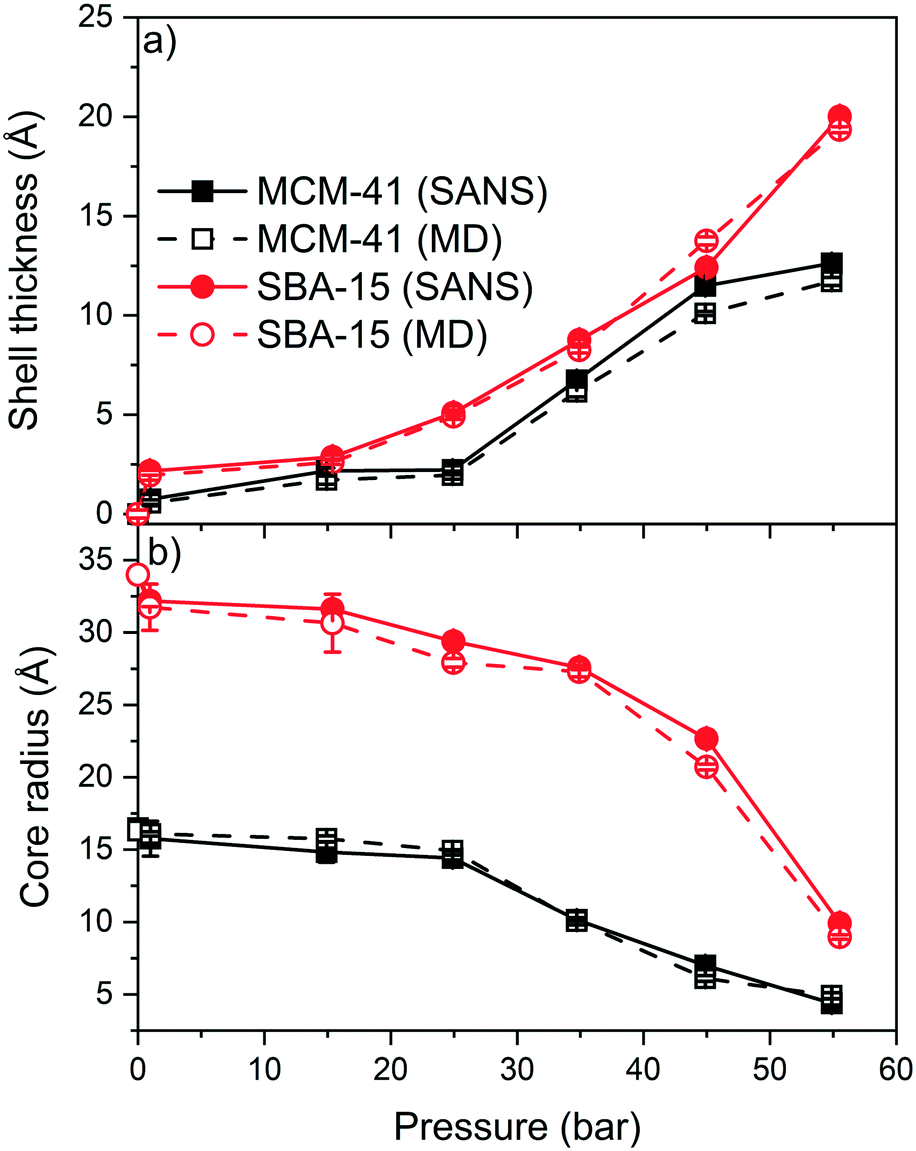 | ||
| Fig. 7 The thickness of the adsorbed CO2 layer determined from the small-angle neutron scattering measurements and molecular dynamics simulations (a) and the corresponding core radius (b) as a function of the applied pressure are shown. The error bars of the SANS and MD data represent standard deviations based on fittings and simulations performed in triplicates. | ||
The shell thickness of the adsorbed CO2 molecules on MCM-41 and SBA-15 pore surfaces increased systematically with the pressure as indicated by SANS measurements and MD simulations (see Fig. 7). The experimentally determined shell thicknesses of adsorbed CO2 on MCM-41 using SANS measurements are 0.7 ± 0.1 Å, 2.1 ± 0.1 Å, 2.2 ± 0.1 Å, 6.7 ± 0.1 Å, 11.5 ± 0.2 Å, and 12.6 ± 0.1 Å at pressures of about 1.0, 14.9, 24.9, 34.7, 45.0 and 54.9 bar, respectively. The thickness of the adsorbed CO2 layer on SBA-15 pore surfaces are 1.9 ± 0.1, 2.6 ± 0.1, 4.9 ± 0.1, 8.3 ± 0.1, 12.4 ± 0.1, and 20.0 ± 0.1 at pressures of about 0.9, 15.4, 24.9, 34.9, 45.0 and 55.5 bar, respectively. The thickness of the adsorbed CO2 molecules, also referred to as “shell” determined experimentally are in close agreement with that of classical MD simulations (see Fig. 7(a)).
The increase in the shell thickness of the adsorbed CO2 on MCM-41 and SBA-15 surfaces are more significant than that of CD4 adsorption even at higher pressures.51 The increase in the shell thickness is associated with a considerable decrease in the core radius in MCM-41 and SBA-15 pores (see Fig. 7(b)). The core radius in MCM-41 decreased from 16.1 ± 0.2 Å to 4.9 ± 0.1 Å as the pressure increases from 1.0 to 55 bar, respectively, while the core radius in SBA-15 decreased from 31.7 ± 0.3 Å to 9.9 ± 0.1 Å, respectively.
The radial distribution function (RDF) and the associated coordination number (CN) of carbon atom in CO2 molecules from the hydroxyl group (–OH) on the pore surface are calculated to probe the influence of the applied pressure on the organization and the structure of the adsorbed CO2 layers on MCM-41 and SBA-15 pore surfaces (see Fig. 8). The RDF peaks in MCM-41 and SBA-15 decreased systematically with an increase in the pressure, suggesting more substantial increase in CO2 density beyond the adsorbed layer. Further, RDF peaks in MCM-41 is higher than that in SBA-15 at the same pressure which can be attributed to the higher confinement effect in the narrower pores.
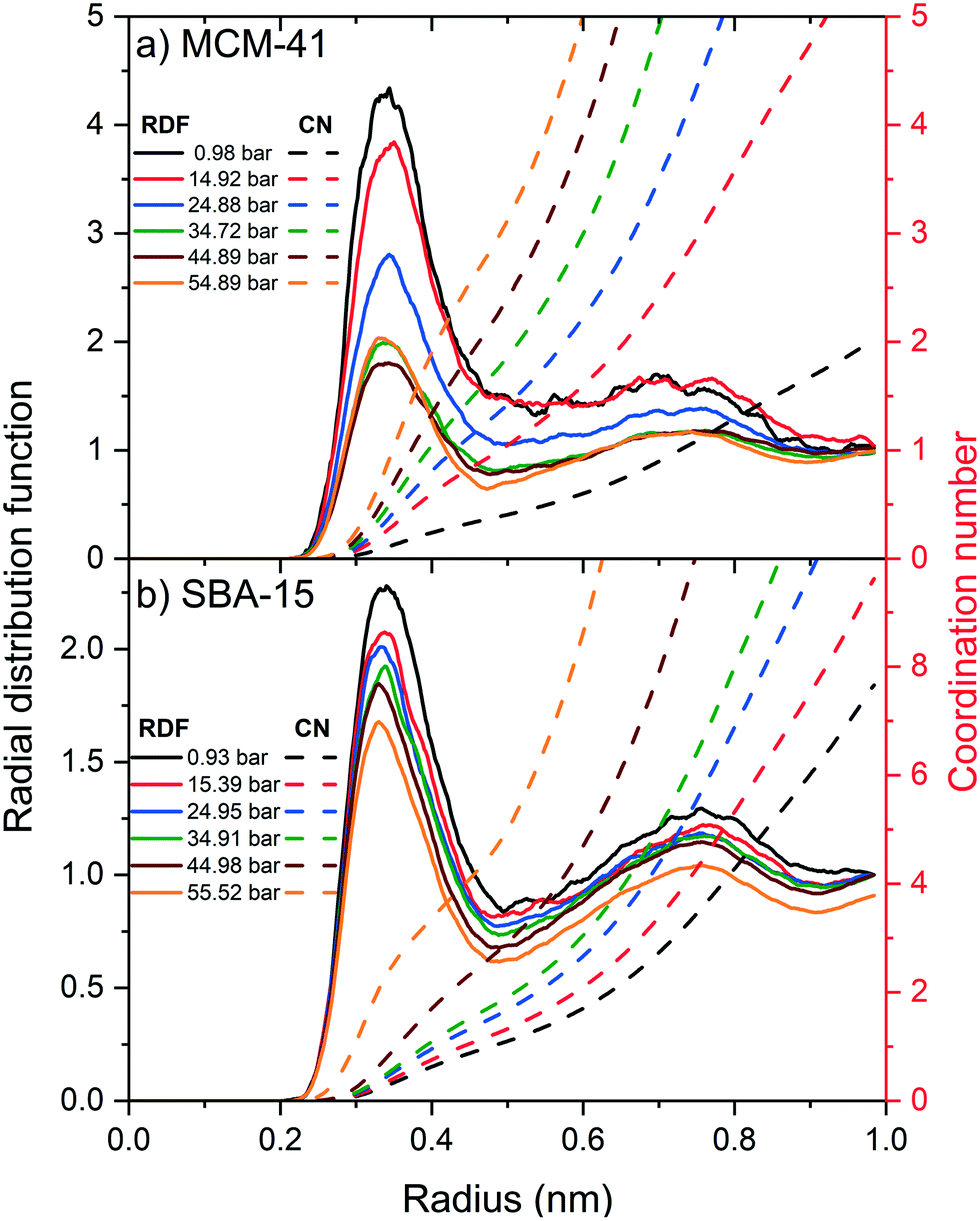 | ||
| Fig. 8 The radial distribution functions and the corresponding coordination numbers of –OH–CCO2 in the MCM-41 (a) and SBA-15 (b) as a function of the applied pressure are shown. The simulation data are averaged over the last 10 ns of the simulation time. | ||
Although RDF peaks intensities decrease with an increase in pressure, the corresponding CN profiles showed a substantial increase in both MCM-41 and SBA-15 which imply an increase in the density of carbon atoms in the first coordination shell of –OH group and the adjacent interfacial layers. The number of carbon atoms in the first coordination shell corresponding to the pressure is calculated by integrating the coordination number at the end of the RDF peak and depicted in Fig. 9. The number of carbon atoms in the first coordination shell of –OH on MCM-41 increased from 0.5 ± 0.1 to 2.8 ± 0.1 as the pressure increased from 1.0 bar to 54.9 bar, respectively. Sharper increase in the number of C atoms in the first coordination shell of OH is noticed on MCM-41 pores as the pressure increase from about 0.98 to 14.92 bars compared to the change in higher pressures. This trend is attributed to the relatively higher pressure increment (∼14 bar) compared to the following pressure change values (∼10 bar). In SBA-15, the number of carbon atoms increased from 0.3 ± 0.1 to 1.3 ± 0.1 as the pressure increased from 0.9 bar to 55.5 bar, respectively. The number of CO2 carbon atoms in the first coordination shell of OH groups on MCM-41 and SBA-15 are significantly higher than that of CH4 carbon atoms due to the higher tendency to adsorb CO2 on silica surfaces, which is in agreement with previous studies.86,90,91
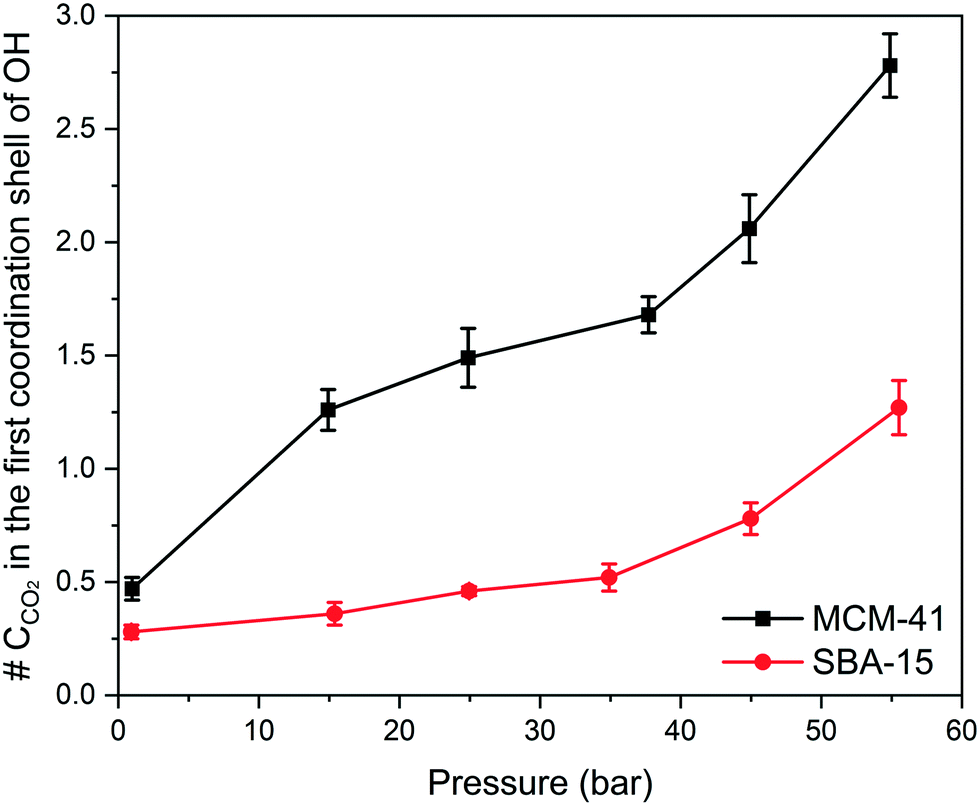 | ||
| Fig. 9 The number of carbon atoms in the first coordination shells of the –OH group on the MCM-41 and SBA-15 pore surfaces obtained from the RDFs are shown. The error bars represent the standard deviations from simulations performed in triplicates. | ||
3.3. Energetics of CO2 adsorption in MCM-41 and SBA-15
Further insights on the adsorption and organization of adsorbed CO2 molecules on MCM-41 and SBA-15 pore surfaces are obtained by calculating the intermolecular interactions. Here, the energetics of CO2 adsorption are obtained by calculating the magnitude of van der Waals and electrostatic potentials as a function of the applied pressure (see Fig. 10). van der Waals and electrostatic interactions are normalized by the number of –OH group in the MCM-41 and SBA-15 pore surface, which are 128 and 256, respectively, for a consistent comparison. Both van der Waals and electrostatic interactions are significantly enhanced with increase in pressure, which corresponds to higher extents of CO2 adsorption. In this context, the van der Waals interactions in MCM-41 are enhanced from −0.8 ± 0.1 to −5.8 ± 0.1 kJ mol−1 as the pressure increases from 1.0 to 54.9 bar. Similarly, as the pressure increased from 0.9 to 55.9 bar in SBA 15, the favorable van der Waals interactions are enhanced from −1.2 ± 0.1 to −5.8 ± 0.1 kJ mol−1. Similarly, the electrostatic interactions in MCM-41 are enhanced from −0.13 ± 0.01 to −1.3 ± 0.1 kJ mol−1 as the pressure increases from 1.0 to 54.9 bar. In SBA-15, the electrostatic interactions are enhanced from −0.4 ± 0.03 to −2.8 ± 0.05 kJ mol−1 as the pressure increased from 0.9 to 56.0 bar, respectively.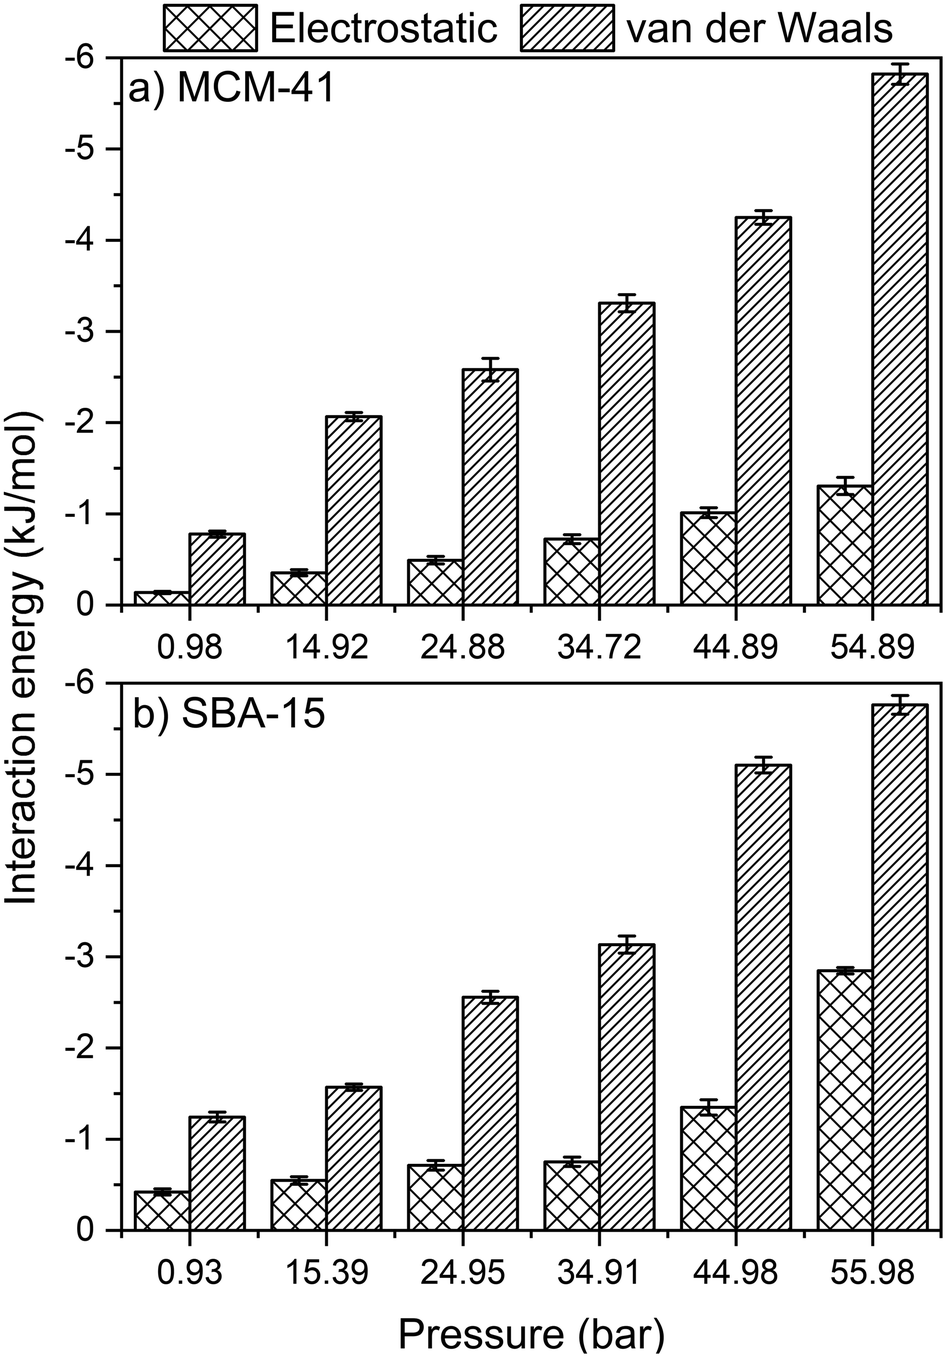 | ||
| Fig. 10 The electrostatic and van der Waals interaction energy associated with the adsorption of CO2 molecules on the surfaces of MCM-41 and SBA-15 materials as a function of pressure are shown. These analyses are performed on data averaged over the last 10 ns of the simulation time. The error bars are calculated based on the simulations performed in triplicates. | ||
The intermolecular interactions suggest that CO2 adsorption on silica surfaces is primarily driven by Lennard-Jones interactions, arising from the atomistic collisions, with smaller contributions from the electrostatic interactions. It is interesting to note that the electrostatic contributions are more significant in the case of CO2 molecules confined in silica nanopores compared to CH4 molecules in confinement.51 In additions to the contributions of van der Waals and electrostatic interactions on CO2 adsorption behavior in MCM-41 and SBA-15 pores, CO2 molecules form hydrogen bonds with the OH groups on the pore surface that contribute positively to the overall intermolecular interactions. The energy of the individual hydrogen bond can vary from 1 to 40 kcal mol−1.92 The number of hydrogen bonds in SBA-15 is higher than that in MCM-41 due to the higher number of OH groups on the pore surface and the higher number of CO2 molecules in confinement. The total number of hydrogen bonds between OH group on the pore surface and the confined CO2 increase with the pressure in both MCM-41 and SBA-15 pores (see Table S3†) due to the higher adsorption extent of CO2 molecules on the pore surface. Further, the intermolecular interactions between CO2 molecules confined in MCM-41 and SBA-15 are dominated by van der Waals attractions with a considerable contribution from electrostatic attractions (see Table S4†). The combination of van der Waals, electrostatic and hydrogen bonds contribute to higher energies of adsorption of CO2 on MCM-41 and SBA-15 surfaces compared to CH4.51
4. Conclusions
The structure of confined CO2 in mesoporous silica, MCM-41 with pore diameter of 3.3 nm and SBA-15 with 6.8 nm, was studied as a function of pressures applied that range from vacuum to about 55 bars using in situ small angle neutron scattering and classical molecular dynamics simulations. SANS measurements showed that higher levels of CO2 are adsorbed with increasing pressure of CO2. Core–shell organization of the CO2 molecules in confinement are noted with the adsorbed CO2 molecules forming a shell-like structure and less dense CO2 molecules in the center of the pore. The shell thickness increases systematically with pressure, while the corresponding core radius decreases accordingly. The core–shell structures of CO2 predicted from MD simulations are in close agreement with the experimental SANS data. Our calculations using MD simulations show that CO2 adsorption is primarily driven by van der Waals interactions with electrostatic interactions having a smaller contribution. These studies demonstrate that the structure of confined CO2 molecules can be experimentally determined, and these experimental results can be used to validate modeling efforts. The experimental and modeling approaches discussed in this study can be used to determine the organization of confined CO2 molecules in novel functionalized materials and in natural geologic minerals.Conflicts of interest
There are no conflicts to declare.Acknowledgements
This work was supported by the Multiscale Fluid–Solid Interactions in Architected and Natural Materials (MUSE), an Energy Frontier Research Center funded by the U.S. Department of Energy, Office of Science, Basic Energy Sciences under Award # DE-SC0019285. The authors would like to thank Dr. Yun Liu and Juscelino Leao for SANS experimental support at the NIST Center for Neutron Research.References
- D. Chakraborty and P. K. Chattaraj, Bonding, reactivity, and dynamics in confined systems, J. Phys. Chem. A, 2019, 123(21), 4513–4531 Search PubMed.
- S. Fleischmann, M. A. Spencer and V. Augustyn, Electrochemical Reactivity under Confinement Enabled by Molecularly Pillared 2D and Layered Materials, Chem. Mater., 2020, 32(8), 3325–3334 Search PubMed.
- P. Kondratyuk and J. T. Yates, Effects of Molecular Confinement inside Single Walled Carbon Nanotubes on Chemical Reactivity− Atomic H+ 1-Heptene, J. Am. Chem. Soc., 2007, 129(28), 8736–8739 Search PubMed.
- A. L. Harrison, G. M. Dipple, I. M. Power and K. U. Mayer, Influence of surface passivation and water content on mineral reactions in unsaturated porous media: Implications for brucite carbonation and CO2 sequestration, Geochim. Cosmochim. Acta, 2015, 148, 477–495 Search PubMed.
- P. Sun, J. R. Grace, C. J. Lim and E. J. Anthony, A discrete-pore-size-distribution-based gas–solid model and its application to the CaO + CO2 reaction, Chem. Eng. Sci., 2008, 63(1), 57–70 Search PubMed.
- M. Chen, N. Wang, J. Yu and A. Yamaguchi, Effect of porosity on carbonation and hydration resistance of CaO materials, J. Eur. Ceram. Soc., 2007, 27(4), 1953–1959 Search PubMed.
- M. Liu and G. Gadikota, Integrated CO2 capture, conversion, and storage to produce calcium carbonate using an amine looping strategy, Energy Fuels, 2018, 33(3), 1722–1733 Search PubMed.
- M. Liu, H. Asgar, S. Seifert and G. Gadikota, Novel aqueous amine looping approach for the direct capture, conversion and storage of CO2 to produce magnesium carbonate, Sustainable Energy Fuels, 2020, 4(3), 1265–1275 Search PubMed.
- M. Liu and G. Gadikota, Single-step, low temperature and integrated CO2 capture and conversion using sodium glycinate to produce calcium carbonate, Fuel, 2020, 275, 117887 Search PubMed.
- G. Gadikota, Multiphase carbon mineralization for the reactive separation of CO2 and directed synthesis of H2, Nat. Rev. Chem., 2020, 4(2), 78–89 Search PubMed.
- G. Gadikota, J. Matter, P. Kelemen and A. H. A. Park, Chemical and morphological changes during olivine carbonation for CO2 storage in the presence of NaCl and NaHCO3, Phys. Chem. Chem. Phys., 2014, 16(10), 4679–4693 Search PubMed.
- G. Gadikota, J. Matter, P. Kelemen, P. V. Brady and A. H. A. Park, Elucidating the differences in the carbon mineralization behaviors of calcium and magnesium bearing alumino-silicates and magnesium silicates for CO2 storage, Fuel, 2020, 277, 117900 Search PubMed.
- A. Brunetti, F. Scura, G. Barbieri and E. Drioli, Membrane technologies for CO2 separation, J. Membr. Sci., 2010, 359(1–2), 115–125 Search PubMed.
- D. Aaron and C. Tsouris, Separation of CO2 from flue gas: a review, Sep. Sci. Technol., 2005, 40(1–3), 321–348 Search PubMed.
- E. J. Garcia, J. Pérez-Pellitero, G. D. Pirngruber, C. Jallut, M. Palomino, F. Rey and S. Valencia, Tuning the adsorption properties of zeolites as adsorbents for CO2 separation: best compromise between the working capacity and selectivity, Ind. Eng. Chem. Res., 2014, 53(23), 9860–9874 Search PubMed.
- R. V. Siriwardane, M. S. Shen, E. P. Fisher and J. A. Poston, Adsorption of CO2 on molecular sieves and activated carbon, Energy Fuels, 2001, 15(2), 279–284 Search PubMed.
- N. P. Wickramaratne and M. Jaroniec, Activated carbon spheres for CO2 adsorption, ACS Appl. Mater. Interfaces, 2013, 5(5), 1849–1855 Search PubMed.
- M. Cinke, J. Li, C. W. Bauschlicher Jr, A. Ricca and M. Meyyappan, CO2 adsorption in single-walled carbon nanotubes, Chem. Phys. Lett., 2003, 376(5–6), 761–766 Search PubMed.
- R. V. Siriwardane, M. S. Shen, E. P. Fisher and J. Losch, Adsorption of CO2 on zeolites at moderate temperatures, Energy Fuels, 2005, 19(3), 1153–1159 Search PubMed.
- M. R. Hudson, W. L. Queen, J. A. Mason, D. W. Fickel, R. F. Lobo and C. M. Brown, Unconventional, highly selective CO2 adsorption in zeolite SSZ-13, J. Am. Chem. Soc., 2012, 134(4), 1970–1973 Search PubMed.
- D. Saha, Z. Bao, F. Jia and S. Deng, Adsorption of CO2, CH4, N2O, and N2 on MOF-5, MOF-177, and zeolite 5A, Environ. Sci. Technol., 2010, 44(5), 1820–1826 Search PubMed.
- C. Chen and W. S. Ahn, CO2 capture using mesoporous alumina prepared by a sol–gel process, Chem. Eng. J., 2011, 166(2), 646–651 Search PubMed.
- C. Chen, S. Zhang, K. H. Row and W. S. Ahn, Amine–silica composites for CO2 capture: A short review, J. Energy Chem., 2017, 26(5), 868–880 Search PubMed.
- R. Ullah, M. Atilhan, S. Aparicio, A. Canlier and C. T. Yavuz, Insights of CO2 adsorption performance of amine impregnated mesoporous silica (SBA-15) at wide range pressure and temperature conditions, Int. J. Greenhouse Gas Control, 2015, 43, 22–32 Search PubMed.
- G. Jiang, Q. Huang, S. D. Kenarsari, X. Hu, A. G. Russell, M. Fan and X. Shen, A new mesoporous amine-TiO2 based pre-combustion CO2 capture technology, Appl. Energy, 2015, 147, 214–223 Search PubMed.
- Y. Kong, X. Shen, S. Cui and M. Fan, Development of monolithic adsorbent via polymeric sol–gel process for low-concentration CO2 capture, Appl. Energy, 2015, 147, 308–317 Search PubMed.
- J. Yu, L. H. Xie, J. R. Li, Y. Ma, J. M. Seminario and P. B. Balbuena, CO2 capture and separations using MOFs: computational and experimental studies, Chem. Rev., 2017, 117(14), 9674–9754 Search PubMed.
- A. Torrisi, R. G. Bell and C. Mellot-Draznieks, Functionalized MOFs for enhanced CO2 capture, Cryst. Growth Des., 2010, 10(7), 2839–2841 Search PubMed.
- J. Liu, Y. Wei and Y. Zhao, Trace carbon dioxide capture by metal–organic frameworks, ACS Sustainable Chem. Eng., 2018, 7(1), 82–93 Search PubMed.
- M. Niu, H. Yang, X. Zhang, Y. Wang and A. Tang, Amine-impregnated mesoporous silica nanotube as an emerging nanocomposite for CO2 capture, ACS Appl. Mater. Interfaces, 2016, 8(27), 17312–17320 Search PubMed.
- X. Xu, C. Song, J. M. Andresen, B. G. Miller and A. W. Scaroni, Preparation and characterization of novel CO2 “molecular basket” adsorbents based on polymer-modified mesoporous molecular sieve MCM-41, Microporous Mesoporous Mater., 2003, 62(1–2), 29–45 Search PubMed.
- K. L. Stefanopoulos, T. A. Steriotis, F. K. Katsaros, N. K. Kanellopoulos, A. C. Hannon and J. D. F. Ramsay, Structural study of supercritical carbon dioxide confined in nanoporous silica by in situ neutron diffraction, J. Phys.: Conf. Ser., 2012, 340(1), 012049 Search PubMed.
- A. Danon, P. C. Stair and E. Weitz, FTIR study of CO2 adsorption on amine-grafted SBA-15: elucidation of adsorbed species, J. Phys. Chem. C, 2011, 115(23), 11540–11549 Search PubMed.
- G. Rother, L. Vlcek, M. S. Gruszkiewicz, A. A. Chialvo, L. M. Anovitz, J. L. Banuelos, D. Wallacher, N. Grimm and D. R. Cole, Sorption phase of supercritical CO2 in silica aerogel: experiments and mesoscale computer simulations, J. Phys. Chem. C, 2014, 118(28), 15525–15533 Search PubMed.
- S. Mohammed and G. Gadikota, CO2-Induced displacement and diffusive transport of shale geofluids in silica nanopores of varying sizes, J. CO2 Util., 2019, 32, 37–45 Search PubMed.
- S. Mohammed and G. Gadikota, Exploring the Role of Inorganic and Organic Interfaces on CO2 and CH4 Partitioning: Case Study of Silica, Illite, Calcite, and Kerogen Nanopores on Gas Adsorption and Nanoscale Transport Behaviors, Energy Fuels, 2020, 34(3), 3578–3590 Search PubMed.
- T. Le, A. Striolo and D. R. Cole, CO2–C4H10 mixtures simulated in silica slit pores: relation between structure and dynamics, J. Phys. Chem. C, 2015, 119(27), 15274–15284 Search PubMed.
- J. Liu, Y. Wei, P. Li, Y. Zhao and R. Zou, Selective H2S/CO2 separation by metal–organic frameworks based on chemical-physical adsorption, J. Phys. Chem. C, 2017, 121(24), 13249–13255 Search PubMed.
- H. Seema, K. C. Kemp, N. H. Le, S. W. Park, V. Chandra, J. W. Lee and K. S. Kim, Highly selective CO2 capture by S-doped microporous carbon materials, Carbon, 2014, 66, 320–326 Search PubMed.
- H. S. Choi and M. P. Suh, Highly selective CO2 capture in flexible 3D coordination polymer networks, Angew. Chem., Int. Ed., 2009, 48(37), 6865–6869 Search PubMed.
- A. L. Chaffee, G. P. Knowles, Z. Liang, J. Zhang, P. Xiao and P. A. Webley, CO2 capture by adsorption: materials and process development, Int. J. Greenhouse Gas Control, 2007, 1(1), 11–18 Search PubMed.
- S. Mohammed and G. Gadikota, The effect of hydration on the structure and transport properties of confined carbon dioxide and methane in calcite nanopores, Front. Energy Res., 2018, 6, 86 Search PubMed.
- S. B. Badmos, T. Bui, A. Striolo and D. R. Cole, Factors Governing the Enhancement of Hydrocarbon Recovery via H2S and/or CO2 Injection: Insights from a Molecular Dynamics Study in Dry Nanopores, J. Phys. Chem. C, 2019, 123(39), 23907–23918 Search PubMed.
- T. T. B. Le, A. Striolo and D. R. Cole, Partial CO2 Reduction in Amorphous Cylindrical Silica Nanopores Studied with Reactive Molecular Dynamics Simulations, J. Phys. Chem. C, 2019, 123(43), 26358–26369 Search PubMed.
- S. B. Badmos, N. Islam, U. Shah, A. Striolo and D. R. Cole, Competitive adsorption and reduced mobility: N-octane, CO2 and H2S in alumina and graphite pores, Mol. Phys., 2020, 1–12 Search PubMed.
- S. B. Badmos, A. Striolo and D. R. Cole, Aqueous hydrogen sulfide in slit-shaped silica nanopores: confinement effects on solubility, structural, and dynamical properties, J. Phys. Chem. C, 2018, 122(26), 14744–14755 Search PubMed.
- M. Lasich, Adsorption of H2S from Hydrocarbon Gas Using Doped Bentonite: A Molecular Simulation Study, ACS Omega, 2020, 5(31), 19877–19883 Search PubMed.
- S. Cai, Q. Li, C. Liu and X. Liu, The adsorption of hydrogen sulfide in calcite pores: A molecular simulation study, J. Mol. Liq., 2020, 299, 112253 Search PubMed.
- M. S. Santos, L. F. Franco, M. Castier and I. G. Economou, Molecular dynamics simulation of n-alkanes and CO2 confined by calcite nanopores, Energy Fuels, 2018, 32(2), 1934–1941 Search PubMed.
- M. Makaremi, K. D. Jordan, G. D. Guthrie and E. M. Myshakin, Multiphase Monte Carlo and molecular dynamics simulations of water and CO2 intercalation in montmorillonite and beidellite, J. Phys. Chem. C, 2015, 119(27), 15112–15124 Search PubMed.
- S. Mohammed, M. Liu, Y. Liu and G. Gadikota, Probing the Core-Shell Organization of Nano-Confined Methane in Cylindrical Silica Pores Using In-Situ Small-Angle Neutron Scattering and Molecular Dynamics Simulations, Energy Fuels, 2020, 34(12), 15246–15256 Search PubMed.
- T. A. Makal, J. R. Li, W. Lu and H. C. Zhou, Methane storage in advanced porous materials, Chem. Soc. Rev., 2012, 41(23), 7761–7779 Search PubMed.
- Y. He, W. Zhou, G. Qian and B. Chen, Methane storage in metal–organic frameworks, Chem. Soc. Rev., 2014, 43(16), 5657–5678 Search PubMed.
- V. Rozyyev, D. Thirion, R. Ullah, J. Lee, M. Jung, H. Oh, M. Atilhan and C. T. Yavuz, High-capacity methane storage in flexible alkane-linked porous aromatic network polymers, Nat. Energy, 2019, 4(7), 604–611 Search PubMed.
- K. M. Thomas, Hydrogen adsorption and storage on porous materials, Catal. Today, 2007, 120(3–4), 389–398 Search PubMed.
- Q. Weng, X. Wang, C. Zhi, Y. Bando and D. Golberg, Boron nitride porous microbelts for hydrogen storage, ACS Nano, 2013, 7(2), 1558–1565 Search PubMed.
- S. J. Yang, T. Kim, J. H. Im, Y. S. Kim, K. Lee, H. Jung and C. R. Park, MOF-derived hierarchically porous carbon with exceptional porosity and hydrogen storage capacity, Chem. Mater., 2012, 24(3), 464–470 Search PubMed.
- R. E. Morris and P. S. Wheatley, Gas storage in nanoporous materials, Angew. Chem., Int. Ed., 2008, 47(27), 4966–4981 Search PubMed.
- S. Ma and H. C. Zhou, Gas storage in porous metal–organic frameworks for clean energy applications, Chem. Commun., 2010, 46(1), 44–53 Search PubMed.
- Y. B. Melnichenko, H. Mayama, G. Cheng and T. Blach, Monitoring phase behavior of sub-and supercritical CO2 confined in porous fractal silica with 85% porosity, Langmuir, 2010, 26(9), 6374–6379 Search PubMed.
- S. Ciccariello, Y. B. Melnichenko and L. He, Phase behavior of carbon dioxide confined in silica aerogel in the vicinity of the bulk critical point, J. Phys. Chem. C, 2011, 115(45), 22336–22346 Search PubMed.
- A. Holewinski, M. A. Sakwa-Novak and C. W. Jones, Linking CO2 sorption performance to polymer morphology in aminopolymer/silica composites through neutron scattering, J. Am. Chem. Soc., 2015, 137(36), 11749–11759 Search PubMed.
- Y. B. Melnichenko, Small-Angle Scattering from Confined and Interfacial Fluids, Springer, 2016 Search PubMed.
- S. R. Kline, Reduction and analysis of SANS and USANS data using IGOR Pro, J. Appl. Crystallogr., 2006, 39(6), 895–900 Search PubMed.
- J. P. Perdew, K. Burke and M. Ernzerhof, Generalized gradient approximation made simple, Phys. Rev. Lett., 1996, 77(18), 3865 Search PubMed.
- J. D. Head and M. C. Zerner, A Broyden—Fletcher—Goldfarb—Shanno optimization procedure for molecular geometries, Chem. Phys. Lett., 1985, 122(3), 264–270 Search PubMed.
- A. Phan, D. R. Cole and A. Striolo, Aqueous methane in slit-shaped silica nanopores: high solubility and traces of hydrates, J. Phys. Chem. C, 2014, 118(9), 4860–4868 Search PubMed.
- T. Bui, A. Phan, D. R. Cole and A. Striolo, Transport mechanism of guest methane in water-filled nanopores, J. Phys. Chem. C, 2017, 121(29), 15675–15686 Search PubMed.
- R. T. Cygan, J. J. Liang and A. G. Kalinichev, Molecular models of hydroxide, oxyhydroxide, and clay phases and the development of a general force field, J. Phys. Chem. B, 2004, 108(4), 1255–1266 Search PubMed.
- J. J. Potoff and J. I. Siepmann, Vapor–liquid equilibria of mixtures containing alkanes, carbon dioxide, and nitrogen, AIChE J., 2001, 47(7), 1676–1682 Search PubMed.
- S. Nosé, A molecular dynamics method for simulations in the canonical ensemble, Mol. Phys., 1984, 52(2), 255–268 Search PubMed.
- W. G. Hoover, Canonical dynamics: equilibrium phase-space distributions, Phys. Rev. A: At., Mol., Opt. Phys., 1985, 31(3), 1695 Search PubMed.
- T. Darden, D. York and L. Pedersen, Particle mesh Ewald: An N·log(N) method for Ewald sums in large systems, J. Chem. Phys., 1993, 98(12), 10089–10092 Search PubMed.
- M. J. Abraham, T. Murtola, R. Schulz, S. Páll, J. C. Smith, B. Hess and E. Lindahl, GROMACS: High performance molecular simulations through multi-level parallelism from laptops to supercomputers, SoftwareX, 2015, 1, 19–25 Search PubMed.
- W. Humphrey, A. Dalke and K. Schulten, VMD: visual molecular dynamics, J. Mol. Graphics, 1996, 14(1), 33–38 Search PubMed.
- D. W. Schaefer, T. Rieker, M. Agamalian, J. S. Lin, D. Fischer, S. Sukumaran, C. Chen, G. Beaucage, C. Herd and J. Ivie, Multilevel structure of reinforcing silica and carbon, J. Appl. Crystallogr., 2000, 33, 587–591 Search PubMed.
- P. Fratzl, Small-angle scattering in materials science-a short review of applications in alloys, ceramics and composite materials, J. Appl. Crystallogr., 2003, 36(3), 397–404 Search PubMed.
- C. T. Kresge, M. E. Leonowicz, W. J. Roth, J. C. Vartuli and J. S. Beck, Ordered mesoporous molecular sieves synthesized by a liquid-crystal template mechanism, Nature, 1992, 359(6397), 710–712 Search PubMed.
- W. S. Chiang, E. Fratini, P. Baglioni, D. Georgi, J. H. Chen and Y. Liu, Methane adsorption in model mesoporous material, SBA-15, studied by small-angle neutron scattering, J. Phys. Chem. C, 2016, 120(8), 4354–4363 Search PubMed.
- W. S. Chiang, E. Fratini, P. Baglioni, J. H. Chen and Y. Liu, Pore size effect on methane adsorption in mesoporous silica materials studied by small-angle neutron scattering, Langmuir, 2016, 32(35), 8849–8857 Search PubMed.
- M. Doucet, J. H. Cho, G. Alina, J. Bakker, W. Bouwman, P. Butler and A. Washington, SasView Version 4.1, Zenodo, 2017 Search PubMed.
- S. Kallus, A. Hahn and J. D. F. Ramsay, Gas adsorption in MCM-41 porous silicas dynamic measurements using SANS, Eur. Phys. J. E: Soft Matter Biol. Phys., 2003, 12(1), 31–33 Search PubMed.
- Y. B. Melnichenko, G. D. Wignall, D. R. Cole and H. Frielinghaus, Adsorption of supercritical CO2 in aerogels as studied by small-angle neutron scattering and neutron transmission techniques, J. Chem. Phys., 2006, 124(20), 204711 Search PubMed.
- C. I. Merzbacher, J. G. Barker, K. E. Swider, J. V. Ryan, R. A. Bernstein and D. R. Rolison, Characterization of multi-phase aerogels by contrast-matching SANS, J. Non-Cryst. Solids, 1998, 225, 234–238 Search PubMed.
- H. Sun, H. Zhao, N. Qi, X. Qi, K. Zhang, W. Sun and Y. Li, Mechanistic insight into the displacement of CH4 by CO2 in calcite slit nanopores: the effect of competitive adsorption, RSC Adv., 2016, 6(106), 104456–104462 Search PubMed.
- H. Sun, H. Zhao, N. Qi and Y. Li, Simulation to enhance shale gas recovery using carbon dioxide in silica nanopores with different sizes, Energy Technol., 2017, 5(11), 2065–2071 Search PubMed.
- P. He, H. Liu, J. Zhu, Y. Li, S. Huang, P. Wang and H. Tian, Tests of excess entropy scaling laws for diffusion of methane in silica nanopores, Chem. Phys. Lett., 2012, 535, 84–90 Search PubMed.
- N. Muroyama, A. Yoshimura, Y. Kubota, K. Miyasaka, T. Ohsuna, R. Ryoo, P. I. Ravikovitch, A. V. Neimark, M. Takata and O. Terasaki, Argon adsorption on MCM-41 mesoporous crystal studied by in situ synchrotron powder X-ray diffraction, J. Phys. Chem. C, 2008, 112(29), 10803–10813 Search PubMed.
- T. Hofmann, D. Wallacher, P. Huber, R. Birringer, K. Knorr, A. Schreiber and G. H. Findenegg, Small-angle x-ray diffraction of Kr in mesoporous silica: Effects of microporosity and surface roughness, Phys. Rev. B: Condens. Matter Mater. Phys., 2005, 72(6), 064122 Search PubMed.
- A. A. Sizova, Sizov V. V., Brodskaya E. N., Adsorption of CO2/CH4 and CO2/N2 mixtures in SBA-15 and CMK-5 in the presence of water: A computer simulation study, Colloids Surf., A, 2015, 474, 76–84 Search PubMed.
- Y. Belmabkhout and A. Sayari, Adsorption of CO2 from dry gases on MCM-41 silica at ambient temperature and high pressure. 2: Adsorption of CO2/N2, CO2/CH4 and CO2/H2 binary mixtures, Chem. Eng. Sci., 2009, 64, 3729–3735 Search PubMed.
- T. Steiner, The hydrogen bond in the solid state, Angew. Chem., Int. Ed., 2002, 41(1), 48–76 Search PubMed.
Footnote |
| † Electronic supplementary information (ESI) available. See DOI: 10.1039/d0en01282c |
| This journal is © The Royal Society of Chemistry 2021 |