 Open Access Article
Anti-HIV drug repurposing against SARS-CoV-2†
Peng Sang a,
Shu-Hui Tiana,
Zhao-Hui Meng*b and
Li-Quan Yang*a
aCollege of Agriculture and Biological Science, Dali University, Dali, P. R. China. E-mail: ylqbioinfo@gmail.com
bNHC Key Laboratory of Drug Addiction Medicine, Department of Cardiology, The First Affiliated Hospital of Kunming Medical University, Kunming, P. R. China. E-mail: zhhmeng@aliyun.com
First published on 21st April 2020
Abstract
A novel severe acute respiratory syndrome human coronavirus (SARS HCoV) was identified from respiratory illness patients (named SARS-CoV-2 by ICTV) in December 2019 and has recently emerged as a serious threat to world public health. However, no approved drugs have been found to effectively inhibit the virus. Since it has been reported that HIV protease inhibitors can be used as anti-SARS drugs by targeting SARS-CoV-1 3CLpro, we chose six approved anti-HIV drugs and investigated their binding interactions with 3CLpro to evaluate their potential to become clinical drugs for the new coronavirus pneumonia (COVID-19) caused by SARS-CoV-2 infection. The molecular docking results indicate that the 3CLpro of SARS-CoV-2 has a higher binding affinity for all the studied inhibitors than does SARS-CoV-1. Two docking complexes (indinavir and darunavir) with high docking scores were further subjected to MM-PBSA binding free energy calculations to detail the molecular interactions between these two protease inhibitors and SARS HCoV 3CLpro. Our results show that, among the inhibitors tested, darunavir has the highest binding affinity with SARS-CoV-2 and SARS-CoV-1 3CLpro, indicating that it may have the potential to be used as an anti-COVID-19 clinical drug. The mechanism behind the increased binding affinity of HIV protease inhibitors toward SARS-CoV-2 3CLpro (as compared to SARS-CoV-1) was investigated by MD simulations. Our study provides insight into the possible role of structural flexibility during interactions between SARS HCoV 3CLpro and inhibitors and sheds light on structure-based design of anti-COVID-19 drugs targeting SARS-CoV-2 3CLpro.
1. Introduction
Beginning in December 2019, an outbreak of a new coronavirus pneumonia (named COVID-19 by the WHO) caused by a novel SARS HCoV (named SARS-CoV-2 by ICTV) has emerged as a serious threat to global health, with more than 2![[thin space (1/6-em)]](https://www.rsc.org/images/entities/char_2009.gif) 000
000![[thin space (1/6-em)]](https://www.rsc.org/images/entities/char_2009.gif) 000 worldwide cases resulting in more than 100
000 worldwide cases resulting in more than 100![[thin space (1/6-em)]](https://www.rsc.org/images/entities/char_2009.gif) 000 deaths as of 15 April 2020. SARS-CoV-2 has been identified as the seventh member of the coronavirus family.1 Through whole genome sequence alignment analysis, SARS-CoV-2 was found to have higher sequence homology toward SARS-CoV-1, which caused the SARS outbreak in 2003.2
000 deaths as of 15 April 2020. SARS-CoV-2 has been identified as the seventh member of the coronavirus family.1 Through whole genome sequence alignment analysis, SARS-CoV-2 was found to have higher sequence homology toward SARS-CoV-1, which caused the SARS outbreak in 2003.2
The coronavirus genome encodes four structural proteins: spike glycoprotein (S), small envelope protein (E), matrix glycoprotein (M) and nucleocapsid protein (N).3 In addition to these four structural genes, 3CLpro – a main protease required for coronavirus maturation – is vital for the viral life cycle, making it an attractive target of anti-coronavirus drug development.4–6 By sequence alignment, it has been found that SARS-CoV-2 3CLpro (3CLpro-2) and SARS-CoV-1 3CLpro (3CLpro-1) share remarkable 96% sequence identity (Fig. 1A). The crystal structure of 3CLpro-2 (PDB ID: 6LU7)7 is highly similar to that of its SARS sister 3CLpro-1 (PDB ID: 1UJ1);8 the backbone root mean square deviation (RMSD) value between these two proteins is only 1.4 Å (Fig. 1C). Both 3CLpro-2 and 3CLpro-1 contain nine α-helices and 13 β-strands that make up three distinct domains: Domain I, Domain II and Domain III (Fig. 1B).9,10 Similar to other CoV proteases, Domains I (residues 8–101) and II (residues 102–184) contain one antiparallel β-barrel, resembling the structure of trypsin-like serine proteases. Domain III (residues 201–306) consists of five α-helices (α5–α9) connected by a long loop (residues 185–200) to Domain II. In contrast to the common Ser–His–Asp catalytic triad of serine proteases, 3CLpro-2 and 3CLpro-1 has a catalytic dyad composed of conserved residues H41 and C145. The main substrate-binding site of 3CLpro is formed by a cleft between Domains I and II (Fig. 1B).
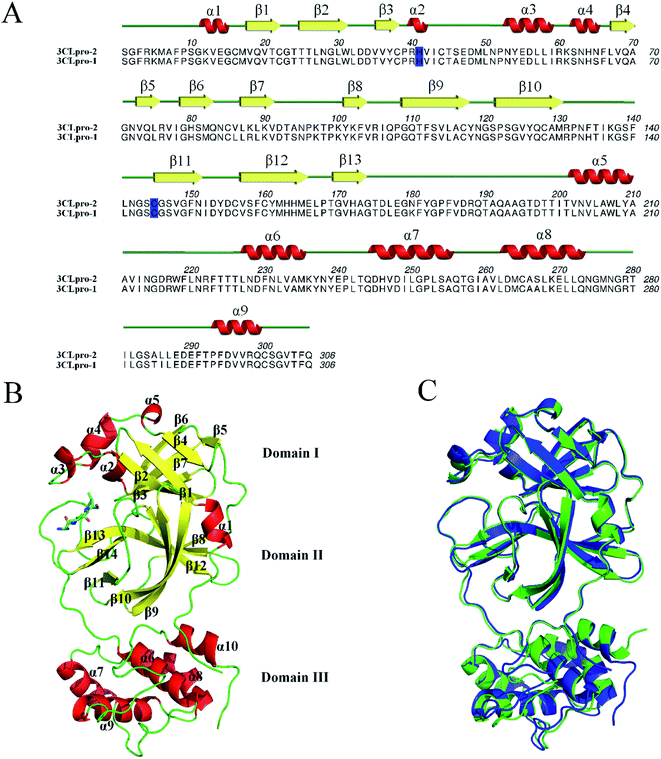 | ||
| Fig. 1 Sequence alignment and 3D structure of 3CLpro-2 and 3CLpro-1. (A) Sequence alignment and secondary structures of 3CLpro-2 and 3CLpro-1. Secondary structures are illustrated above the corresponding amino acid sequence (red helix: α-helix, yellow arrow: β-sheet), and residue numbers are indicated above the primary sequence. The H41 and C145 residues that make up the catalytic dyad are highlighted in blue. (A) was generated using Aline.14 (B) Ribbon representation of 3CLpro-2 (PDB code: 6LU7).7 Structural elements are indicated by color; α-helices are red, β-sheets are yellow, and loops are green. The peptide-like inhibitor N3 is represented as stick model. The catalytic dyad residues H41 and C145 are shown as magenta stick models. (C) Superimposed 3D structures of 3CLpro-2 (PDB code: 6LU7, blue)7 and 3CLpro-1 (PDB code: 1UJ1, green).8 (B) and (C) were generated using Pymol.15 | ||
Although the 3CLpro-2 3D structure provides deep insight into the viral life cycle and facilitates the screening of anti-COVID-19 drugs, no approved drugs have been found to effectively inhibit the virus so far. Given both the emergency of this outbreak and previous reports that HIV protease inhibitors can be used as anti-SARS drugs by targeting 3CLpro-1,11–13 we chose six public anti-HIV drugs and evaluated their potential to become clinical drugs for COVID-19 by means of molecular docking. Two of the six drug-3CLpro complexes (indinavir and darunavir) showed high docking scores and were further subjected to molecular dynamics (MD) simulation and molecular mechanics Poisson–Boltzmann surface area (MM-PBSA) binding free energy calculations. The molecular interactions between these two HIV protease inhibitors and the SARS HCoV 3CLpro were analyzed in detail, and the mechanism for the difference in binding ability between 3CLpro-2 and 3CLpro-1 and these inhibitors was also investigated.
2. Materials and methods
2.1 Preparation of the SARS HCoV structures and HIV protease inhibitors
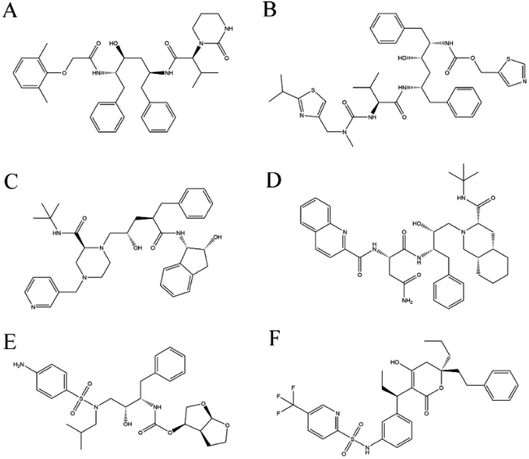
Crystal structures of 3CLpro-2 (PDB code: 6LU7)7 and 3CLpro-1 (PDB code: 1UJ1)8 were obtained from the Protein Data Bank (http://www.pdb.org), and any heteroatoms and water molecules were removed for molecular docking studies. Six HIV protease–inhibitor complex structures were downloaded from the Protein Data Bank (PDB codes: 1MUI [lopinavir], 2B60 [ritonavir], 2BPX [indinavir], 3OXC [saquinavir], 4LL3 [darunavir], 6DIF [tipranavir]), and the corresponding inhibitor (Fig. 2) was used for docking to 3CLpro-2 and 3CLpro-1.2.2 Molecular docking
Molecular docking is a widely used approach in structure-based drug design.16,17 To evaluate the binding affinity of these HIV protease inhibitors with SARS HCoV 3CLpro, comparative molecular docking analysis was carried out using Autodock 4.2.18 In docking simulations, the grid box was defined according the peptide-like inhibitor binding pocket of 3CLpro-2 (Fig. 3). The size of the affinity map was set at 40 Å × 50 Å × 40 Å, and spacing between the grid points was set to 0.375 Å. Docking was performed with Lamarckian genetic algorithm and default parameters. The best docked conformations (3CLpro–inhibitor complexes) with the lowest docking energies were selected for further MD simulations and MM-PBSA binding free energy calculations.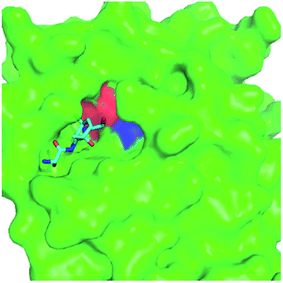 | ||
| Fig. 3 Binding pocket of 3CLpro-2 (PDB code: 6LU7). Structure of 3CLpro-2 is shown as a molecular surface model in green. The peptide-like inhibitor N3 is represented as a stick model. The H41 and C145 residues making up the catalytic dyad are highlighted in red and blue, respectively. | ||
2.3 MD simulation
In order to explore the molecular interactions between HIV protease inhibitors and the SARS HCoV 3CLpro, as well as to investigate the mechanism behind the difference in binding ability between 3CLpro-2 and 3CLpro-1 and these inhibitors, two kinds of MD simulations were performed: SARS HCoV 3CLpro–inhibitor complex (3CLpro-2–inhibitor and 3CLpro-1–inhibitor) and SARS HCoV 3CLpro free enzyme (free 3CLpro-2 and free 3CLpro-1). All simulations were carried out using the GROMACS-5.1.4 software package19 with the CHARMM36 all-atom force field (March, 2019).20 The force fields of all HIV protease inhibitors were generated by the CGenFF server.21,22Each simulation system was dissolved using the TIP3P water model23 and centered in a dodecahedron box with a 1.0 nm minimum distance between the protein and the edge of the box. The steepest descent algorithm was used to minimize simulation energy. The systems were equilibrated by two continuous 500 ps position restraint simulations of 1000 kJ mol−1 nm−2 in the NVT and NPT ensembles. All equilibrated systems were then subjected to production MD runs. Other simulation parameters and conditions were the same as ref. 24.
The equilibrium of MD simulations were examined by computing the backbone root mean square standard deviation (RMSD) with respect to their starting structures as a function of simulation time. The results (Fig. S1 and S2†) show that the free 3CLpro-2 and 3CLpro-1 systems require only a few ps to reach stable RMSD values, and the 3CLpro-2–inhibitor and 3CLpro-1–inhibitor systems require about 4000 ps and about 500 ps to reach an approximate equilibrium, respectively.
2.4 Binding free energy calculation
The MM-PBSA method was used to compute the binding free energy of SARS HCoV 3CLpro–inhibitor complexes during simulation. A detailed description of the MM-PBSA method is presented in ref. 25. In this study, the binding free energies of SARS HCoV 3CLpro to HIV protease inhibitors and N3 were calculated using the GROMACS tool g_mmpbsa.26 When using MM-PBSA, the binding free energy of the protein and ligand was defined as| ΔGbinding = ΔGcomplex − (ΔGprotein + ΔGligand) |
For each subunit, the free energy, G, can be presented as
| G = EMM + Gsol − TS |
| EMM = Eele + Evdw |
Gsol represents the solvation free energy, which includes both electrostatic (Gpolar) and non-electrostatic (Gnonpolar) components and interprets them as
| Gsol = Gpolar + Gnonpolar |
Since the contribution of the entropic term (TS) is negligible when the computing models are very similar11 and calculating the contribution of entropy to the binding free energy is challenging and time-consuming, the contribution of the entropic term is excluded in current version of g_mmpbsa.
3. Results and discussion
3.1 Molecular docking of HIV protease inhibitors against SARS HCoV 3CLpro
We chose six approved anti-HIV inhibitors to evaluate their potential to become clinical drugs for COVID-19. As shown in Table 1, 3CLpro-2 has a lower binding energy for all the studied inhibitors than its sister 3CLpro-1, although both of their binding energies are higher than all of the HIV protease-inhibitor complexes that served as positive controls. This indicates that the binding affinities of 3CLpro-2 towards inhibitors are higher than that of 3CLpro-1. Of the six HIV protease inhibitors, indinavir and darunavir were proven to have a higher binding affinity to 3CLpro-2, and their binding energy values are close to those of HIV protease inhibitors. When compared, the binding energy of the 3CLpro-2–darunavir complex (−10.24 kJ mol−1) is lower than that of its 3CLpro-2–indinavir counterpart (−10.02 kJ mol−1), indicating that the binding affinity of darunavir towards 3CLpro-2 might be higher than that of indinavir. Since 3CLpro is essential for coronavirus replication,9 the inhibitory effect of these two compounds on 3CLpro-2 indicates that they might have potential application as anti-COVID-19 clinical drugs.| Inhibitor | Binding energy (kJ mol−1) | ||
|---|---|---|---|
| 3CLpro-2 | 3CLpro-2 | HIV protease | |
| Lopinavir | −5.49 | −2.12 | −5.78 |
| Ritonavir | −2.34 | −1.42 | −5.17 |
| Indinavir | −10.02 | −7.49 | −11.56 |
| Saquinavir | −8.26 | −5.3 | −11.82 |
| Darunavir | −10.24 | −7.5 | −10.85 |
| Tipranavir | −5.8 | −4.4 | −11.07 |
The binding modes of indinavir and darunavir in their docking complexes are shown in Fig. 3. For 3CLpro-2 (Fig. 4A and B), the binding pockets are in a more closed state; indinavir and darunavir bind deeper into the pocket, both with 19 contact residues. In contrast, the 3CLpro-1 binding pocket is in a more open state (Fig. 4C and D), and there are only 11 and 17 contact residues in 3CLpro-1–indinavir and 3CLpro-1–darunavir complexes, respectively. These additional contact residues likely strengthen the binding affinity between 3CLpro-2 and the tested inhibitors, potentially explaining why the binding energy values between them are lower than those of 3CLpro-1–inhibitor complexes. Of note, darunavir forms five and three hydrogen bonds with 3CLpro-2 and 3CLpro-1, respectively. In contrast, no hydrogen bonds are formed between indinavir and either of the two 3CLpro species. Since hydrogen bonding plays an important role in the stability of the enzyme–inhibitor complex,27 darunavir might be more suitable for treatment of COVID-19.
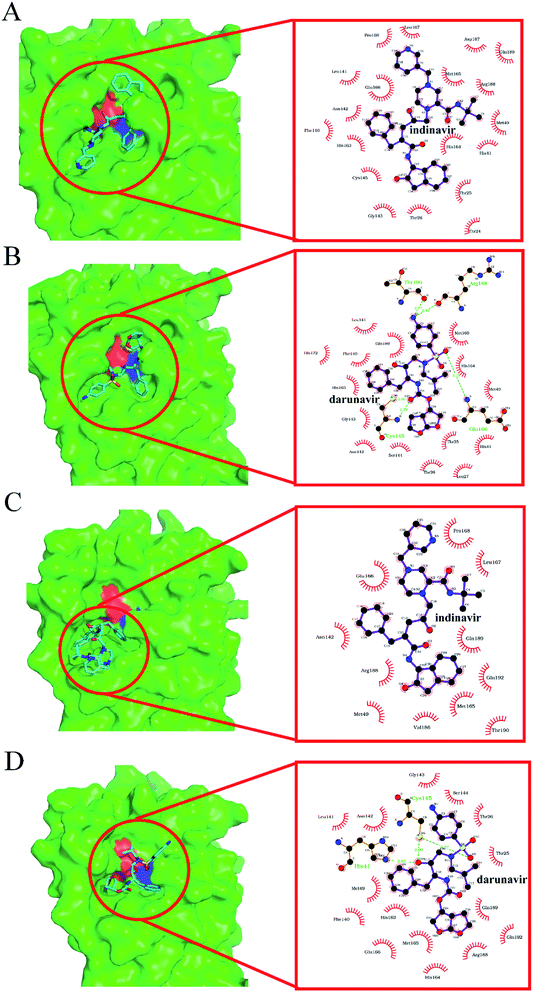 | ||
| Fig. 4 Predicted binding modes obtained from docking simulation analyses of indinavir and darunavir toward 3CLpro-2 and 3CLpro-1. Notes: structures of 3CLpro are shown as molecular surface models in green. Indinavir and darunavir are represented as stick models, and their contact residues in 3CLpro are defined by the LigPlot program.28 The H41 and C145 residues making up the catalytic dyad are highlighted in red and blue, respectively. The hydrogen bonds formed between the two inhibitors and 3CLpro residues are labeled in green. (A) 3CLpro-2–indinavir complex. Indinavir binds deeply into its pocket, makes contact with 19 residues and forms zero hydrogen bonds with 3CLpro. (B) 3CLpro-2–darunavir complex. Darunavir binds deeply into its pocket, makes contact with 19 residues and forms five hydrogen bonds with 3CLpro. (C) 3CLpro-1–indinavir complex. Indinavir binds shallowly to the surface of its pocket, makes contact with 11 residues, and forms zero hydrogens bond with 3CLpro. (D) 3CLpro-1–darunavir complex. Darunavir binds shallowly to the surface of its pocket, makes contact with 17 residues and forms three hydrogen bonds with 3CLpro. | ||
3.2 Binding free energy calculation
In order to explore the binding mechanisms of SARS HCoV 3CLpro to indinavir and darunavir, four docked complex structures (i.e., 3CLpro-2–indinavir, 3CLpro-2–darunavir, 3CLpro-1–indinavir, 3CLpro-1–darunavir) and the crystal structure of 3CLpro-2 in complex with a peptide-like inhibitor N3 which was served as a control, were subjected to 20 ns molecular dynamics simulations. The simulation trajectories were used to calculate the binding free energy by the MM-PBSA method. As presented in Table 2, the binding free energy of 3CLpro-2 is about 50% of that of 3CLpro-1 for both indinavir and darunavir, suggesting that these two inhibitors bind more tightly to the former. Close examination of Table 2 suggests that the primary forces driving the binding events for both 3CLpro-2 and 3CLpro-1 are vacuum potential energy (ΔEMM) and nonpolar energies (ΔGnonpolar). In contrast, polar energies (ΔGpolar) negatively contribute to the binding events.| Energy Components (kJ mol−1) | 3CLpro-2 | 3CLpro-1 | |||
|---|---|---|---|---|---|
| N3 | Indinavir | Darunavir | Indinavir | Darunavir | |
| a Notes: ΔGbinding = EMM + Gsol; EMM = Eele + Evdw; Gsol = Gpolar + Gnonpolar. | |||||
| ΔEele | −23.61 | −54.98 | −24.23 | −5.17 | −30.29 |
| ΔEvdw | −119.28 | −171.55 | −172.71 | −68.23 | −138.96 |
| ΔEMM | −142.89 | −226.53 | −196.94 | −73.4 | −169.25 |
| ΔGpolar | 108.1 | 173.57 | 121.27 | 45.8 | 138.74 |
| ΔGnonpolar | −16.28 | −19.15 | −19.86 | −9.3 | −16.58 |
| ΔGsol | 91.82 | 154.42 | 101.41 | 36.5 | 122.16 |
| ΔGbinding | −51.07 | −72.11 | −95.53 | −36.9 | −47.09 |
As listed in Table 2, for 3CLpro-2, the binding free energy to N3 is higher than either of indinavir and darunavir. In accordance with the molecular docking results, the final binding free energy value for darunavir and 3CLpro-2 is lower than that of indinavir (−72.11 kJ mol−1 for indinavir and −95.53 kJ mol−1 for darunavir), indicating the higher binding affinity of the former towards 3CLpro as compared to the latter. Detailed decomposition of the energy components reveals that the decreased binding free energy of darunavir is mainly due to the reduced negative contribution of ΔGpolar (173.57 kJ mol−1 for indinavir and 121.27 kJ mol−1 for darunavir), although the positive contribution of ΔEMM is even lower than for indinavir (−226.53 kJ mol−1 for indinavir and −196.94 kJ mol−1 for darunavir). Taken together, these results suggest that darunavir could be used as template for structure-based design of SARS-CoV-2 3CLpro inhibitors, and may also have the potential to become an anti-COVID-19 clinical drug.
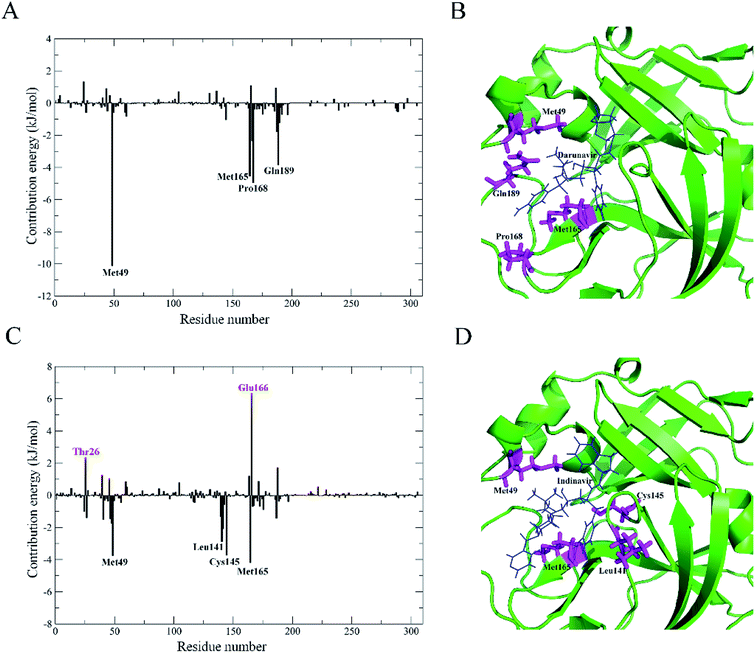
The contribution of residues to the binding energy of 3CLpro-2–darunavir and 3CLpro-2–indinavir complex structures were calculated by the g_mmpbsa tool. As shown in Fig. 5A and B, for 3CLpro-2–darunavir, residues Met49, Met165, Pro168 and Gln189 make significant positive contributions to binding. For 3CLpro-2–indinavir (Fig. 5C and D), besides residues Met49 and Met165, residues making significant positive contributions also include Leu41 and Cys145. In contrast to 3CLpro-2–darunavir, there are two residues (Thr26 and Glu166) making significant negative contributions to binding in 3CLpro-2–indinavir, which might interpret the lower binding affinity of indinavir to 3CLpro-2 than darunavir.
Taken together, darunavir which could be used as template for structure-based design of 3CLpro-2 inhibitors, might has the potential to become an anti-COVID-19 clinical drug.
3.3 Dynamic properties of 3CLpro-2 and 3CLpro-1
In order to investigate the mechanism behind the increased binding affinity of HIV protease inhibitors toward 3CLpro-2 compared to that of 3CLpro-1, 100 ns MD simulations were performed on these two free enzymes without any inhibitor. Based on the obtained MD trajectories, the root mean square fluctuation (RMSF) for each residue was calculated in order to compare the structural flexibility of 3CLpro-2 and 3CLpro-1. The resulting RMSFs are displayed in Fig. 6 as a function of residue number, and the 3D backbone representations of 3CLpro are colored according to their RMSF values. As shown in Fig. 6, 3CLpro-2 has an higher overall flexibility (or lower rigidity) than 3CLpro-1 in Domains I and II. Close examination of Fig. 6 reveals that 3CLpro-1 displays lower flexibility in some regions of surface-exposed loops, especially those within the substrate binding pocket (Fig. 6B and C). Interestingly, when examining the Domain III region, 3CLpro-2 is less flexible (i.e., more rigid) than 3CLpro-1. It is well established that flexibility plays a significant role in protein function.29 For example, higher flexibility could enlarge the substrate binding pocket, thus increasing the kinetics of substrate entrance and product egress.30 In addition, high flexibility could also increase substrate binding affinity.31 Therefore, the lower flexibility in Domains I and II, especially within the substrate binding pocket, might explain why the binding affinity of HIV protease inhibitors toward 3CLpro-2 is higher than that of 3CLpro-1.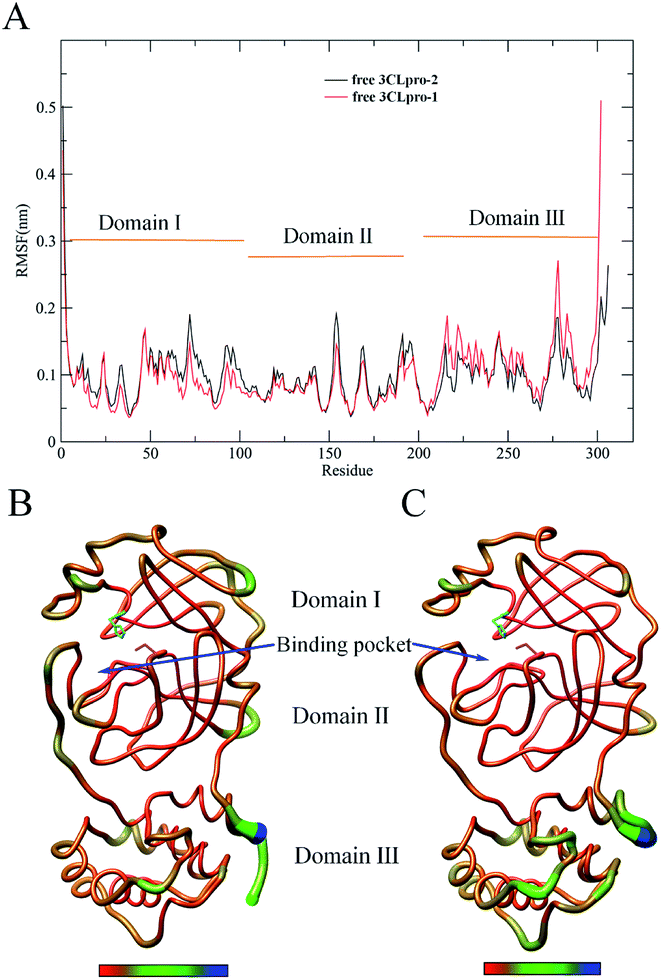 | ||
| Fig. 6 Comparison between the structural flexibility of 3CLpro-2 and 3CLpro-1. (A) Per-residue average backbone RMSF profiles calculated from MD trajectories of 3CLpro-2 (black line) and 3CLpro-1 (red line). (B) and (C) are 3D backbone representations of 3CLpro-2 and 3CLpro-1 structures mapped with per-residue average backbone RMSF values, respectively. The backbone color ranges from red to blue and corresponds to a line from thin to thick denoting that the backbone RMSF varies from the lowest to the highest values. The H41 and C145 residues making up the catalytic dyad are represented in cyan and magenta stick models, respectively. (B) and (C) were generated using UCSF Chimera.32 | ||
4. Conclusion
A novel severe acute respiratory syndrome coronavirus (SARS-CoV-2) was identified from respiratory illness patients in December 2019, and has recently emerged as a serious threat to world public health. However, no approved drugs have been found to effectively inhibit the virus. Given the urgency of the current epidemic situation, it would be highly effective to repurpose old drugs for clinical treatment. It has been reported that HIV inhibitors can be used as anti-SARS clinical treatment drugs, as they target SARS-CoV-1 3CLpro. In this study, we chose six approved anti-HIV inhibitor drugs to evaluate and compare their binding affinities with SARS-CoV-2 and SARS-CoV-1 3CLpro by molecular docking and MM-PBSA binding free energy calculations. Our results show that, among all inhibitors, darunavir has the best binding affinity with SARS-CoV-2 and SARS-CoV-1 3CLpro, indicating that it might have the potential to become an anti-COVID-19 clinical drug. The mechanism behind the increased binding affinity of HIV protease inhibitors toward SARS-CoV-2 3CLpro over SARS-CoV-1 3CLpro was investigated by MD simulations. The calculated RMSF values for each residue during simulation indicate lower flexibility in the Domain I and Domain II regions of SARS-CoV-1, especially within the substrate binding pocket; this might explain why the binding affinities of HIV protease inhibitors toward SARS-CoV-2 3CLpro are higher than those of SARS-CoV-1. Our study provides insight into the possible role of structural flexibility in regulating interactions between SARS HCoV 3CLpro and inhibitors and sheds light on structure-based design of anti-COVID-19 drugs targeting SARS-CoV-2 3CLpro.Conflicts of interest
The authors declare no conflicts of interest for this work.Acknowledgements
This study was funded by the National Natural Sciences Foundation of China (31860243, 31960198 and 31660015, 81860074) and Yunnan Applied Basic Research Projects (2017FH001-032 and 2017FB024). We greatly acknowledge the help of Roger DuBois in revising the manuscript.References
- N. Zhu, D. Zhang, W. Wang, X. Li, B. Yang, J. Song, X. Zhao, B. Huang, W. Shi and R. Lu, N. Engl. J. Med., 2020, 382, 727–733 CrossRef CAS PubMed
.
- X. Xu, P. Chen, J. Wang, J. Feng, H. Zhou, X. Li, W. Zhong and P. Hao, Sci. China: Life Sci., 2020, 63, 457–460 CrossRef PubMed
.
- A. D. Reddy, S. B. Suh, R. Ghaffari, N. J. Singh, D.-J. Kim, J. H. Han and K. S. Kim, Bull. Korean Chem. Soc., 2003, 24, 899–900 CrossRef CAS
.
- B. Xia and X. Kang, Protein Cell, 2011, 2, 282–290 CrossRef CAS PubMed
.
- I. L. Lu, N. Mahindroo, P. H. Liang, Y. H. Peng, C. J. Kuo, K. C. Tsai, H. P. Hsieh, Y. S. Chao and S. Y. Wu, J. Med. Chem., 2006, 49, 5154–5161 CrossRef CAS PubMed
.
- L. Wang, B. B. Bao, G. Q. Song, C. Chen, X. M. Zhang, W. Lu, Z. Wang, Y. Cai, S. Li, S. Fu, F. H. Song, H. Yang and J. G. Wang, Eur. J. Med. Chem., 2017, 137, 450–461 CrossRef CAS PubMed
.
- Z. M. Jin, X. Y. Du, Y. C. Xu, Y. Q. Deng, M. Q. Liu, Y. Zhao, B. Zhang, X. F. Li, L. K. Zhang, C. Peng, Y. K. Duan, J. Yu, L. Wang, K. L. Yang, F. J. Liu, R. D. Jiang, X. L. Yang, T. You, X. C. Liu, X. N. Yang, F. Bai, H. Liu, X. Liu, L. W. Guddat, W. Q. Xu, G. F. Xiao, C. F. Qin, Z. L. Shi, H. L. Jiang, Z. H. Rao and H. T. Yang, Nature, 2020 DOI:10.1038/s41586-020-2223-y
.
- H. Yang, M. Yang, Y. Ding, Y. Liu, Z. Lou, Z. Zhou, L. Sun, L. Mo, S. Ye and H. Pang, Proc. Natl. Acad. Sci. U. S. A., 2003, 100, 13190–13195 CrossRef CAS PubMed
.
- Y. M. Báez-Santos, S. E. S. John and A. D. Mesecar, Antiviral Res., 2015, 115, 21–38 CrossRef PubMed
.
- C. C. Lee, C. J. Kuo, M. F. Hsu, P. H. Liang, J. M. Fang, J. J. Shie and A. H. J. Wang, FEBS Lett., 2007, 581, 5454–5458 CrossRef CAS PubMed
.
- V. Nukoolkarn, V. S. Lee, M. Malaisree, O. Aruksakulwong and S. Hannongbua, J. Theor. Biol., 2008, 254, 861–867 CrossRef CAS PubMed
.
- X. W. Zhang and Y. L. Yap, Bioorg. Med. Chem., 2004, 12, 2517–2521 CrossRef CAS PubMed
.
- N. Yamamoto, R. Yang, Y. Yoshinaka, S. Amari, T. Nakano, J. Cinatl, H. Rabenau, H. W. Doerr, G. Hunsmann and A. Otaka, Biochem. Biophys. Res. Commun., 2004, 318, 719–725 CrossRef CAS PubMed
.
- C. S. Bond and A. W. Schuttelkopf, Acta Crystallogr., Sect. D: Biol. Crystallogr., 2009, 65, 510–512 CrossRef CAS PubMed
.
- The PyMOL Molecular Graphics System, Version 2.0 Schrödinger, LLC Search PubMed
.
- R. J. Wu, T. Ren, J. Y. Gao, L. Wang, Q. Yu, Z. Yao, G. Q. Song, W. B. Ruan, C. W. Niu, F. H. Song, L. X. Zhang, M. Li and J. G. Wang, Eur. J. Med. Chem., 2019, 162, 348–363 CrossRef CAS PubMed
.
- P. Sang, W. Hu, Y. J. Ye, L. H. Li, C. Zhang, Y. H. Xie and Z. H. Meng, J. Biomol. Struct. Dyn., 2017, 35, 2441–2453 CrossRef CAS PubMed
.
- D. S. Goodsell, G. M. Morris and A. J. Olson, J. Mol. Recognit., 1996, 9, 1–5 CrossRef CAS PubMed
.
- B. Hess, C. Kutzner, D. Van Der Spoel and E. Lindahl, J. Chem. Theory Comput., 2008, 4, 435–447 CrossRef CAS PubMed
.
- R. B. Best, X. Zhu, J. Shim, P. E. Lopes, J. Mittal, M. Feig and A. D. MacKerell Jr, J. Chem. Theory Comput., 2012, 8, 3257–3273 CrossRef CAS PubMed
.
- K. Vanommeslaeghe, E. Hatcher, C. Acharya, S. Kundu, S. Zhong, J. Shim, E. Darian, O. Guvench, P. Lopes and I. Vorobyov, J. Comput. Chem., 2010, 31, 671–690 CAS
.
- W. Yu, X. He, K. Vanommeslaeghe and A. D. MacKerell Jr, J. Comput. Chem., 2012, 33, 2451–2468 CrossRef CAS PubMed
.
- W. L. Jorgensen, J. Chandrasekhar, J. D. Madura, R. W. Impey and M. L. Klein, J. Phys. Chem., 1983, 79, 926–935 CrossRef CAS
.
- P. Sang, Y. H. Xie, L. H. Li, Y. J. Ye, W. Hu, J. Wang, W. Wan, R. Li, L. J. Li and L. L. Ma, Comput. Biol. Chem., 2017, 67, 141–149 CrossRef CAS PubMed
.
- C. Wang, D. A. Greene, L. Xiao, R. Qi and R. Luo, Front. Mol. Biosci., 2018, 4, 87 CrossRef PubMed
.
- R. Kumari, R. Kumar, O. S. D. D. Consortium and A. Lynn, J. Chem. Inf. Model., 2014, 54, 1951–1962 CrossRef CAS PubMed
.
- X. Du, Y. Li, Y. L. Xia, S. M. Ai, J. Liang, P. Sang, X. L. Ji and S. Q. Liu, Int. J. Mol. Sci., 2016, 17, 144 CrossRef PubMed
.
- R. A. Laskowski and M. B. Swindells, J. Chem. Inf. Model., 2011, 51, 2778–2786 CrossRef CAS PubMed
.
- M. Kokkinidis, N. Glykos and V. Fadouloglou, Adv. Protein Chem. Struct. Biol., 2012, 87, 181–218 CAS
.
- J. Chen, H. Chen, Y. Shi, F. Hu, X. Lao, X. Gao, H. Zheng and W. Yao, PLoS One, 2013, 8(12), e82080 CrossRef PubMed
.
- S. Q. Liu, Y. Tao, Z. H. Meng, Y. X. Fu and K. Q. Zhang, J. Mol. Model., 2011, 17, 289–300 CrossRef CAS PubMed
.
- E. F. Pettersen, T. D. Goddard, C. C. Huang, G. S. Couch, D. M. Greenblatt, E. C. Meng and T. E. Ferrin, J. Comput. Chem., 2004, 25, 1605–1612 CrossRef CAS PubMed
.
Footnote |
| † Electronic supplementary information (ESI) available. See DOI: 10.1039/d0ra01899f |
| This journal is © The Royal Society of Chemistry 2020 |

