 Open Access Article
Microfluidic centrifugation assisted precipitation based DNA quantification†
I.
Banerjee
 *a,
S. G.
Aralaguppe
 b,
N.
Lapins
a,
W.
Zhang
ab,
A.
Kazemzadeh
 a,
A.
Sönnerborg
 b,
U.
Neogi
 ab and
A.
Russom
 *a
*a
aDivision of Nanobiotechnology, Department of Protein Science, School of Engineering Sciences in Chemistry, Biotechnology and Health, KTH Royal Institute of Technology, Sweden. E-mail: inba@kth.se; aman@kth.se
bDivision of Clinical Microbiology, Department of Laboratory Medicine, Karolinska Institute, Sweden
First published on 20th March 2019
Abstract
Nucleic acid amplification methods are increasingly being used to detect trace quantities of DNA in samples for various diagnostic applications. However, quantifying the amount of DNA from such methods often requires time consuming purification, washing or labeling steps. Here, we report a novel microfluidic centrifugation assisted precipitation (μCAP) method for single-step DNA quantification. The method is based on formation of a visible precipitate, which can be quantified, when an intercalating dye (GelRed) is added to the DNA sample and centrifuged for a few seconds. We describe the mechanism leading to the precipitation phenomenon. We utilize centrifugal microfluidics to precisely control the formation of the visible and quantifiable mass. Using a standard CMOS sensor for imaging, we report a detection limit of 45 ng μl−1. Furthermore, using an integrated lab-on-DVD platform we recently developed, the detection limit is lowered to 10 ng μl−1, which is comparable to those of current commercially available instruments for DNA quantification. As a proof of principle, we demonstrate the quantification of LAMP products for a HIV-1B type genome containing plasmid on the lab-on-DVD platform. The simple DNA quantification system could facilitate advanced point of care molecular diagnostics.
Introduction
Infectious diseases are currently responsible for one third of all human deaths globally. According to one report, by 2050, 13 to 15 million deaths annually may be due to infectious diseases.1 The vast majority of these deaths are expected in developing countries, where access to appropriate medical facilities and trained medical personnel is often lacking.2 As such, low cost microfluidic based diagnostic methods suitable for use in such resource limited settings may offer an ideal diagnostic solution for delivering the most appropriate medication.3 Recently, nucleic acid amplification tests (NAATs) have emerged as comprehensive tests for detecting trace quantities of pathogenic DNA based on different amplification methods, including polymerase chain reaction (PCR),4,5 loop mediated isothermal amplification (LAMP),6,7 rolling circle amplification (RCA)8,9 and recombinase polymerase amplification (RPA).10,11 All these methods can amplify a very low concentration of DNA in the presence of a specific set of primers and polymerase enzymes to yield a million-fold increase in the concentration of target DNA.Detection of amplified DNA is often based on measurement of turbidity,12 fluorescence after staining with a detection dye13 or absorbance.14 Commercially available instruments for DNA quantification can be broadly divided into three categories: instruments that measure turbidity (e.g. Illumigene),12 ultraviolet spectrophotometers (e.g. Nanodrop),15 and instruments based on measurement of DNA fluorescence, such as plate readers16 and fluorometers (e.g. Qubit).17 One bottleneck in quantifying amplified DNA in a NAAT reaction based on absorbance based measurement techniques is the bias18 introduced due to the presence of isothermal amplification buffer, dNTPs and other reagents. Each reagent or buffer may have an absorbance density at around 260 nm, elevating the apparent concentration measured by the device compared to the actual value. Hence, for most quantification based NAATs, it is important to include an extra DNA purification step, which may result in non-negligible loss of the amplified product to be measured. The detection also becomes more expensive due to the added cost of the purification kit. Measurements based on fluorescence mostly use fluorescent dyes that are potentially hazardous for handling.19 In addition, fluorescence based quantification methods require time consuming labelling and washing steps as well as access to a fluorescence reader.
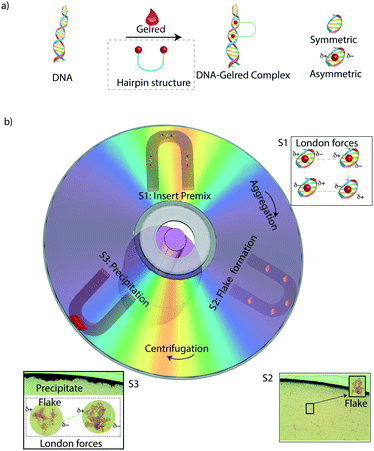
We describe a new method that we term microfluidic centrifugation assisted precipitation (μCAP) to quantify DNA. The μCAP method is based on mixing an intercalating dye, GelRed, with DNA followed by short centrifugation to form a visible precipitate. The visible precipitate is formed after just a few seconds of centrifugation and is proportional to the quantity of DNA, which enables quantitative measurement of the nucleic acid. There have been only a few prior reports that studied the formation of a complex when DNA interacted with GelRed. One recent study reported an increased contour length of DNA in contact with GelRed using single-molecule stretching and dynamic light-scattering (DLS) experiments.20 Another prior report described a method for label-free fluorescence detection of Cu(II) ions based on internal DNA cleavage and an extrinsic fluorophore, which was generated when graphene and the DNAzyme complex reacted with GelRed.21 However, to the best of our knowledge, a visible precipitate formed as a product of centrifugation of intercalated DNA has not been reported. The precipitate formation is based on DNA forming an asymmetrical molecular structure upon intercalation with GelRed.22 When an asymmetric intercalated DNA–GelRed complex molecule with local dipoles comes close to another such complex molecule, it starts forming an aggregate due to acting London forces between oppositely charged dipoles on the molecules.23–25 The added effect of centrifugation enhances the aggregation process leading to formation of a visible precipitate.
We evaluated the μCAP method for DNA quantification with two optical detection systems: a CMOS camera and a lab-on-DVD platform26–28 we recently developed. While the conventional CMOS camera is found to be suitable for DNA quantification, we achieve a higher sensitivity with the lab on DVD platform, with a detection limit of 10 ng μl−1. Based on the generated calibration curve from measured PCR generated DNA, we used the lab-on-DVD platform to quantify LAMP assay products for a HIV-1B type genome containing plasmid.
Materials and methods
Apparatus
We tested two different optical systems for DNA quantification: a USB CMOS camera (UI-3360CP, IDS, Germany) and the integrated lab on DVD platform. The CMOS camera is a part of a custom built centrifugal microfluidic setup that also consists of a cylindrical photoelectric sensor (SICK AG, Germany), a DC motor (Maxon 148867, Switzerland), and a stroboscope (DT311A-2, Shimpo Instruments, USA). Such assemblies are common in the field of centrifugal microfluidics for capturing dynamic processes on a rotating disc, and interested readers can refer to Kido et al.29 for a better understanding of the assembly of an identical centrifugal microfluidic system. We also captured microscopy images of the DNA–GelRed complex formed on the modified microfluidic DVD platform with an optical microscope (MB220 series, BW Optics, China) at 10× and 20× optical zoom to understand the mechanism of the precipitate formation.The second system, lab on DVD, comprises a DVD motor for centrifugation, a laser source and a photodiode array, all inside one portable box. Fig. S1†, as well as two of our previous publications,27,30 explains the inside schematics of the modified DVD platform. Briefly, the transmitted light from the laser source passes through the partially optically transparent DVD and is captured by the photodiode (PD) array. All the images generated in the PD array are stitched together in custom built software for the modified DVD platform. The modified DVD platform has the capability to deliver high resolution images down to 1 μm in size. The polymer disc read by the modified DVD platform consists of an injection molded transparent disc with embedded microfluidic channels (150 μm height), bonded on top of a DVD substrate to form a multi-layer microfluidic device. The fabrication process of the microfluidic DVD platform was the same as described in our previous report.30 Briefly, a 0.6 mm DVD substrate was bonded to injection-molded polycarbonate substrates. The polycarbonate substrate was screen printed with a UV-curable adhesive layer with the U-shaped microfluidic channels masked, such that the UV adhesive was only deposited on the non-channel regions. The two half-substrates were aligned and bonded in a custom made vacuum lamination instrument and pressed together. The assembly was completed with 20 s exposure to UV light to form a permanent bond between the two substrates.
Nucleic acid samples
For quantification of the DNA amount, first a premix of the nucleic acid sample along with GelRed is dispensed into the U-shaped channel. GelRed is diluted in water to a concentration of 4000×, and a volume 3 μl is added to 10 μl of the DNA sample. This concentration was optimized according to our experimental conditions and using it in other similar microfluidic geometries might need further optimization of the GelRed concentration. The loading of the DNA–GelRed premix is followed by spinning at 3600 rpm and imaging.We used a known amount of PCR products to calibrate the method. HIV genome that was amplified from 50 ng of pNL4.3 using the primers 0776F and 6231R were used.31 Briefly, Kapa Hifi Taq DNA polymerase (Cat#KR0369, KAPABiosystems) was incubated under the standard PCR conditions by heating the reaction mixture at 95 °C for 5 min for initial denaturation, followed by 30 cycles of denaturation at 98 °C for 20 seconds, annealing at 65 °C for 15 seconds and extension at 72 °C for 3 min, followed by final extension at 72 °C for 5 min. The amplified PCR product was purified using a Qiaquick PCR purification kit (Cat#28104, Qiagen). Several diluted concentrations of the PCR product were measured with a spectrophotometer, Nanodrop (Thermofisher Scientific, USA), for calibration.
Finally, we tested the effectiveness of the μCAP method for DNA quantification by evaluating the amplified products from a LAMP assay with the lab on DVD platform. The sensitivity of LAMP primers was tested on DNA from pNL4.3 (a HIV-1B genome containing plasmid). A 25× LAMP primer mix was prepared based on the study of Curtis et al.32 with the same template DNA sequence, set of primers and DNA polymerase. Eight concentrations of the HIV-1B genome containing plasmid (pNL4.3) were tested starting from 0.2 ng μl−1 DNA template serially diluted to 0.002 fg μl−1, in a volume of 5 μl for each concentration. Two negative controls were prepared, one without DNA and primers and one without primers. The total reaction volume was increased to 30 μl instead of 25 μl (by Curtis et al.32) by multiplying every component volume in the reaction by a factor of 1.2. This ensured a 10 microliter volume in each DVD chamber in triplicate. The DVD was then inserted in a 65 °C oven for 45 minutes to amplify the LAMP assay. During the incubation step, the holes for sample insertion on the U-shaped channel are closed with an adhesive (ARCARE 90445, Adhesives Research, USA) to prevent sample evaporation or loss.
Software code and imaging
The lab on DVD system and the CMOS camera (UI-3360CP, IDS, Germany) were used to generate images of the precipitation zone on the surface of the disc. To quantify the amount of precipitate, an image processing script was written in MATLAB software (Mathworks, USA). The image analysis was carried out using the image analysis toolbox in MATLAB that has inbuilt features for image filtering, image reconstruction, segmentation, classification and representation.The first step in the image processing code (section S2†) is finding the size of the image and normalizing it with the size of the calibration image that has a known concentration of DNA. The next step is to convert the image to grayscale and find out if the image is a blank or contains a precipitate. For blank images (without DNA), only the microfluidic channel edges are seen in the image. To prevent interference, the range of pixel values of the microfluidic channel edges was filtered out from the image. When a blank image is found, the code does not proceed ahead.
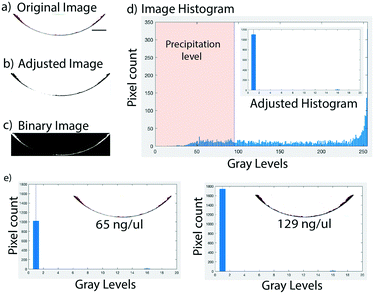
After the blank image elimination step, the next step is to adjust the image so that the visible precipitation looks darker than the rest of the image, by saturating the bottom 45% and the top 45% of all pixel values in the image. The script then chooses an adaptive threshold value where there is maximum dark intensity. At this threshold value, only the precipitate can be seen in a binary image i.e., the white area denotes the precipitate in the binary image while every other intensity in the image is shown as black. As a result, a histogram plot is generated (y axis: pixel counts, x axis: gray levels) which distinguishes the amount of the precipitate from the rest of the image. The gray levels or intensity at each of the pixel counts at or below this threshold value is then added together, which generates an arbitrary value known as the “precipitation level”. This “precipitation level” value takes into account the number of pixels over which the precipitate is spread on the surface of the disc (pixel count) for a particular intensity, multiplied by the corresponding intensity (gray levels) corresponding to that pixel count. The precipitation level gives a volumetric measurement of the amount of precipitate in the image. Thus, a low concentration of DNA will produce a lower pixel count value at the threshold gray level compared to a high concentration of DNA. The same image processing code is used for both the DVD and CMOS camera images with modifications in multiplication factors to account for the source of the image, i.e., whether it's a DVD image or a camera image.
Results and discussion
Mechanism of precipitation
GelRed is a bis intercalating dye and its chemical formula33 along with its hairpin structure (Fig. 1a) was recently reported.33 When GelRed comes into contact with DNA, it binds strongly to the DNA forming a complex that occupies 3.7 DNA base pairs and undergoes conformational changes leading to an increased contour length.20 The binding mechanism of GelRed with DNA has been suggested by observations using two different experimental techniques: single molecule stretching and dynamic light scattering.20 These observations confirmed that GelRed is a bis intercalator, which effectively means that the GelRed–DNA complex is asymmetric in nature, which is also well reported in several DNA intercalation studies.34–37 An asymmetrical DNA intercalated structure leads to two local dipoles at the site of intercalation,38 whereas non-intercalated DNA is otherwise symmetric. At higher concentrations of DNA, the GelRed–DNA complex forms mini “flake”-like aggregates first. The flake formation appears presumably due to the fact that a large number of DNA-intercalated molecular dipoles, in close proximity in solution, attract each other with weak van der Waals forces (London forces).39 We observed the formation of these DNA–GelRed flakes under the microscope, which are stable in solution (Fig. 1b). Upon centrifugation, the flakes whose local dipoles are not neutralized completely but are only stable because of large intermolecular distances start to aggregate and are visible to the naked eye. As the flakes come closer due to centrifugation, this leads to the formation of a precipitate that is visible to the naked eye. Movie S1† shows the formation of the precipitate from the mini flake-like aggregates. The process of precipitation formation is shown in real time, and it takes about 30 seconds for the entire precipitation to take place in a disc with embedded U-shaped microfluidic channels.Detection of the precipitate and quantification
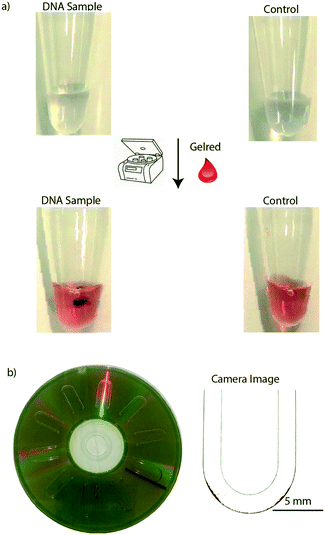
To test the precipitate based DNA detection on an Eppendorf tube, we carried out a LAMP assay in Eppendorf tubes, and when diluted GelRed was added, followed by centrifugation for approximately 30 seconds, a visible precipitate was formed in the tube, whereas no precipitate was formed in the control tube (Fig. 2a). As a control, GelRed itself produced no detectable precipitate with water or any amplification buffer mix, as well as the un-amplified control DNA sample. As can be seen in Fig. 2a, centrifugation assisted precipitation is suitable for detecting the presence of DNA in a sample by the naked eye and may find broad applications in low-cost and rapid visual detection of pathogen nucleic acids in infection management. However, for DNA quantification miniaturization using microfluidics has the potential to increase the sensitivity. Towards this, centrifugal microfluidics or lab-on-a-disc (LOD)40–43 platform is ideally suited since they only use centrifugal forces for driving and manipulating samples and reagents. Moreover, for accurate quantification of the DNA from images, a planar microfluidic disc leads to a better spread of the precipitate over a larger area, leading to better resolution in imaging based quantification. In this work, we used U-shaped microchannels for image based quantification of the precipitate formation in the LOD platform (Fig. 2b).The images of the precipitate on the disc were captured with a CMOS camera for further analysis. The original image (Fig. 3a) generated from the CMOS camera was adjusted to a highly contrasted image (Fig. 3b), followed by transformation into a binary image (Fig. 3c). The left of the threshold value, shown by the blue central line in the image histogram (Fig. 3d), marked the volume of the precipitate, i.e. the precipitation level. The threshold value, as described earlier, was chosen as the value at which the highest pixel counts for the lowest gray levels in the adjusted image histogram of the image were found. Fig. 3e shows an analysis of DNA entanglement with GelRed for two different DNA concentrations (65 ng μl−1 and 129 ng μl−1). These samples have apparently similar looking areas of precipitate but different quantities of DNA. Hence, the code takes DNA entanglement (based on the concentration) with GelRed into account in the quantification process, as the pixel counts for the higher concentration of DNA are significantly higher. Even though the binary image captures the entire amount of precipitate seen in the adjusted image, in some cases trace quantities of DNA are left out in the binary images especially at higher concentrations of DNA. To account for this trace value of DNA, a tolerance value of +20 is added to the adaptive threshold value. For example, at a gray level of 16 in both the images of Fig. 3e, two small peaks can be seen which are insignificant but still accounted for in the image analysis for more accuracy. The total volume of the precipitate, the precipitation level, is further correlated with the DNA quantity in the sample.
Calibration for quantification with CMOS sensor images
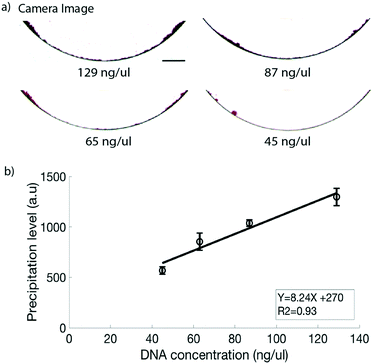
For DNA quantification, a known amount of a purified PCR product was used. Fig. 4a shows the images obtained at different measured concentrations of DNA for the CMOS sensor with the lower right quadrant image (45 ng μl−1) being the lowest detectable concentration. The calibration curve yielded a linear straight line (Fig. 4b) with a coefficient of determination R2 = 0.93 for the CMOS sensor generated images. In the line equation for the generated straight line as shown in Fig. 4b, Y is the precipitation level and X is the measured amount of DNA with the Nanodrop spectrophotometer. The precipitation level in the image is generated based on a difference in the gray level value of the precipitate vs. the edges of the microfluidic channel. However, as the concentration of DNA decreases, the DNA precipitate becomes weaker, i.e. having a higher gray level value. Thus as the amount of DNA is lowered, a point is reached where even though the precipitate can be seen in the image, the gray level values of the precipitate and those of the microfluidic channel edges lie in an overlapping gray level range. We observed that the precipitation is detectable up to a concentration of 32 ng μl−1 in the CMOS sensor generated images; however, the channel edge interference effect restricts the detection limit to 45 ng μl−1. The edge interference effect should be applicable for a wide range of optical imaging systems where the CMOS sensor is used, including nearly all commercially available smartphones and portable digital cameras. One way to increase the sensitivity is to optimize the channel geometry to prevent or reduce the edge interference. In order to achieve a better detection limit as well as to have an integrated all-in-one setup using the current channel geometry, we evaluated the potential of the lab on DVD platform we recently developed,27,30 which works on laser scanning imaging, for DNA quantification.Lab on DVD platform for DNA quantification
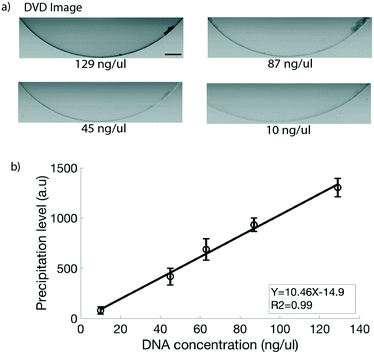
The lab on DVD platform integrates centrifugal microfluidics with the possibility to take high resolution images.30 The system is different from conventional CMOS sensor based imaging systems, as the images are generated by laser scanning and achieves a sub-micron imaging resolution. Further, the platform enables uniform imaging conditions in a closed setup. To calibrate the image-based precipitate quantification, the measured DNA products were loaded on the U-shaped chambers of the DVD discs and imaged. The DVD images were processed with the image processing code to generate a precipitation level value for each concentration of DNA. Fig. 5a shows the images obtained at different concentrations of DNA. Fig. 5b shows the precipitation level plotted against the known DNA concentrations for the DVD generated images. Two distinguished improvements can be observed compared to the CMOS sensor. First, a detection limit of 10 ng μl−1 was obtained for the DVD platform which was a significant improvement from the CMOS sensor which had a limit of detection of 45 ng μl−1. Second, the calibration curve for the DVD platform yielded a straight line with a higher coefficient of determination (R2 = 0.99) for the DVD generated images. Since the laser generates a much larger amount of information compared to the conventional CMOS sensor, this leads to capture of more intricate details in the image. Also, the edge interference effect as in the CMOS sensor images is not observed as the gray level values of the microfluidic channel edges in the DVD images lie in a very defined and narrow range, and do not overlap with those of the precipitate till the detectable concentration limits. The sub-micron resolution offered by the DVD is primarily responsible for the improved sensitivity and better correlation values for the DVD images. It might be possible to increase the limit of detection even further by changing the channel design and in particular the height of the microfluidic structures which is currently 150 μm. The sensitivity as well as portability makes the DVD platform attractive for imaging based DNA quantification.Lab on DVD based quantification of amplified DNA
To evaluate the μCAP method on the DVD platform for direct quantification of an amplified sample (that is not purified from its amplification buffer), we carried out a LAMP assay on HIV-1B genome containing plasmid DNA. The LAMP product was imaged using the DVD platform and the DVD images were analysed and converted to an actual yield of DNA products for each of the concentrations using the conversion from the linear equation generated from the calibration curve in Fig. 5b. As can be seen in Fig. 6, the lowest detectable starting DNA template concentration is 0.2 fg μl−1, which is as sensitive as gel electrophoresis.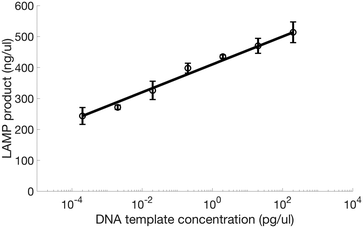 | ||
| Fig. 6 DNA template concentration versus the actual yield of amplified DNA produced due to the LAMP reaction where the actual yield was generated from the DNA calibration curve equation generated in Fig. 5b. | ||
It can be seen that the amplification in the LAMP assay is linear for every ten-fold increase in the starting concentrations of the DNA template. The error bars in the figure show the standard deviation for triplicate measurements for a particular starting template concentration. Given that the yield of amplified LAMP products fluctuates, the error range shown in the final DNA products is acceptable for the LAMP assay in a microfluidic format.
The amplified LAMP product images generated using the modified DVD system were also compared with gel electrophoresis results (section S3, Fig. S2†). This was performed by extracting 5 μl from the U-shaped chambers on the DVD and inserting them in gel electrophoresis columns. The gel electrophoresis results indicated the presence of DNA up to a starting template DNA concentration of 0.2 fg μl−1. This corresponds well to the precipitation based detection in the DVD generated images (section S4, Fig. S3†).
The μCAP method has the potential to be used as a point-of-care test since it only involves loading of the sample along with GelRed (in one-step) providing rapid quantitative results. The sensitive quantification is attributed to the fact that the amplification mix, the template DNA, or the polymerase, did not form precipitates. Hence, this low cost and simple method does not require purification or labelling other than addition of GelRed and centrifugation. The combined heating capabilities of the lab on DVD platform will serve as a smart fluidic handling system on disc, which has the potential to provide sample in and result out on-disc amplified DNA quantification.
Conclusion
We demonstrate a visual DNA quantification method, which we term as microfluidic centrifugation assisted precipitation (μCAP). It is based on DNA precipitation upon mixing with GelRed followed by centrifugation. We demonstrated the μCAP method for DNA quantification to two centrifugal microfluidic systems: a CMOS camera coupled with a centrifugal microfluidic setup and an integrated modified DVD drive. The detection limit reported by the lab on DVD platform was found to be comparable to those of commercially available DNA quantification instruments. As a proof of principle, the integrated lab-on-DVD platform was applied for quantification of LAMP assay products of HIV-1B genome containing plasmid DNA. The μCAP method has a distinct advantage over other state of the art techniques, as it does not require further purification of the DNA, and is extremely rapid. Combined with the lab on DVD platform, the novel method will be useful to fill the current unmet need for one step point of care DNA quantification.Author contribution
IB and AR are responsible for the conceptualization of the idea. IB conducted the data curation and formal analysis. AR and AS are responsible for the funding acquisition. IB, SGA NL and WZ are responsible for the investigation, specifically performing the experiments, or data/evidence collection. IB, SGA and NL developed the methodology. AR is responsible for the project administration. AR, UN and AS are responsible for the resources. IB is responsible for the software. AR is responsible for the supervision. IB, SGA and WZ are responsible for the validation. IB is responsible for the visualization, i.e., preparation, creation and/or presentation of the published work, specifically visualization/data presentation. IB wrote the original draft. IB, SGA, NL, WZ, AK and UN and AR are responsible for the review and editing. All authors have read and approved the manuscript.Conflicts of interest
There are no conflicts to declare.Acknowledgements
The authors would like to acknowledge KTH-SLL as the source of funding for this project.References
- H. Heesterbeek, R. M. Anderson, V. Andreasen, S. Bansal, D. De Angelis, C. Dye, K. T. Eames, W. J. Edmunds, S. D. Frost and S. Funk, Science, 2015, 347, aaa4339 CrossRef PubMed.
- A. M. Foudeh, T. F. Didar, T. Veres and M. Tabrizian, Lab Chip, 2012, 12, 3249–3266 RSC.
- I. Banerjee, T. Salih, H. Ramachandraiah, J. Erlandsson, T. Pettersson, A. C. Araújo, M. Karlsson and A. Russom, RSC Adv., 2017, 7, 35048–35054 RSC.
- S. C. Morpeth, M. Deloria Knoll, J. A. G. Scott, D. E. Park, N. L. Watson, H. C. Baggett, W. A. Brooks, D. R. Feikin, L. L. Hammitt and S. R. Howie, Clin. Infect. Dis., 2017, 64, S347–S356 CrossRef CAS PubMed.
- C. M. León, M. Muñoz, C. Hernández, M. S. Ayala, C. Flórez, A. Teherán, J. R. Cubides and J. D. Ramírez, Front. Microbiol., 2017, 8, 1907 CrossRef PubMed.
- B. H. Park, S. J. Oh, J. H. Jung, G. Choi, J. H. Seo, E. Y. Lee and T. S. Seo, Biosens. Bioelectron., 2017, 91, 334–340 CrossRef CAS PubMed.
- M. Goto, E. Honda, A. Ogura, A. Nomoto and K.-I. Hanaki, BioTechniques, 2009, 46, 167–172 CrossRef CAS PubMed.
- J. Xu, J. Guo, S. W. Maina, Y. Yang, Y. Hu, X. Li, J. Qiu and Z. Xin, Anal. Biochem., 2018, 549, 136–142 CrossRef CAS PubMed.
- J.-M. Zingg and S. Daunert, Methods Protoc., 2018, 1, 15 CrossRef.
- Z. Crannell, A. Castellanos-Gonzalez, G. Nair, R. Mejia, A. C. White and R. Richards-Kortum, Anal. Chem., 2016, 88, 1610–1616 CrossRef CAS PubMed.
- O. Faye, O. Faye, B. Soropogui, P. Patel, W. A. A. El, C. Loucoubar, G. Fall, D. Kiory, N. F. Magassouba, S. Keita and M. K. Konde, Euro Surveill., 2015, 20(44), 30053 CrossRef PubMed.
- M. R. Williams, R. D. Stedtfeld, H. Waseem, T. Stedtfeld, B. Upham, W. Khalife, B. Etchebarne, M. Hughes, J. M. Tiedje and S. A. Hashsham, Anal. Methods, 2017, 9, 1229–1241 RSC.
- A. M. Haines, S. S. Tobe and A. Linacre, BioTechniques, 2016, 61, 183–189 CrossRef CAS PubMed.
- Y. Nakayama, H. Yamaguchi, N. Einaga and M. Esumi, PLoS One, 2016, 11, e0150528 CrossRef PubMed.
- M. Simbolo, M. Gottardi, V. Corbo, M. Fassan, A. Mafficini, G. Malpeli, R. T. Lawlor and A. Scarpa, PLoS One, 2013, 8, e62692 CrossRef CAS PubMed.
- H. Goldshtein, M. J. Hausmann and A. Douvdevani, Ann. Clin. Biochem., 2009, 46, 488–494 CrossRef CAS PubMed.
- S. Sah, L. Chen, J. Houghton, J. Kemppainen, A. C. Marko, R. Zeigler and G. J. Latham, Genome Med., 2013, 5, 77 CrossRef PubMed.
- F. Guo and T. Zhang, Appl. Microbiol. Biotechnol., 2013, 97, 4607–4616 CrossRef CAS PubMed.
- A. M. Haines, S. S. Tobe, H. J. Kobus and A. Linacre, Electrophoresis, 2015, 36, 941–944 CrossRef CAS PubMed.
- F. A. P. Crisafuli, E. B. Ramos and M. S. Rocha, Eur. Biophys. J., 2015, 44, 1–7 CrossRef CAS PubMed.
- M. Liu, H. Zhao, S. Chen, H. Yu, Y. Zhang and X. Quan, Chem. Commun., 2011, 47, 7749–7751 RSC.
- V. Luzzati, F. Masson and L. S. Lerman, J. Mol. Biol., 1961, 3, 634–639 CrossRef CAS.
- C. J. Murphy, M. R. Arkin, Y. Jenkins, N. D. Ghatlia, S. H. Bossmann, N. J. Turro and J. K. Barton, Science, 1993, 262, 1025–1029 CrossRef CAS.
- J. N. Lisgarten, M. Coll, J. Portugal, C. W. Wright and J. Aymami, Nat. Struct. Mol. Biol., 2002, 9, 57 CrossRef PubMed.
- C. A. Hunter and J. K. M. Sanders, J. Am. Chem. Soc., 1990, 112, 5525–5534 CrossRef CAS.
- H. Ramachandraiah, M. Amasia, J. Cole, P. Sheard, S. Pickhaver, C. Walker, V. Wirta, P. Lexow, R. Lione and A. Russom, Lab Chip, 2013, 13, 1578–1585 RSC.
- I. Banerjee and A. Russom, in Frugal Innovation in Bioengineering for the Detection of Infectious Diseases, Springer, 2018, pp. 23–38 Search PubMed.
- L. A. Tortajada-Genaro, S. Santiago-Felipe, M. Amasia, A. Russom and Á. Maquieira, RSC Adv., 2015, 5, 29987–29995 RSC.
- S. Hugo, K. Land, M. Madou and H. Kido, S. Afr. J. Sci., 2014, 110, 1–7 CrossRef.
- H. Ramachandraiah, M. Amasia, J. Cole, P. Sheard, S. Pickhaver, C. Walker, V. Wirta, P. Lexow, R. Lione and A. Russom, Lab Chip, 2013, 13, 1578–1585 RSC.
- S. Grossmann, P. Nowak and U. Neogi, J. Int. AIDS Soc., 2015, 18, 20035 CrossRef PubMed.
- K. A. Curtis, D. L. Rudolph, I. Nejad, J. Singleton, A. Beddoe, B. Weigl, P. LaBarre and S. M. Owen, PLoS One, 2012, 7, e31432 CrossRef CAS PubMed.
- Y.-Y. Hao, L. Liu, L.-H. Zhang, Q.-L. Huang, F. Wang, J. Li, J.-Q. Xu and L.-H. Wang, Nucl. Sci. Tech., 2018, 29, 138 CrossRef.
- S. Nafisi, A. A. Saboury, N. Keramat, J.-F. Neault and H.-A. Tajmir-Riahi, J. Mol. Struct., 2007, 827, 35–43 CrossRef CAS.
- M. Waring, J. Mol. Biol., 1970, 54, 247–279 CrossRef CAS PubMed.
- H. S. Rye, S. Yue, D. E. Wemmer, M. A. Quesada, R. P. Haugland, R. A. Mathies and A. N. Glazer, Nucleic Acids Res., 1992, 20, 2803–2812 CrossRef CAS PubMed.
- L. S. Lerman, Proc. Natl. Acad. Sci. U. S. A., 1963, 49, 94–102 CrossRef CAS.
- C. Medhi, J. B. O. Mitchell, S. L. Price and A. B. Tabor, Biopolymers, 1999, 52, 84–93 CrossRef CAS PubMed.
- J. N. Israelachvili, Intermolecular and surface forces, Academic press, 2011 Search PubMed.
- R. Gorkin, J. Park, J. Siegrist, M. Amasia, B. Seok Lee, J.-M. Park, J. Kim, H. Kim, M. Madou and Y.-K. Cho, Lab Chip, 2010, 10, 1758–1773 RSC.
- J. Ducrée, S. Haeberle, S. Lutz, S. Pausch, F. Von Stetten and R. Zengerle, J. Micromech. Microeng., 2007, 17, S103 CrossRef.
- M. Amasia and M. Madou, Bioanalysis, 2010, 2, 1701–1710 CrossRef CAS PubMed.
- J. Siegrist, R. Gorkin, M. Bastien, G. Stewart, R. Peytavi, H. Kido, M. Bergeron and M. Madou, Lab Chip, 2010, 10, 363–371 RSC.
Footnote |
| † Electronic supplementary information (ESI) available. See DOI: 10.1039/c9lc00196d |
| This journal is © The Royal Society of Chemistry 2019 |

