 Open Access Article
Two-dimensional melting of colloids with long-range attractive interactions
Di
Du
a,
Manolis
Doxastakis
 b,
Elaa
Hilou
a and
Sibani Lisa
Biswal
 *a
*a
aDepartment of Chemical and Biomolecular Engineering, Rice University, 6100 Main St. MS-362, Houston, TX 77005, USA. E-mail: biswal@rice.edu; Tel: +1 713-348-6055
bDepartment of Chemical and Biomolecular Engineering, University of Tennessee, Knoxville, Tennessee 37996, USA
First published on 3rd January 2017
Abstract
The solid–liquid melting transition in a two-dimensional (2-D) attractive colloidal system is visualized using superparamagnetic colloids that interact through a long-range isotropic attractive interaction potential, which is induced using a high-frequency rotating magnetic field. Various experiments, supported by Monte Carlo simulations, are carried out over a range of interaction potentials and densities to determine structure factors, Lindermann parameters, and translational and orientational order parameters. The system shows a first-order solid–liquid melting transition. Simulations and experiments suggest that dislocations and disclinations simultaneously unbind during melting. This is in direct contrast with reports of 2-D melting of paramagnetic particles that interact with a repulsive interaction potential.
Introduction
The two-dimensional (2-D) solid–liquid phase transition plays an important role in laterally confined systems, from epitaxial thin films1 to membrane bound proteins.2 The nature of melting transitions in 2-D systems has long been an interest since they do not form long-range crystalline order. However, a phase characterized by long-range orientational and quasi-long-range translational order, with a power-law decay of the translational correlation, is considered to be a 2-D solid. There are two possible scenarios that describe melting of a 2-D solid. The more commonly reported is a two-step topological melting, supported by Kosterlitz–Thouless–Halperin–Nelson–Young (KTHNY) theory. First, a crystal melts into an intermediate hexatic phase, which has a quasi-long-range orientational order but lacks the long-range transitional order, via dislocation unbinding. Then, the hexatic phase melts into an isotropic liquid phase via disclination unbinding.3–6 KTHNY theory states that the two distinct steps of melting are both continuous, which has been experimentally observed in a paramagnetic particle system with soft dipolar repulsion,7 although first-order liquid-hexatic transitions are also possible depending on the range of the repulsive interaction.8 2-D melting in a particle system dictated by short-range attractive depletion interactions has also reported a two-step, first-order transition based on experiments and simulations.9,10 The second possible scenario is a one-step transition from a 2-D solid to an isotropic liquid. Simulations of hard disks show a one-step continuous melting transition,11 while simulations of a particle system with long-range attractive interactions using a Lennard-Jones potential show a single-step first-order melting transition.12 However few experimental systems illustrating melting with long-range attractive interactions have been reported. Here, we present experimental visualization and simulation of the melting dynamics of a 2-D colloidal system with an isotropic, long-range, attractive interaction to determine which melting scenario applies to this system.Colloidal systems have long served as model systems for visualizing phase behaviors.13 The large particle size and slow relaxation characteristics of colloidal systems enable measurements that are otherwise prohibitively difficult to perform in atomic systems.14 Moreover, the physical properties of colloids, such as density,15 surface charge16 and paramagnetism,7,17 can be precisely tuned, which enables the design of systems that exhibit different variations in interaction potential and leads to models that capture different phase behaviors under different external conditions.9,18–20 Recently, it has been shown that suspended paramagnetic particles under a rotating magnetic field (PURM) can be used to generate a long-range tunable interaction potential between colloids that decays as r−3, characteristic of a Lennard-Jones potential.21–24 The precise calculation of the interaction potential allows us to readily simulate the PURM system using molecular simulations.25 Thus, the phase behavior of the PURM system can be experimentally probed and simulated with Monte Carlo simulations.
Materials and methods
Sample fabrication
The suspension consists of carboxyl-coated superparamagnetic polystyrene particles (Dynabeads M-270) with a particle radius a = 1.4 μm and an effective volumetric susceptibility χeff = 0.96. The carboxylic acid coating yields a net negative charge on the particle surface, where a zeta potential of −50 mV was measured in 0.1 mM NaCl solution,21 which suffices to dynamically stabilize the particle system. A 2-D sample cell was made by sandwiching two coverslips with optical adhesive NOA 81 (Norland Optical Adhesives) at the corners. The separation between the coverslips was controlled by dispersing non-magnetic polystyrene spacer particles (Spherotech) with radius 10 μm into the adhesive before curing with UV light. The coverslips were pretreated using an ethanol rinse, oxygen plasma (30 seconds) and KOH (pH = 14) wash to prevent nonspecific binding of particles to the coverslip surfaces. The particle suspension was injected into the thin gap between the coverslips, and the sample cell was completely sealed with epoxy (Hardman). The sample cell contains approximately 40 million particles. The initial density, which is defined as the ratio of the area the particles occupy to the total area, is 0.2 for gas–liquid equilibrium and 0.6 for solid–liquid equilibrium. The sample cell was placed in a custom-built optical imaging system using a 100×, N.A. 1.4 objective lens (Olympus).21 The samples were held for 12 hours to allow the particles to reach an equilibrated state before any experiment measurement was made.Magnetic and imaging setup
Two pairs of air-core solenoids were arranged perpendicular to each other. The applied magnetic field can be expressed as H0 = (H0![[thin space (1/6-em)]](https://www.rsc.org/images/entities/char_2009.gif) cos(2πft), H0
cos(2πft), H0![[thin space (1/6-em)]](https://www.rsc.org/images/entities/char_2009.gif) sin(2πft)), where H0 is applied magnetic field strength, f is frequency and t is elapsed time. Two multi-frequency power supplies, which are connected to the two coil pairs (Agilent N6784A), were programmed with 20 Hz orthogonal sinusoidal functions to generate a rotating magnetic field. The field strength was changed in the experiment from 1 Gauss to 4 Gauss to change the effective interaction potential. The instantaneous field was monitored using a digital oscilloscope, which is embedded in the main frame of the power supply. The dynamics of the colloidal particles are monitored with a CCD camera (QImaging) at a rate of 10–16 frames per s using Simple PCI (Hamamatsu). The image files were processed using MATLAB to obtain x and y coordinates of spheres.21 A surface level was used to verify that the sample stage does not have any tilt from the solenoid plane to ensure that the measured projection of the trajectory represents the actual position. The sample was kept at 298 K and no apparent temperature change (>1 K) was observed in the experiment. The images were taken at 1024 × 1024 pixels, which is the maximum resolution allowed by the CCD camera. For a captured image, typically about 1300 particles were resolved for the crystal phase.
sin(2πft)), where H0 is applied magnetic field strength, f is frequency and t is elapsed time. Two multi-frequency power supplies, which are connected to the two coil pairs (Agilent N6784A), were programmed with 20 Hz orthogonal sinusoidal functions to generate a rotating magnetic field. The field strength was changed in the experiment from 1 Gauss to 4 Gauss to change the effective interaction potential. The instantaneous field was monitored using a digital oscilloscope, which is embedded in the main frame of the power supply. The dynamics of the colloidal particles are monitored with a CCD camera (QImaging) at a rate of 10–16 frames per s using Simple PCI (Hamamatsu). The image files were processed using MATLAB to obtain x and y coordinates of spheres.21 A surface level was used to verify that the sample stage does not have any tilt from the solenoid plane to ensure that the measured projection of the trajectory represents the actual position. The sample was kept at 298 K and no apparent temperature change (>1 K) was observed in the experiment. The images were taken at 1024 × 1024 pixels, which is the maximum resolution allowed by the CCD camera. For a captured image, typically about 1300 particles were resolved for the crystal phase.
Interaction potential and melting
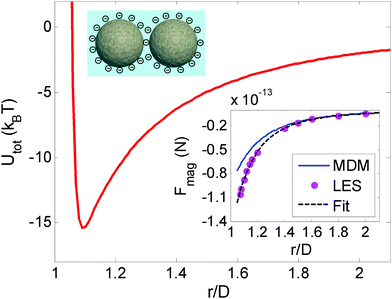
The potential among the paramagnetic particles is composed of a long-range attractive interaction and a short-range repulsive interaction. The attractive interaction originates from the interaction among magnetized bodies in an applied magnetic field. When the magnetic field rotates with a frequency greater than a critical frequency, the magnetic force is independent of the field orientation and can be calculated by taking a temporal average over a period. The critical frequency depends on the applied magnetic field strength but is below 20 Hz for the magnetic field strengths considered here. The magnetic interaction can be reasonably considered as isotropic when the frequency is set to 20 Hz.21 The repulsive component involves the electrostatic forces among the surface charges and thus can be described using Derjaguin–Landau–Verwey–Overbeek (DLVO) theory:26Uele(r) = (64πkTaρ∞γ2/κ)e−κ(r−2a), where a is the radius of the particles, ρ∞ is the number density of ions in the bulk solution, κ is the reciprocal of the Debye length, r is the center-to-center distance between the two particles, kB is the Boltzmann constant, T is the temperature, and γ = tanh(zeψ0/4kBT) is the reduced surface potential, in which ψ0 is the zeta potential and e is a unit charge. Fig. 1 illustrates the net interaction potential between two isolated particles of the PURM system. At small distances, the interactions among the particles are dominated by electrostatic repulsion, whereas at large distances, the interactions are dominated by magnetic attraction. The crossover between the two regions forms an attractive well, which is quite similar to the long-range Lennard-Jones (L-J) interaction potential that is used to describe classical atomic systems.27 The Laplace equation solver method with the Maxwell stress tensor was used to calculate the force between two particles in a uniform magnetic field. The insert in Fig. 1 shows that the calculated pair interaction potential agrees very well with the experiment measurement using the inverse Boltzmann equation.21,28 The dependence of the attractive magnetic potential on the magnetic field strength is quadratic,25 and the dependence of the total interaction potential on the magnetic field strength is approximately quadratic. The total interaction potential well depth, ε, is used as a characteristic parameter to define various thermodynamic properties.Simulation methods
A Monte Carlo method was used to simulate the phase transition of the PURM system. To better track the density change at the transition, a grand canonical ensemble was used. Instead of directly using the chemical potential μ, the potential is normalized as , where μ′ is the normalized chemical potential,
  is the thermal de Broglie wavelength, h is Planck's constant, and m is the mass of the particle. Because the temperature is fixed in the ensemble, the de Broglie wavelength is constant; thus, the normalized chemical potential is a function of only the chemical potential. To be consistent with experiments, to trigger the phase transition at a fixed μ′, we tuned the interaction potential well depth ε instead of directly tuning the temperature T, which are essentially equivalent from the perspective of statistical mechanics. The temperature of the system was fixed at 298 K. We simulated the melting of cold crystals consisting of 2000 and 6000 particles on a triangular lattice to hot fluids by increasing the effective temperature kBT/ε. We subsequently simulated crystallization by reversing the effective temperature change for the system of 2000 particles.
Results and discussions
Experimental observation of 2-D melting
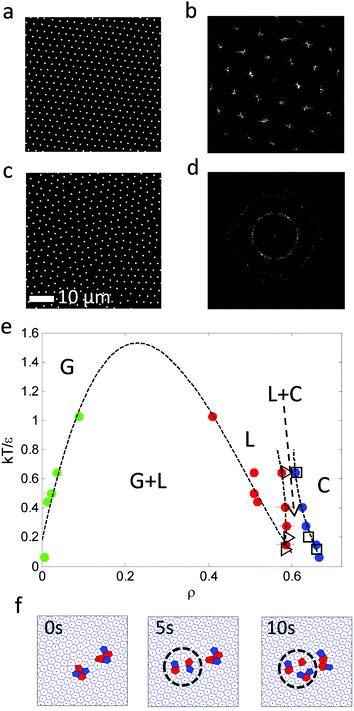
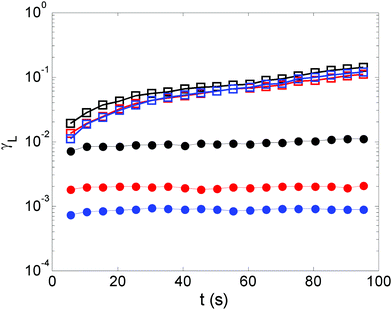
Various experiments were performed to visualize the melting dynamics of the system. Only two distinct phases were observed in experiments: a solid phase (Fig. 2(a)) and a dense liquid phase (Fig. 2(c)). Their structure factors are shown respectively in Fig. 2(b) and (d). The structure factor of the solid phase exhibits an apparent six-fold symmetry, whereas that of the liquid phase exhibits isotropy or infinite-fold symmetry. A phase diagram was constructed using the phase equilibrium data obtained from both simulation and experiment at different effective temperatures (Fig. 2(e)). Different phases were obtained by varying magnetic field strength and were identified by their density, structure factor and pair correlation function.21 This phase diagram is qualitatively very similar to the one obtained for typical long-range attraction system in 3-D.12,27 The consistency between the simulation and experiment results between the solid–liquid phases confirms that PURM exhibits the characteristics of long-range atomic systems. Both results show convergence to a supercritical point between the melting curve and the crystallization curve. The exact location of supercritical point was not determined since the two coexisting phases are hardly distinguishable near the supercritical point. The crystallization density weakly depends on the effective temperature. However, the melting density notably decreases when the effective temperature increases because increasing temperature or decreasing attractive potential well depth reduces the probability of forming a closed packed crystal phase. The one-step melting scenario is further illustrated by the visualization of simultaneous dislocation and disclination unbinding in the image sequence in Fig. 2(f). These two processes simultaneously occur near the interface between the equilibrated solid and liquid. The dislocation unbinding occurs during the first five seconds of the sequence and is characterized by the segmentation of a tetramer of particles whose nearest neighbors deviates from six. The disclination unbinding occurs during the last five seconds of the sequence and is characterized by emergence of isolated particles with a number of nearest neighbors that is not six. These processes do not occur for all dislocations and disclinations because the probability of the unbound dislocation is associated with the core energy of these defects.14,29 The simultaneous dislocation and disclination unbinding illustrates a lack of the hexatic phase in 2-D systems with long-range attractive interactions.10The initiation of melting is characterized by the divergence of the Lindemann parameter:
 | (1) |
Monte Carlo simulations of 2-D melting
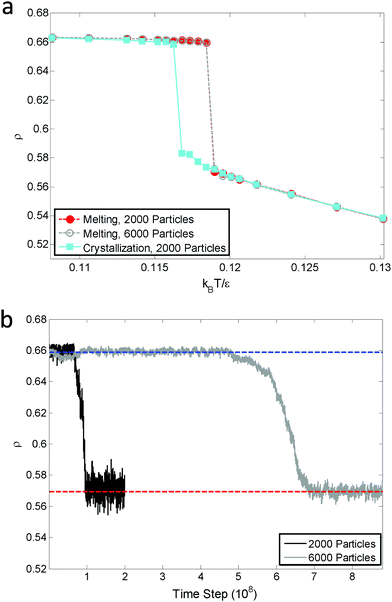
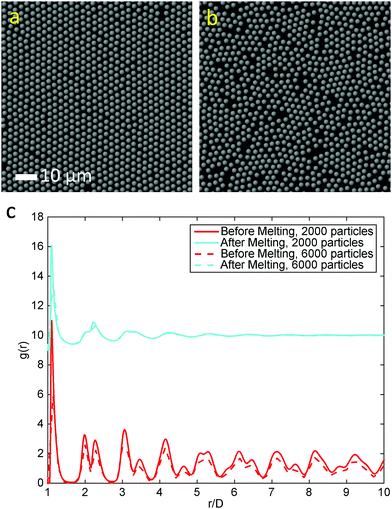
The melting curve and crystallization curve for μ′ = −15.0 are shown in Fig. 4(a). The low-pressure region is of particular interest because if an hexatic phase exists, it will likely emerge here.4,31 In this region, μ′ = −15.0 is sufficiently low, and further reducing μ′ would cause the system to transition into a vapor–solid equilibrium. The sharp melting and crystallization transitions indicate that the transitions are first order in nature. This is confirmed by the hysteresis that is formed by the melting curve and crystallization curve instead of two overlapping curves, which are characteristics of continuous phase transitions.31 The hysteresis also indicates the coexistence of the solid and liquid phases at a fixed effective temperature. Increasing the number of particles in the system does not change the first order nature of the melting transitions, as shown by the consistent melting curves for 2000 particles and 6000 particles. The absence of a hexatic phase is verified by the density variation at the melting point kBT/ε = 0119 (Fig. 4(b)). The density of the ensemble significantly and abruptly decreases from the higher density of a solid phase to the lower density of a liquid phase for both 2000 particles and 6000 particles. No noticeable plateau indicating a metastable phase is observed during this process.32Fig. 5(a) and (b) show the snapshots of the crystal and liquid right before and after transition. Apparent configurational change can be seen from these two snapshots. The pair distribution function,
 | (2) |
In addition, two order parameters are used to characterize the order of the transitions: the transitional order parameter ψT and the bond orientational order parameter ψ6. These parameters are calculated as follows:
 | (3) |
 | (4) |
![[thin space (1/6-em)]](https://www.rsc.org/images/entities/char_2009.gif) 〉 is the temporal average over different system snapshots. Voronoi construction is used to identify the nearest neighbors of each particle. A sharp decrease in an order parameter indicates the occurrence of a phase transition. Fig. 6(a) shows that both ψT and ψ6 undergo sharp transitions at kBT/ε = 0.119, which indicates that dislocation unbinding and disclination unbinding occurs simultaneously. Consistent results from 6000 particles are shown in Fig. 6(b). As a result, the melting transition is one-step and the hexatic phase described in KTHNY theory is not observed in the simulation. Note that a similar size effect is observed for the magnitude of the translational order parameter, which is also a function of particle distance.
〉 is the temporal average over different system snapshots. Voronoi construction is used to identify the nearest neighbors of each particle. A sharp decrease in an order parameter indicates the occurrence of a phase transition. Fig. 6(a) shows that both ψT and ψ6 undergo sharp transitions at kBT/ε = 0.119, which indicates that dislocation unbinding and disclination unbinding occurs simultaneously. Consistent results from 6000 particles are shown in Fig. 6(b). As a result, the melting transition is one-step and the hexatic phase described in KTHNY theory is not observed in the simulation. Note that a similar size effect is observed for the magnitude of the translational order parameter, which is also a function of particle distance.
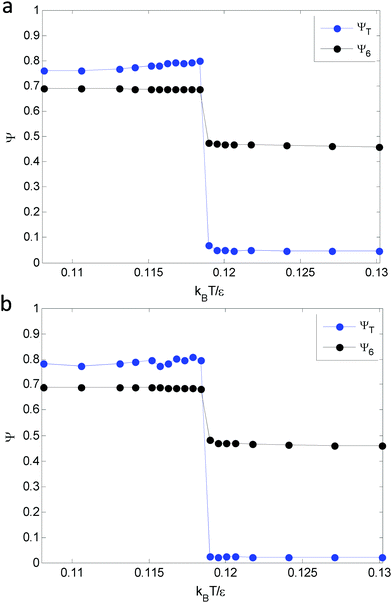 | ||
| Fig. 6 Translational order parameter (blue) and bond orientational order parameter (black) for (a) 2000 particles and (b) 6000 particles show good agreement. | ||
Conclusion
The melting transition of the 2-D colloidal system with a long-range attractive interaction was described using experiments and simulations. Different parameters were used to characterize the melting transition including density, translational order parameter and bond orientational order parameter. Our experiments and simulations show that this system exhibits a first-order transition instead of a two-step, second-order transition, the latter of which is supported by KTHNY theory and has been previously observed for paramagnetic colloids with soft repulsive potentials. The one-step solid–liquid melting transition is a result of long range Lennard-Jones-like attraction interaction, which synchronizes dislocation and disclination unbinding. The measured phase diagram of the system is very similar to that of a system with long-range attractive interactions in 3-D. The measurements performed for this colloidal system are difficult to replicate in sub-micron systems; however, the thermodynamics and dynamics of the melting transition investigated here can be extend to a variety of 2-D systems.Acknowledgements
We gratefully thank Peter Keim, Le Wang, Dichuan Li, Walter G. Chapman and Matteo Pasquali for insightful discussions. We acknowledge the National Science Foundation (CBET-0955003) and the Welch Foundation (C-1755) for financial support.References
- D. H. Lowndes, D. B. Geohegan, A. A. Puretzky, D. P. Norton and C. M. Rouleau, Science, 1996, 273, 898–903 CAS.
- K. Shon, Y. Kim, L. Colnago and S. Opella, Science, 1991, 252, 1303–1305 CAS.
- J. M. Kosterlitz and D. J. Thouless, J. Phys. C: Solid State Phys., 1973, 6, 1181–1203 CrossRef CAS.
- B. I. Halperin and D. R. Nelson, Phys. Rev. Lett., 1978, 41, 121–124 CrossRef CAS.
- D. R. Nelson and B. I. Halperin, Phys. Rev. B: Condens. Matter Mater. Phys., 1979, 19, 2457–2484 CrossRef CAS.
- A. P. Young, Phys. Rev. B: Condens. Matter Mater. Phys., 1979, 19, 1855–1866 CrossRef CAS.
- K. Zahn, R. Lenke and G. Maret, Phys. Rev. Lett., 1999, 82, 2721–2724 CrossRef CAS.
- S. C. Kapfer and W. Krauth, Phys. Rev. Lett., 2015, 114, 035702 CrossRef PubMed.
- A. H. Marcus and S. A. Rice, Phys. Rev. E: Stat. Phys., Plasmas, Fluids, Relat. Interdiscip. Top., 1997, 55, 637–656 CrossRef CAS.
- P. Bladon and D. Frenkel, Phys. Rev. Lett., 1995, 74, 2519–2522 CrossRef CAS PubMed.
- J. F. Fernández, J. J. Alonso and J. Stankiewicz, Phys. Rev. Lett., 1995, 75, 3477–3480 CrossRef PubMed.
- F. F. Abraham, S. W. Koch and W. E. Rudge, Phys. Rev. Lett., 1982, 49, 1830–1833 CrossRef CAS.
- J. B. Perrin, Nobel Lecture, 1926 Search PubMed.
- W. K. Qi, Z. R. Wang, Y. L. Han and Y. Chen, J. Chem. Phys., 2010, 133, 10 CrossRef PubMed.
- L. J. Bonales, J. E. F. Rubio, H. Ritacco, C. Vega, R. G. Rubio and F. Ortega, Langmuir, 2011, 27, 3391–3400 CrossRef CAS PubMed.
- J. C. Crocker and D. G. Grier, Phys. Rev. Lett., 1996, 77, 1897–1900 CrossRef CAS PubMed.
- J. Yan, S. C. Bae and S. Granick, Soft Matter, 2015, 11, 147–153 RSC.
- J. Gregory, Nature, 1989, 338, 182 CrossRef.
- N. Osterman, I. Poberaj, J. Dobnikar, D. Frenkel, P. Ziherl and D. Babic, Phys. Rev. Lett., 2009, 103, 4 CrossRef PubMed.
- N. Osterman, D. Babic, I. Poberaj, J. Dobnikar and P. Ziherl, Phys. Rev. Lett., 2007, 99, 4 CrossRef PubMed.
- D. Du, D. Li, M. Thakur and S. Biswal, Soft Matter, 2013, 9, 6867–6875 RSC.
- P. Tierno, R. Muruganathan and T. M. Fischer, Phys. Rev. Lett., 2007, 98, 028301 CrossRef PubMed.
- F. Martinez-Pedrero and P. Tierno, Phys. Rev. Appl., 2015, 3, 051003 CrossRef.
- J. Černák and G. Helgesen, Phys. Rev. E: Stat., Nonlinear, Soft Matter Phys., 2008, 78, 061401 CrossRef PubMed.
- D. Du, F. Toffoletto and S. L. Biswal, Phys. Rev. E: Stat., Nonlinear, Soft Matter Phys., 2014, 89, 043306 CrossRef PubMed.
- J. Israelachvili, Intermolecular and Surface Forces, Academic Press, San Diego, CA, 1992 Search PubMed.
- V. J. Anderson and H. N. W. Lekkerkerker, Nature, 2002, 416, 811–815 CrossRef CAS PubMed.
- W. N. Everett, H.-J. Wu, S. G. Anekal, H.-J. Sue and M. A. Bevan, Biophys. J., 2007, 92, 1005–1013 CrossRef CAS PubMed.
- K. J. Strandburg, Phys. Rev. B: Condens. Matter Mater. Phys., 1986, 34, 3536–3539 CrossRef.
- V. M. Bedanov, G. V. Gadiyak and Y. E. Lozovik, Phys. Lett. A, 1985, 109, 289–291 CrossRef.
- S. Prestipino, F. Saija and P. V. Giaquinta, Phys. Rev. Lett., 2011, 106, 4 CrossRef PubMed.
- K. Chen, T. Kaplan and M. Mostoller, Phys. Rev. Lett., 1995, 74, 4019–4022 CrossRef CAS PubMed.
| This journal is © The Royal Society of Chemistry 2017 |

