
 Open Access Article
 This Open Access Article is licensed under a
 Creative Commons Attribution 3.0 Unported Licence
Influence of particle size, cycling rate and temperature on the lithiation process of anatase TiO2†
H.
Liu
and
C. P.
Grey
*
Department of Chemistry, University of Cambridge, Lensfield Road, CB2 1EW, UK. E-mail: cpg27@cam.ac.uk
First published on 12th April 2016
Abstract
The nature of a phase transition plays an important role in controlling the kinetics of reaction of an electrode material in a lithium-ion battery. The actual phase transition path can be affected by particle size and cycling rate. In this study, we investigated the phase transition process during the electrochemical Li intercalation of anatase TiO2 as a function of particle size (25 nm and 100 nm), cycling rate (1C, 2C, 5C, 10C, 20C) and temperature (room temperature and 80 °C) by in situ synchrotron X-ray diffraction. The phase transition was found to be affected by the particle size: the 100 nm particles react simultaneously via a conventional nucleation and growth, i.e. two-phase, mechanism, while the 25 nm particles react sequentially via a two-phase mechanism. The Li miscibility gap decreases with increasing cycling rate, yet the phase separation was not suppressed even at a cycle rate of 20C. An increase in temperature from room temperature to 80 °C significantly improves the electrode's electrochemical performance despite undergoing a two-phase reaction. The failure to observe a continuous structural transition from tetragonal TiO2 to orthorhombic Li0.5TiO2 even at high rates and elevated temperature was attributed to the high energy barrier of a continuous phase transition path.
Introduction
Most commercial Li ion battery electrodes employ intercalation compounds, such as LiCoO2 and LiFePO4, where Li insertion and extraction can be reversibly extracted from and inserted into the host structure during battery charge and discharge, respectively. For intercalation compounds, (de)lithiation takes place either by a single-phase reaction, where the host structure forms a solid solution with Li within a certain Li composition range, or by a two-phase reaction, where a first-order phase transition is induced as Li is (de)intercalated. A single-phase reaction, which proceeds via a continuous structural change and avoids nucleation of a second phase, is generally considered to be important for fast reaction kinetics and is thought to be more favourable than a two-phase reaction for long-term capacity retention of the battery. Recent studies have identified a non-equilibrium single-phase transition mechanism in nano-particulate LiFePO4 (ref. 1 and 2) and LiNi1/2Mn3/2O4,3 electrode materials that are generally thought to transform via a two-phase mechanism at low cycling rates. The possibility that a two-phase material can transform via a single-phase mechanism under non-equilibrium conditions opens up new avenues for the search of new electrode compounds and begs the question as to how prevalent this phenomenon is in compounds that exhibit a thermodynamic Li miscibility gap (between two compounds with different Li stoichiometries). To complement previous studies, which have only explored compounds that do not involve a change in crystal symmetry between the two end member phases, this work investigates the phase transition of anatase TiO2, which transforms from tetragonal to orthorhombic symmetry upon Li intercalation.Anatase, TiO2, is used as an anode material for lithium ion batteries and, in theory, can accommodate a maximum of 1 Li per formula unit (f.u.). Initial Li intercalation into anatase TiO2 from z = 0 to 0.025 (z in LizTiO2) proceeds by a single-phase, solid solution reaction.4 When Li is further intercalated, there is a two-phase reaction in the composition range 0.025 < z < 0.5 (z in LizTiO2) between tetragonal Lia≈0.025TiO2 (I41/amd, no. 141, Fig. 1A),5 denoted as the α-TiO2 phase, and orthorhombic Lib≈0.5TiO2 (Imma, no. 74, Fig. 1B),6 denoted as the β-Li0.5TiO2 phase. Further intercalation for z > 0.5 is kinetically restricted by very slow Li ion diffusion,7,8 and as a result, transformation to LiTiO2 (I41/amd, Fig. 1C), denoted as γ-LiTiO2, is only observed for very small nanoparticles (∼7 nm) and on the surface layer of larger particles at room temperature.4 The thermodynamics of the system are also dependent on the particle size: for particles larger than 50 nm, both the α-TiO2 and β-Li0.5TiO2 phases can coexist in a single particle; for particles smaller than 50 nm, such phase coexistence is not stable, and for overall Li stoichiometries of 0.025 < z < 0.5 for the whole powder or electrode each individual crystallite is composed entirely of either the α-TiO2 or the β-Li0.5TiO2 phase.4 The effect of particle size on the reaction mechanism at a very low rate (C/120) was recently investigated by in situ XRD.9 It was found that both small (15 nm) and large (130 nm) particles react via the sequential reaction of particles, i.e., the so-called domino-cascade mechanism proposed originally for nanoparticles of LiFePO4.10 The same study, despite being carried out at a low rate, also reveals a non-equilibrium nature for the transition between α-TiO2 and β-Li0.5TiO2: the Li content of α-TiO2 and β-Li0.5TiO2 measured during the transition process of TiO2 → Li0.5TiO2 being different than the Li content measured under equilibrium at the same state of overall lithiation, the effect being more pronounced for the 15 nm particles. Hence, it would be interesting to explore whether the deviation from the equilibrium Li composition could be large enough at high rates to achieve a continuous (2nd-order) phase transition between α-TiO2 and β-Li0.5TiO2. To this end, the phase transition of anatase TiO2 during electrochemical cycling under different cycling rates and temperatures is investigated here by using in situ synchrotron XRD. By following the changes in the Bragg peaks of both α-TiO2 and β-Li0.5TiO2 phases during one discharge–charge cycle, we find the nature of the phase transition remains first order regardless of the cycling conditions tested here. Our study suggests the first-order phase transition is more energetically favourable than an overpotential-driven second-order phase transition.
 | ||
| Fig. 1 The crystal structures of (A) tetragonal α-TiO2, (B) orthorhombic β-Li0.5TiO2 and (C) tetragonal γ-LiTiO2. The half-filled green/white spheres correspond to sites that are randomly occupied by either a Li or a vacancy with equal probability. | ||
Experimental
Materials and electrode preparation
The 25 nm and 100 nm TiO2 powders were purchased from Sigma Aldrich. The electrode was prepared with a high proportion of carbon additives, to improve the electrochemical performance of the active material at high rates (by increasing the electronic conductivity). For a typical electrode, 3 mg of the active material powder was mixed with Super P carbon (Alfa Aesar), carbon black (Vulcan XC-72, Cabot Corporation) and polytetrafluoroethylene (PTFE) binder (Sigma-Aldrich) in the mass ratio 3![[thin space (1/6-em)]](https://www.rsc.org/images/entities/char_2009.gif) :3:3:1 and was pressed (1.6–1.8 ton) into a pellet of 13 mm in diameter.
:3:3:1 and was pressed (1.6–1.8 ton) into a pellet of 13 mm in diameter.
Laboratory XRD measurement
The as-purchased anatase TiO2 samples were measured at room temperature on a Panalytical Empyrean diffractometer using Cu Kα radiation. Whole powder pattern fitting was performed with TOPAS software. The peak profile was modelled by the isotropic size broadening. The Voigt peak shape (convolution of Lorentzian and Gaussian peak shape) is used to describe the isotropic size broadening, and 2θ dependence of the peak width is given by| Hiso = 0.9λ/(Lcos(θ)) | (1) |
In situ XRD measurement
The electrode pellet was assembled into the AMPIX cell11 with Li foil as the anode, glass fibre as the separator and 1 M LiPF6 in 1:1 ethylene carbonate/dimethyl carbonate (Tomiyama Pure Chemical Industries) as the liquid electrolyte. For high temperature electrochemical cycling, the cell was heated up with a heating tape whose temperature was set to 80 °C by a thermostat. In situ synchrotron XRD measurements were performed in transmission geometry at beamline 17-BM of the Advanced Photon Source at Argonne National Laboratory (wavelength 0.72779 Å, 500 μm diameter beam). An area detector (Perkin-Elmer) consisting of 2048 × 2048 pixels of 200 μm × 200 μm in size was used and was placed 400 mm away from the AMPIX cell. The same electrode was used for the in situ measurement at different cycling rates, with measurements taken in the order from low to high rate. The data collection time of each sequential pattern for 1C, 2C, 5C, 10C and 20C cycling rates was 30 s, 12 s, 6 s, 3 s, and 3 s, respectively, which corresponds to a change of 0.004 Li, 0.003 Li, 0.004 Li, 0.004 Li and 0.008 Li, respectively, per formula unit (f.u.) of TiO2 during the collection of each pattern. The C-rate is calculated based on the theoretical capacity of 0.5 Li insertion per f.u., which is 168 mA h g−1. LaB6 powder was measured to obtain the instrumental broadening profile.
Rietveld refinements were performed with TOPAS software package12 in the 2θ range 10.3–35.5°. The background was modelled by 4 asymmetrical pseudo-Voigt peaks at positions ∼11.7°, ∼20.1°, ∼25.0°, ∼34.8°, respectively, full width at half maximum (FWHM), intensity, shape parameter being refined, to account for the diffraction background intensity from glassy carbon, glass fibre separator and the liquid electrolyte, on top of the function B/2θ, where B was refined. Two phases corresponding to α-TiO2 (I41/amd) and β-Li0.5TiO2 (Imma) were included in the refinement. The scale factors, unit cell parameters, atomic coordinates and isotropic atomic displacement parameters (ADP) for Ti and O atoms were refined. Ti and O atoms in both phases were constrained to have the same ADP for each atomic species. The peak profile was modelled by the convolution of isotropic size broadening as described in eqn (1) with anisotropic strain-like broadening (both Lorentzian and Gaussain).
The 2θ dependence of the anisotropic strain-like broadening is described by
| Haniso = ΣijCijYijtan(θ) | (2) |
Results and discussion
Particle size and electrochemistry of anatase TiO2
The scanning electron microscope (SEM) images of the as-purchased TiO2 powder, specified as 100 nm and 25 nm, respectively, are shown in Fig. 2A and B. To confirm the particle size of the two samples, Pawley fitting against the XRD patterns of the as-purchase samples was performed to extract the particle size, and the results are shown in Fig. 2C and D for the 100 nm and the 25 nm samples, respectively. The refined average particle sizes (91 ± 13 nm and 24.8 ± 0.5 nm) are in good agreement (within errors) with the specification given by the supplier. (Analysis on the particle size distribution can be found in Fig. S1.†) Henceforward, the two TiO2 samples are referred to by the size specified by the supplier, i.e. 100 nm and 25 nm, respectively. | ||
| Fig. 2 SEM images obtained for (A) 100 nm and (B) 25 nm anatase TiO2 samples. Pawley fitting results against the XRD patterns of the (C) 100 nm and (D) 25 nm anatase TiO2 samples. | ||
In situ XRD measurements were conducted for both TiO2 samples at cycle rates of 1C, 2C and 5C at room temperature and at cycle rates of 5C, 10C and 20C at 80 °C. The same electrode comprised of 25 nm particles was used for both room temperature and 80 °C cycles, while two electrodes made with 100 nm particles were used for room temperature and 80 °C cycling. Cycles were carried out in the order of increasing rates at each temperature, for example, 1C, 2C and 5C cycles were carried out sequentially at room temperature. For 25 nm particles, cycling at 80 °C was performed after all the cycling at room temperature had been completed. Discharge and charge were limited to the voltage window 1.0–3.5 V, except for the room temperature 1C and 2C cycling of the 25 nm particles, where the low cut-off voltage was accidently set to 1.2 V. The voltage profiles obtained during the in situ XRD experiment are shown in Fig. 3. The x-axis corresponds to the total Li inserted or removed per f.u. of TiO2 and is calculated from the measured experimental capacity assuming 100% coulombic efficiency and is denoted by x; the Li composition of each phase is denoted by z.
 | ||
| Fig. 3 Voltage profiles for the discharge–charge cycles performed during the in situ XRD experiment. (A) Room temperature (RT) and (B) 80 °C cycling for 100 nm particles. (C) Room temperature and (D) 80 °C cycling for 25 nm particles. | ||
For 100 nm particles at 1C cycling at room temperature (Fig. 3A), the discharge voltage profile is consistent with previous report:14 a steep drop in voltage is followed by a voltage plateau at 1.7 V between x = 0.05 and 0.25, corresponding to the transition from α-TiO2 to β-Li0.5TiO2. The sloping voltage profile towards the end of discharge (from x = 0.3 to 0.45 Li) is tentatively attributed to an increased voltage polarisation due to the slow reaction kinetics associated with the transformation of the last fraction of α-TiO2 to β-Li0.5TiO2, and electrolyte decomposition at low voltages15,16 to form a protective layer of solid electrolyte interface (SEI). Further Li insertion exceeding Li0.5TiO2 has also been seen by some authors.17,18 Except for the irreversible SEI formation, the aforementioned process is reversed on charge. The small voltage bump seen on charge at x = 0.57 is associated with a kinetic barrier, such as nucleation of a second phase or the slow Li diffusion in γ-LiTiO2, which may form as a surface layer. The voltage profiles under other cycling conditions exhibit similar behaviour.
Phase evolution of anatase TiO2 under various conditions
Image plots of the time-resolved in situ XRD patterns for the evolution of the (024) reflection of α-TiO2 and the (204) reflection of β-Li0.5TiO2 during high rate cycling at room temperature are shown in Fig. 4A–C for 100 nm particles and Fig. 4D–F for 25 nm particles. (024) and (204) are symmetry equivalent reflections in tetragonal α-TiO2, but not in orthorhombic β-Li0.5TiO2. If the transition from the tetragonal to the orthorhombic phase is continuous, one would expect to observe, in the in situ XRD patterns, the branching of the (024) reflection into two reflections, (204) and (024), and then the continuous shift of these reflections towards the 2θ values of the β-Li0.5TiO2 (204) and (024) reflections, respectively. For clarity, the (024) reflection of β-Li0.5TiO2, which appears at a lower 2θ angle but overlaps with other peaks, is not shown. On discharging the 100 nm particles at a cycle rate of 1C (Fig. 4A), the (024) reflection of α-TiO2 shifts to a lower 2θ angle (0–0.07 overall cycled Li per f.u.) at the beginning of discharge, indicating an increase in the Li content of α-TiO2via a single-phase reaction; further discharge shows a characteristic two-phase reaction, where the (204) reflection of β-Li0.5TiO2 grows at the expense of the (024) reflection of α-TiO2. On discharge, the (204) reflection of β-Li0.5TiO2 decreases in intensity and the (024) reflection of α-TiO2 is restored. A similar evolution of the (024) reflection of α-TiO2 is observed for the 100 nm particles at cycle rates of 2C and 5C, as shown in Fig. 4B and C, respectively; however, due to the limited extent of formation of β-Li0.5TiO2 on discharging at higher rates, the intensity of the (204) reflection of β-Li0.5TiO2 becomes very weak at 2C, as reflected by the single contour level corresponding to ∼9% maximum intensity of the image (Fig. 4B) seen for this reflection; it is barely visible at 5C, where the intensity of the β-Li0.5TiO2 (204) reflection is less than ∼9% (Fig. 4C). The diffraction patterns shown in Fig. 4D–F are qualitatively similar to those of the 100 nm particles and also display features of the two-phase reactions. The 25 nm particles show improved kinetics as indicated by the higher fraction of the β-Li0.5TiO2 formed and the higher discharge capacity at the end of discharge in comparison to the 100 nm particles at equivalent rate: for example, the discharge capacity of 25 nm particles at 5C corresponds to the insertion of 0.4 Li per f.u. as opposed to 0.2 Li for 100 nm particles at the same rate.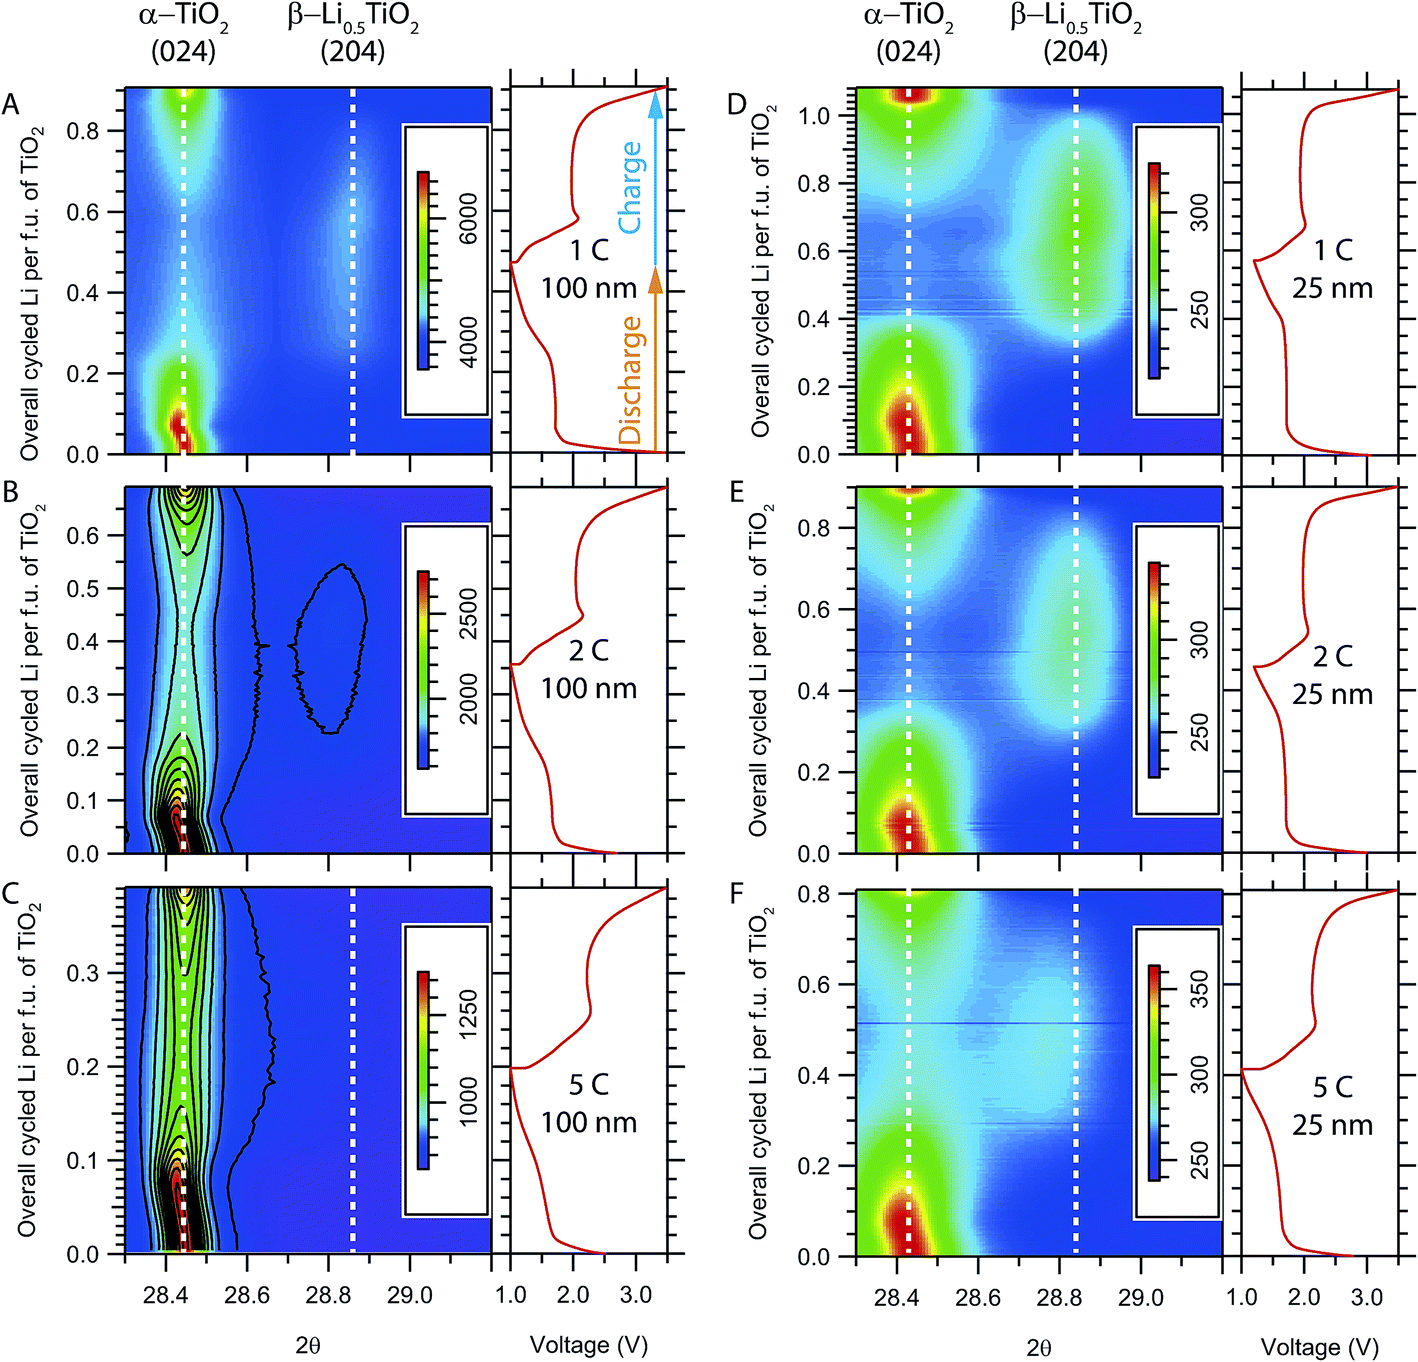 | ||
| Fig. 4 Image plots showing the time evolution of the in situ XRD patterns at room temperature for (A–C) 100 nm and (D–F) 25 nm TiO2 particles at various cycling rates. The intensity scale is shown by the colour bar. The electrochemical profile is shown in the graph to the right of each image. Only the 2θ region for the (024) reflection of α-TiO2 and the (204) reflection of β-Li0.5TiO2 is shown. The (204) reflection of β-Li0.5TiO2 is barely visible in B and C due to the formation of a very limited amount of β-Li0.5TiO2; the equally-spaced intensity contours (11 levels in total) are drawn in black in these figures to aid visual inspection. | ||
Since the (dis)charge process at room temperature terminates prematurely at higher rates (≥5C), to probe the phase transition at rates above 5C, electrochemical cycling was performed at an elevated temperature (∼80 °C) to improve the Li diffusion and the reaction kinetics; the corresponding in situ XRD patterns are shown in Fig. 5. While there is a noticeable improvement in the rate performance of both 100 nm and 25 nm particles with the formation of a substantial amount of β-Li0.5TiO2 at the end of the 20C discharge, the XRD patterns still exhibit characteristic two-phase behaviour for both particles sizes. Visual inspection of the in situ XRD patterns suggest the delithiation undergoes the same mechanism as lithiation, therefore, only the analysis and discussion of the lithiation process are presented in this article.
 | ||
| Fig. 5 Image plots showing the time evolution of the in situ XRD patterns collected at elevated temperature (∼80 °C) for (A–C) 100 nm and (D–F) 25 nm TiO2 particles at various cycling rates. The intensity scale is shown by the colour bar. The electrochemical profile is shown in the graph to the right of each image. The 2θ region for the (024) reflection of α-TiO2 and the (204) reflection of β-Li0.5TiO2 is shown. Equally spaced intensity contours (11 levels in total) are drawn in black in B, C and F to aid visual inspection. | ||
Evolution of lattice parameters and phase fractions
Rietveld refinements were carried out to follow the evolution of the α-TiO2 and β-Li0.5TiO2 lattice parameters and capture any quantitative differences in the phase transition between the various cycling conditions. Typical fitting patterns and Rwp factors can be found in Fig. S2 and S3,† respectively. The refined lattice parameters as a function of the overall Li composition determined from the electrochemistry during discharge are shown in Fig. 6. The evolution of the α-TiO2 lattice parameters exhibits two different regimes: (i) an initial steep increase (decrease) of the a(c) lattice parameter within the first ∼0.1 overall Li insertion, followed by (ii) a much gradual increase (decrease) of the a(c) lattice parameter until the end of discharge. Regime (i) is in line with the single-phase reaction within the limited Li solubility, where the insertion of Li only changes the Li composition of the α-TiO2 phase. Upon entering regime (ii), the β-TiO2 phase starts to form after the α-TiO2 phase becomes saturated with Li. | ||
| Fig. 6 Lattice parameters of both α-TiO2 (highlighted in yellow and labelled with the subscript α) and β-Li0.5TiO2 (highlighted in green and labelled with the subscript β) phases obtained from Rietveld refinements for both the room temperature (RT) and the 80 °C discharge processes. | ||
The Li composition of each phase can be interpolated under the assumption of Vegard's law; here, it is based on the interpolation of the c lattice parameter since it has been shown to vary linearly across the stoichiometries of α-TiO2, β-Li0.5TiO2, and γ-LiTiO2 (ref. 4) (Fig. S4†). The evolution of the Li composition of each phase during discharge is shown in Fig. 7, where the dashed grey lines indicate the thermodynamic Li solubility limits determined from neutron diffraction studies of 120 nm particles.4 The Li composition of the saturated α-TiO2 (see for example in Fig. 7A for the discharge processes of 100 nm at room temperature at the overall Li composition of ∼0.07) and that of the emerging β-Li0.5TiO2 phase (at the overall Li composition of ∼0.15) exceeds the thermodynamic Li solubility limit. Furthermore, as also shown in Fig. 7A, the Li composition of the saturated α-TiO2 phase (at the overall Li composition of 0.07–0.1) increases progressively with cycle rate: the maximum Li composition of the α-TiO2 phase before the formation of the β-TiO2 phase is found to be z = 0.042, 0.045, and 0.054 for 1C, 2C and 5C, respectively, where z is the Li composition of LizTiO2. This rate-dependent solubility is similar to what was observed2 and predicted19 for LiFePO4 at moderately high rates, and is attributed to the overpotential induced by the high current. In comparison, the same, yet less pronounced, rate-induced solubility is observed at higher temperature: for example, for the 100 nm particles cycled at 5C at 80 °C (Fig. 7B), the maximum Li composition of the α-TiO2 phase before the β-Li0.5TiO2 phase is formed is less than that at room temperature (Li0.035TiO2 is observed at an overall Li composition of ∼0.17 at 80 °C, whereas Li0.054TiO2 is seen at an overall Li composition of 0.1 in Fig. 7A). The Li composition of the emerging β-Li0.5TiO2 phase is also closer to the thermodynamic limit than that at room temperature. A similar observation is also made for the 25 nm particles at 80 °C in Fig. 7D. The Li composition of α-TiO2 increases even after the appearance of β-Li0.5TiO2, especially at the end of the voltage plateau. For example, in Fig. 7A the Li composition of α-TiO2 during 1C discharge increases substantially after inserting more than 0.2 Li per f.u., which coincides with the end of the voltage plateau. As more α-TiO2 is transformed to β-Li0.5TiO2, transformation of the residual α-TiO2 to β-Li0.5TiO2 becomes more difficult and requires a higher overpotential, which then allows more Li to be inserted in α-TiO2.
 | ||
| Fig. 7 Evolution of the Li composition in α-TiO2 and β-Li0.5TiO2 for (A and B) 100 nm and (C and D) 25 nm particles during discharge. Room temperature (RT) results are shown in A and B, and elevated temperature experiments are shown in B and D. The dashed grey lines indicate the positions for Li solubilities of 0.025 and 0.5, which are considered as the boundaries of the thermodynamic Li solubility.4 The error bars are smaller than the symbols. | ||
The less pronounced rate-induced Li solubility at the higher temperature reflects the kinetic nature of this phenomenon, which is associated with the finite Li diffusivity in the α-TiO2 and β-Li0.5TiO2 phases: a system not subject to kinetic limitations will always be found in its thermodynamic equilibrium state, and the Li composition of the α-TiO2 and β-Li0.5TiO2 phases will not exceed their thermodynamic solubilities if the Li diffusion, which has been found to be limited by the Li migration across the α-TiO2/β-Li0.5TiO2 interface,20 is infinitely fast. As the diffusion of Li becomes faster with increasing temperature, the Li solubilities of α-TiO2 and β-Li0.5TiO2 will approach their thermodynamic limits.
Microstructural evolution of anatase TiO2 particles during discharge
Although the in situ XRD patterns clearly show the presence of only two phases, it is not obvious as to what occurs on the particle level: does the reaction proceed particle by particle or simultaneously in all particles? To answer this question, microstructural analysis was performed based on the FWHM of the (024), (116) and (220) reflections of the α-TiO2 phase and the (011), (204) and (220) reflections of the β-Li0.5TiO2 phase. These reflections were selected because there is no or only a small amount of overlap with other reflections, in order to minimise ambiguity and correlation in the peak fitting process. The results from fitting individual reflections including the FWHM and the domain size calculated from Scherrer formula, and the phase fractions obtained from Rietveld refinements are presented and discussed below.100 nm TiO2 particles
The fitting results for 100 nm particles are shown in Fig. 8 and 9 for the discharge at room temperature and 80 °C, respectively. Typical fitting patterns can be found in Fig. S5.† For 100 nm particles cycled at a rate of 1C at room temperature (Fig. 8A(i)), the (024), (116) and (220) reflections of the α-TiO2 phase become broader as more Li is inserted. Meanwhile, as shown in Fig. 8A(ii), the (011) reflection of the β-Li0.5TiO2 phase decreases in FWHM, the (204) reflection remaining almost constant in FWHM and the (220) reflection showing an increase in FWHM for insertion of more than 0.25 overall Li composition. Since β-Li0.5TiO2 is the newly formed phase, its domain size will only increase (in the case of the two-phase reaction with phase separation inside individual particles) or remain constant (in the case of the particle by particle reaction) as lithiation proceeds, resulting in the narrowing or the invariance of the peak width, respectively. The non-monotonic change in the FWHM of the β-Li0.5TiO2 (220) reflection suggests that the dominant peak broadening mechanism is microstrain rather than domain size broadening. In fact, the FWHM observed at the beginning of lithiation for all the select α-TiO2 reflections is only 0.05° (2θ), yet the FWHM of the select β-Li0.5TiO2 reflections, with the exception of the (011) reflection during 5C discharge at 80 °C (Fig. 9A), are all larger than 0.1° (2θ). Hence, the β-Li0.5TiO2 reflections are substantially broadened by microstrain. Previous studies find an increase in the length of the zig–zag Ti–O–Ti chain along the b axis when Li is intercalated.5 This leads to 7% increase and 4% decrease in the b and c lattice parameters, respectively, but only a 0.5% increase in the a lattice parameter when α-TiO2 is transformed to β-Li0.5TiO2. Hence, the inter-planar spacings for lattice planes that are not parallel to the b–c plane are susceptible to large variations when the Li composition is not homogeneous, that lack of homogeneity being likely caused by slow Li diffusion in β-Li0.5TiO2.7 | ||
| Fig. 8 The evolution of the FWHM of select reflections from both α-TiO2 and β-Li0.5TiO2 (i and ii), the domain size determined from the FWHM of the (116) reflection for α-TiO2 and the (011) reflection for β-Li0.5TiO2 (iii), and scale factor (iv) as a function of the overall inserted Li for 100 nm particles during discharge at cycle rates of (A) 1C, (B) 2C and (C) 5C at room temperature. | ||
 | ||
| Fig. 9 The evolution of the FWHM of select reflections from both α-TiO2 and β-Li0.5TiO2 (i and ii), the domain size determined from FWHM of the (116) reflection for α-TiO2 and the (011) reflection for β-Li0.5TiO2 (iii), and scale factor (iv) as a function of the overall inserted Li for 100 nm particles during discharge at cycle rates of (A) 5C, (B) 10C and (C) 20C at 80 °C. | ||
If the broadening of all the select reflections is assumed to be due largely to the finite domain size effect, the domain size of each phase can be deduced using the Scherrer formula. Fig. 8A(iii) shows the evolution of the domain size deduced from FWHM of the (116) reflection of α-TiO2 and the (011) reflection of β-Li0.5TiO2. It is seen that the domain size of α-TiO2 decreases from 80 nm to 73 nm from an overall Li composition of 0 to 0.07. This slight initial apparent decrease of 7 nm in the domain size of α-TiO2 is again attributed to the microstrain induced by Li composition variation within the limited solid solution of α-TiO2, because α-TiO2 is the only phase present when the overall Li composition is between 0 and 0.07, i.e. there can be no size-induced broadening. Further Li insertion results in a drastic decrease in the domain size of α-TiO2 from 73 nm to 16 nm towards the end of lithiation, while the domain size of β-Li0.5TiO2 grows to 30 nm. The growth of the β-Li0.5TiO2 domain at the expense of the α-TiO2 one is expected for a two-phase reaction with the nucleation and growth of a second phase within the particles of the first phase. The fact that this process is captured by powder XRD, which measures a large number of crystallites at a time, indicates the two-phase reaction occurs simultaneously in all particles. Although the domain size of β-Li0.5TiO2 at the end of lithiation appears to be small, even though it constitutes 70% of the total phase fraction (Fig. 8A(iv)), the small domain size (30 nm) of β-Li0.5TiO2 could be the result of more than one α-TiO2/β-Li0.5TiO2 interface per particle20 and/or a concurrent microstrain broadening due to the Li composition variation of β-Li0.5TiO2.
As shown in Fig. 8B and C, increasing the cycling rate to 2C and 5C does not qualitatively change the behaviour of FWHM of the reflections: the α-TiO2 reflections increase while the β-Li0.5TiO2 reflections decrease or remain constant in FWHM with increasing overall Li composition, indicating the same two-phase reaction with the 1C discharge. It is noted that FWHM of the β-Li0.5TiO2 reflections increases with the cycling rate: for example, as shown in Fig. 8A–C(ii), the FWHM of the (204) reflection of β-Li0.5TiO2 is 0.19°, 0.36°, and 0.4° (2θ) for 1C, 2C, and 5C, respectively, suggesting the formation of smaller β-Li0.5TiO2 domains or larger microstrain with increasing rate. Broad reflections with weak intensities can lead to large uncertainties in the determination of FWHM, as can be seen in the fitting pattern for the β-Li0.5TiO2 (011) reflection (whose FWHM is not presented in Fig. 8C for this reason) in Fig. S5C† for the overall Li composition of 0.19 during 5C discharge at room temperature. As with discharge at room temperature, cycles at 80 °C for 100 nm particles (Fig. 9) still proceed by a two-phase reaction, the α-TiO2 domain size decreasing and the β-Li0.5TiO2 domain size increasing with increasing overall Li composition. Our observation is consistent with the previous room temperature in situ XRD study,9 which reported a two-phase mechanism for the phase transition of 130 nm anatase TiO2 particles at a discharge rate of C/120. The simultaneous nucleation in all particles, as opposed to particle by particle nucleation, is attributed to the much higher rate applied in this study.
The lithiation process of 100 nm TiO2 particles is summarised in Fig. 10: (i) lithiation starts with a single phase reaction in the α-TiO2 phase, followed by (ii) simultaneous nucleation of β-Li0.5TiO2 domains in all particles; (iii) the β-Li0.5TiO2 domains continue to grow until all the α-TiO2 domains are transformed into β-Li0.5TiO2.
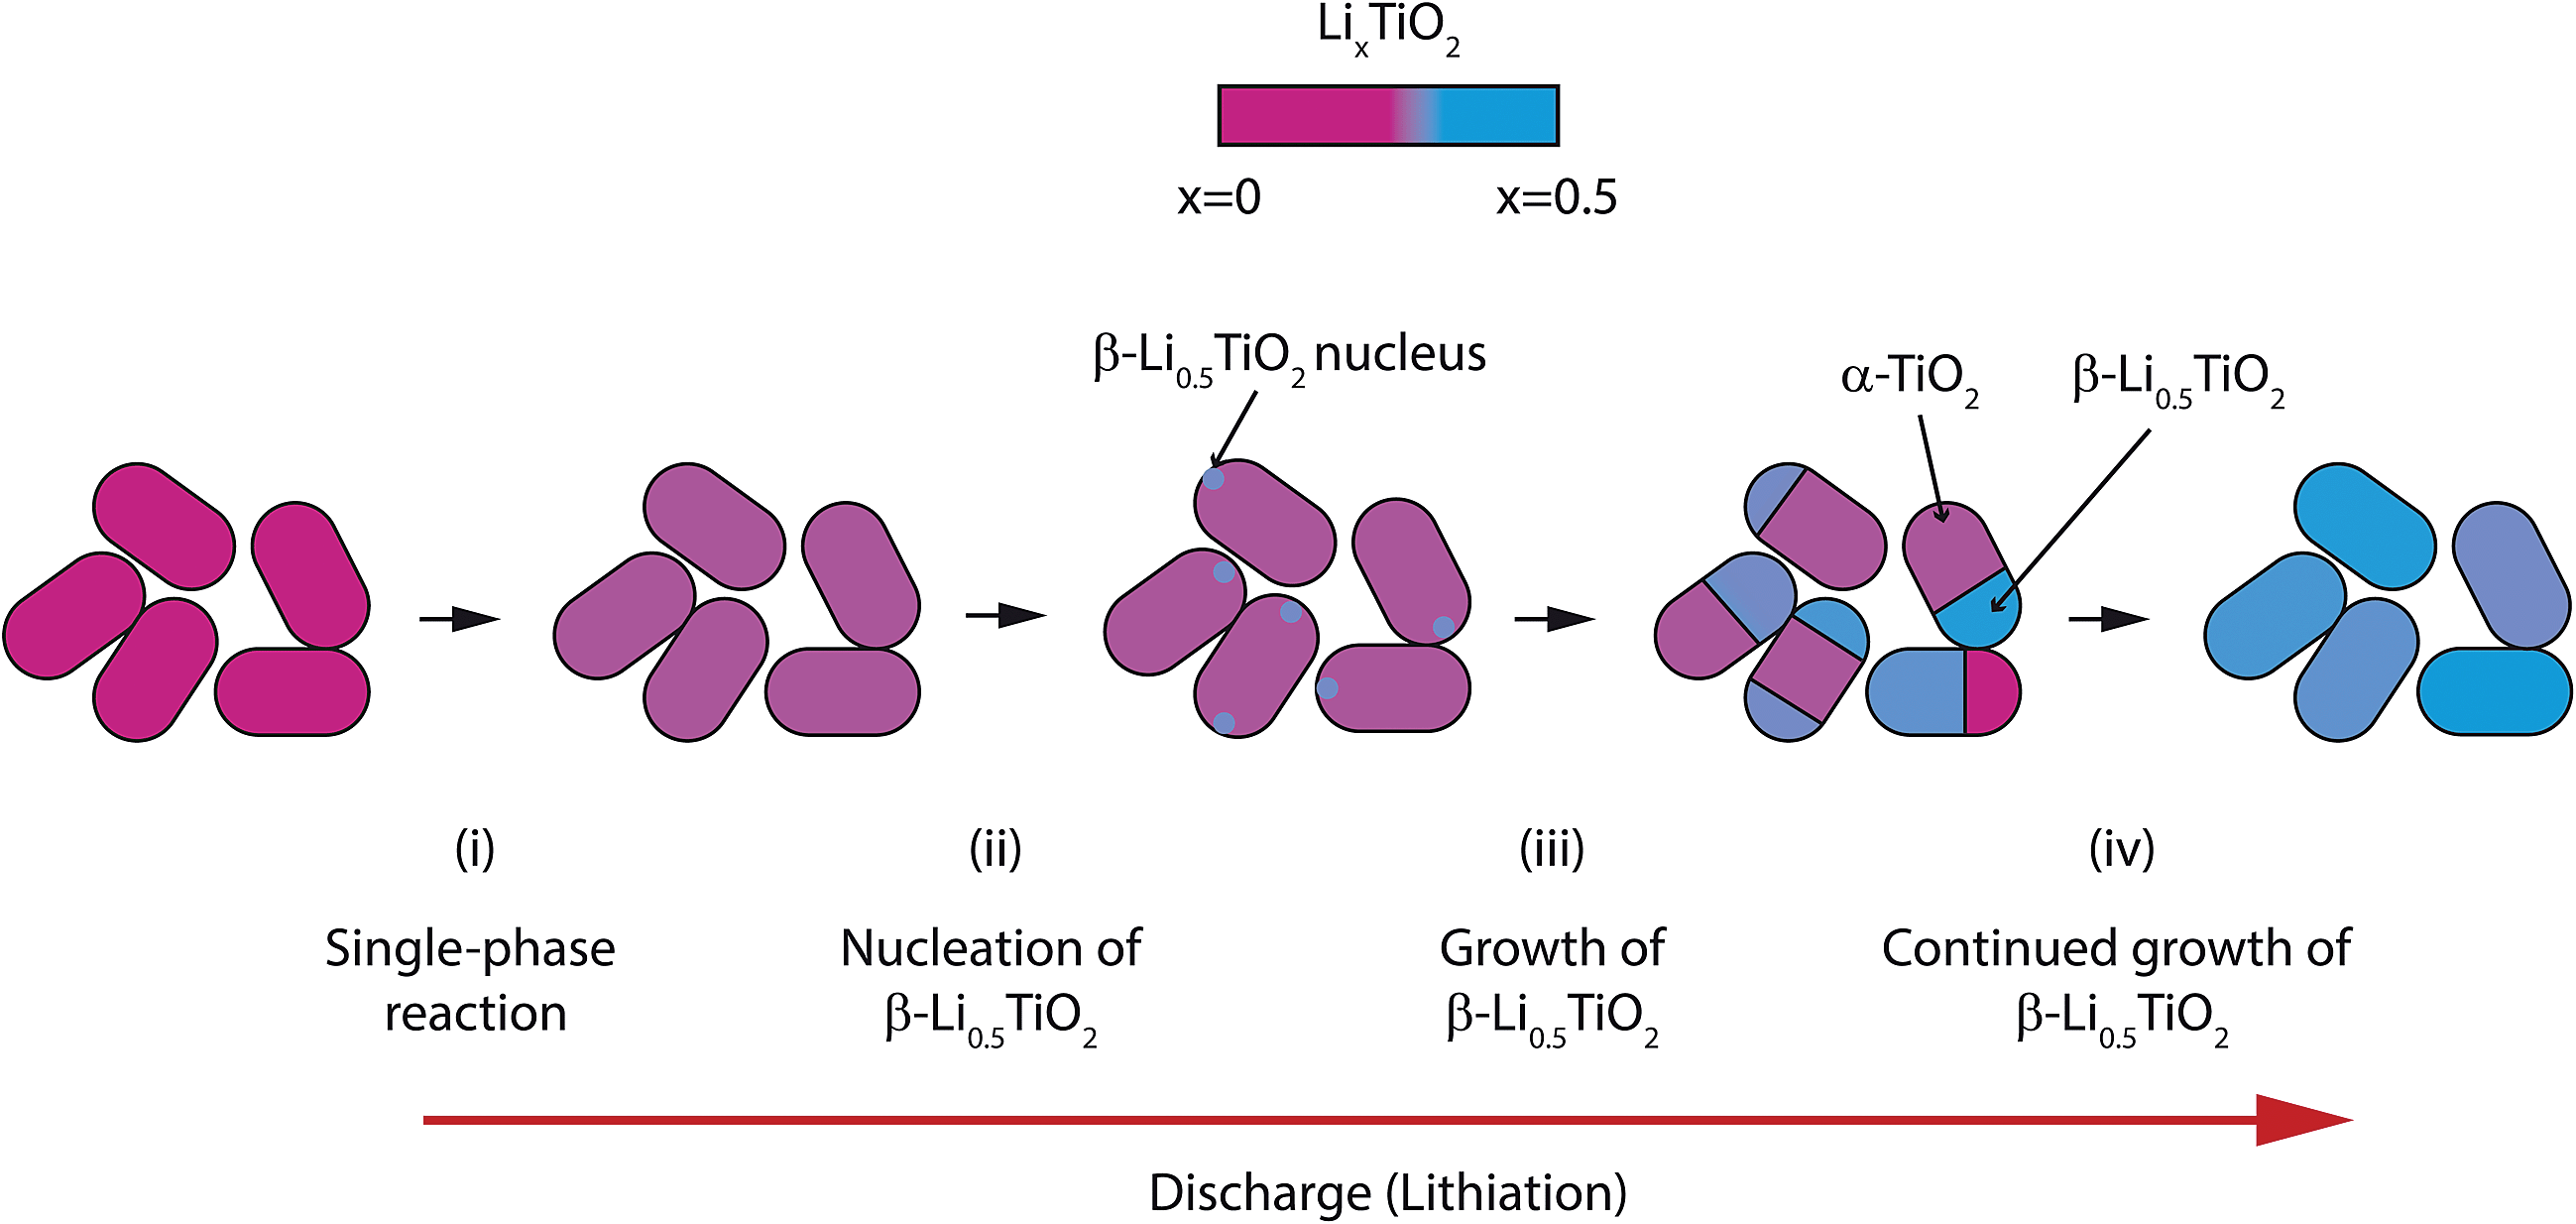 | ||
| Fig. 10 Schematic illustration of the phase transition occurring in 100 nm anatase TiO2 particles during high rate discharge. The lithiation proceeds firstly by a solid solution reaction in the α-TiO2 phase (i) followed by the nucleation of β-Li0.5TiO2 (ii). The β-Li0.5TiO2 domains grow in size until the entire particle comprises a single phase (iii and iv). | ||
25 nm TiO2 particles
The fitting results for 25 nm particles are shown in Fig. 11 and 12 for cycles at room temperature and 80 °C, respectively. Typical peak fitting results can be found in Fig. S6.† During room temperature 1C discharge (Fig. 11A(i)) the FWHM of the α-TiO2 reflections increases from 0.2° to 0.3° (2θ) from an overall Li composition of 0 to 0.4. The evolution of the β-Li0.5TiO2 reflections, shown in Fig. 11A(ii), follows the same trend as observed for the 100 nm particles: the FWHM of the (011) and (204) reflections decreases with increasing overall Li composition, while the FWHM of the (220) reflection decreases first until the overall Li composition reaches 0.45, after which it increases again. Fig. 11A(iii) shows the domain size as a function of overall Li composition deduced from the FWHM of the (116) reflection of α-TiO2 and the (011) reflection of β-Li0.5TiO2. As shown in Fig. 11A(iii) for a 1C discharge, the domain size of α-TiO2 decreases from 23 to 15 nm when the overall Li composition increases from 0 to 0.4, meanwhile the phase fraction of α-TiO2 decreases by 80%. If the two phases in a spherical particle assume a core–shell morphology, where the core is α-TiO2 and the shell is β-Li0.5TiO2, the volume fraction of a 15 nm diameter spherical core of α-TiO2 in a 23 nm diameter spherical particle would correspond to 28%, which is very close to the 20% phase fraction of the α-TiO2 phase. However, this core–shell arrangement would leave a shell (β-Li0.5TiO2) of 4 nm thick, which is far less than the value, 17 nm, determined from the Scherrer formula. Therefore, the only plausible explanation is that the lithiation takes place particle by particle and the decrease in the domain size of α-TiO2 from 23 nm to 15 nm is associated with the microstrain developed in α-TiO2. This microstrain could result from the distortion present in the α-TiO2 phase and/or the Li composition variation between different α-TiO2 particles. The particle-by-particle mechanism also stipulates a constant domain size for β-Li0.5TiO2, hence, the very large broadening at the point where the β-Li0.5TiO2 peaks emerge is also associated with the microstrain effect, which is likely to be caused by compositional variation between β-Li0.5TiO2 particles. Reactions at higher rates, shown in Fig. 11B for 2C and Fig. 11C for 5C, exhibit qualitatively similar behaviour and also proceed particle by particle. The domain size of β-Li0.5TiO2 at 5C discharge (Fig. 11C) is 12 nm at the overall Li composition of 0.4, well below 20 nm observed at the end charge for cycle rates of 1C and 2C, despite the dominant presence of the β-Li0.5TiO2 phase. Hence, this provides a direct evidence for the presence of microstrain in β-Li0.5TiO2. | ||
| Fig. 11 The evolution of the FWHM of select reflections from both α-TiO2 and β-Li0.5TiO2 (i and ii), the domain size determined from the FWHM of the (116) reflection for α-TiO2 and the (011) reflection for β-Li0.5TiO2 (iii), and scale factor (iv) as a function of the overall inserted Li for 25 nm particles during discharge at cycle rates of (A) 1C, (B) 2C and (C) 5C discharge at room temperature. | ||
 | ||
| Fig. 12 The evolution of the FWHM of select reflections from both α-TiO2 and β-Li0.5TiO2 (i and ii), the domain size determined from the FWHM of the (116) reflection for α-TiO2 and the (011) reflection for β-Li0.5TiO2 (iii), and scale factor (iv) as a function of the overall inserted Li for 25 nm particles during discharge at cycle rates of (A) 5C, (B) 10C and (C) 20C discharge at 80 °C. | ||
When the temperature is raised to 80 °C, for example, for the cycle rate of 5C as shown in Fig. 12A(i), the FWHM of the (024) reflection of α-TiO2 remains almost constant at ∼0.18° throughout the entire overall Li composition, while the FWHM of the (116) and (220) reflections of α-TiO2, after a rapid initial increase from 0 to 0.07 overall Li, which is attributed to the microstrain effect, also shows very little change over the rest of the overall Li composition range. As shown in Fig. 12A(ii), the FWHM of the (011) reflection of β-Li0.5TiO2 decreases monotonically with increasing overall Li composition, whereas the FWHM of the (204) and (220) reflections decreases from 0.2 to 0.45 overall Li composition and increases from 0.45 overall Li composition onwards. The increase in the FWHM of the (204) and (220) reflections of β-Li0.5TiO2 is attributed to the microstrain effect. As shown in Fig. 12A(iii), the domain size of α-TiO2 determined from FWHM of the (116) reflection of α-TiO2 remains effectively invariant at ∼20 nm except the small initial drop from 23 nm to 20 nm from 0 to 0.07 overall Li composition. Since the 10C and 20C discharge was carried out consecutively on the same cell after the cycle at 5C, a small amount (∼10%) of the β-Li0.5TiO2 phase (residual β-Li0.5TiO2), which did not transform back to α-TiO2, was present at the beginning of 10C and also 20C discharge (shown in Fig. S6C† for 10C charge). The presence of the residual β-Li0.5TiO2 phase complicates the interpretation of the FWHM of the β-Li0.5TiO2 reflections: the increase, as opposed to the decrease as observed at all other rates, in the FWHM of the β-Li0.5TiO2 reflections, as shown in Fig. 12B(ii) and C(ii) for 10C and 20C, respectively, is attributed to the formation of β-Li0.5TiO2 particles that are not compositionally homogeneous. Nonetheless, interpretation of the FWHM of the α-TiO2 reflections and the deduced domain size of α-TiO2, is not affected: the effectively invariant domain size (∼20 nm) of α-TiO2 throughout the entire overall Li composition for the 10C and 20C discharge, shown in Fig. 12B(iii) and C(iii), respectively, is consistent with the particle-by-particle reaction mechanism.
The particle-by-particle reaction mechanism is in agreement with the previous findings from in situ9 and ex situ4 XRD studies of anatase TiO2 nanoparticles (15 nm and <40 nm, respectively), and is attributed to the relatively high energy of the α-TiO2/β-Li0.5TiO2 interface, whose disappearance reduces the total energy of the system. Fig. 13 summarises the lithiation process: (i) the initial lithiation involves a single phase reaction in the α-TiO2 phase; (ii) further lithiation triggers the transformation of an entire α-TiO2 domain into a β-Li0.5TiO2 one (stages (ii–iv)). This transformation does not occur simultaneously in all particles but proceeds from particle to particle until every particle is transformed.
 | ||
| Fig. 13 Schematic illustration of the phase transition occurring in 25 nm anatase TiO2 particles during high rate discharge. Lithiation proceeds firstly by a solid solution reaction in the α-TiO2 phase (i) followed by the sequential (particle-by-particle) transformation from α-LizTiO2 to β-Liz′TiO2 particles (ii–iv), where z > 0.025 and z′ < 0.5. | ||
Discussion on the nature of the “instantaneous” α-TiO2 to β-Li0.5TiO2 phase transition of 25 nm TiO2 particles
What remains unanswered from the preceding sections is the microscopic process by which an entire α-TiO2 domain transforms into a β-Li0.5TiO2 one. Analogous to the case for LiFePO4 nanoparticles, two mechanisms need to be examined: (i) phase transition by a continuous structural change from α-TiO2 to β-Li0.5TiO2, and (ii) nucleation of β-Li0.5TiO2 in α-TiO2 domain followed immediately (i.e., essentially instantaneous) by the fast propagation of the phase boundary (the domino-cascade mechanism10).Since the transformation from α-TiO2 to β-Li0.5TiO2 involves a change in crystal symmetry from I41/amd to Imma, corresponding to a group–subgroup relationship, a continuous path, if there is one, between the two phases must undergo a second-order phase transition. Although a continuous structural transition between α-TiO2 and β-Li0.5TiO2 is found, with the use of the programme ISOTROPY,21 to be allowed by Landau theory,22 whether it will occur depends on the energetics and kinetics of various transition pathways.
The Gibbs free energy diagram for different phase transition paths is displayed in Fig. 14. If the transformation from α-TiO2 to β-Li0.5TiO2 proceeds by a continuous overpotential driven structural phase transition, the energy will evolve along the solid black curve during lithiation: the initial lithiation involves the single-phase reaction of α-TiO2 until it reaches the critical point O, beyond which the energy for the high symmetry phase (α-TiO2) becomes higher than the low symmetry one (β-Li0.5TiO2). Therefore, traversing across point O from left to right along the solid black line, the entire nanoparticle will first transform to a lower symmetry (orthorhombic) phase, and then continue to be lithiated via a single-phase reaction. This transition across point O should manifest itself in the XRD measurement as the branching of a single (0kl) (l can be 0) reflection into two separate, (0kl) and (h0l), reflections, which is characteristic of a continuous structural (second-order) transition. In the case studied here, no branching of the (024) reflection of α-TiO2 into the (024) and (204) reflections of β-Li0.5TiO2 is observed. In addition, cycling at 10C and 20C should have induced an appreciable fraction of the TiO2 particles to react at a time, as observed for LiFePO4,1,2 if a continuous structural transition did take place.
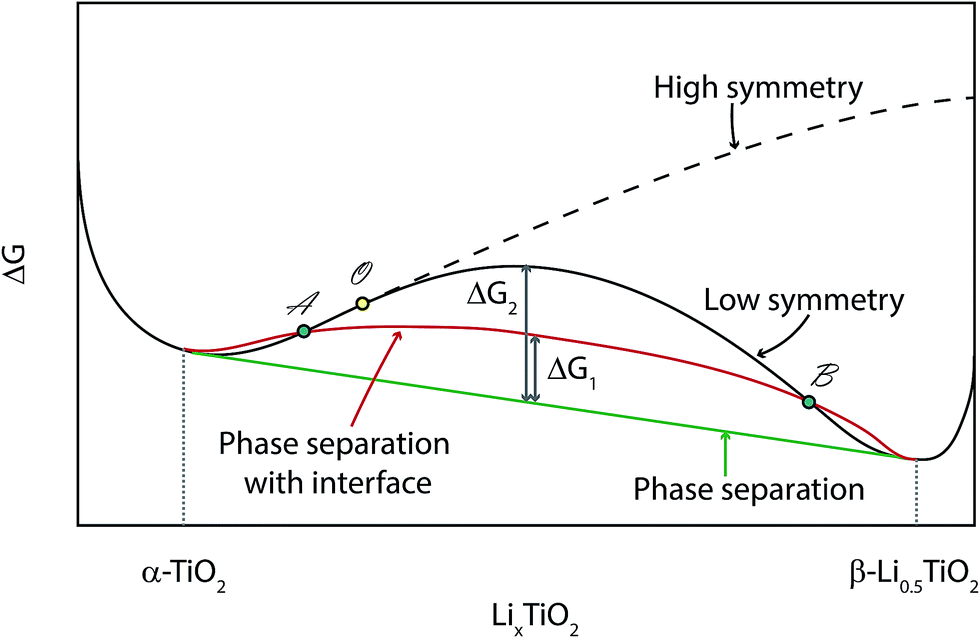 | ||
| Fig. 14 Illustration of the change in Gibbs free energy for various phase transition paths. The solid black line represents a continuous structural transition (second-order phase transition), and the critical point is marked by ○ (solid yellow circle). The dashed black line is the projected energy curve if there is no reduction to lower symmetry. The solid green line is the common tangent construction that determines the lowest possible energy of a system with a mixture of α-TiO2 and β-Li0.5TiO2 not coexisting in the same particle. The solid red line is the modified energy of a system with a mixture of α-TiO2 and β-Li0.5TiO2 separated by a phase boundary. | ||
If the transformation takes place via a nucleation and growth mechanism, which is found to be the case in this work, the Li composition in the nanoparticle will evolve along the solid red curve, which differs from the equilibrium energy (solid green) only by an α-TiO2/β-Li0.5TiO2 interfacial energy, ΔG1. Phase separation will be induced within the composition between A and B, i.e. between the points where the red curve crosses the black curve. Consequently, the lithiation process is limited by the rate of nucleation.
Kinetics aside, the transformation should take the route that lies lower in energy, and it is possible that the energy barrier for the second-order phase transition (solid black curve) is too high for it to occur. In addition, the interfacial energy, ΔG1, can be minimised by forming an interface along a zero-strain plane,7 hence favouring the two-phase mechanism with a fast propagation of the interface. In this work, when Li diffusion is improved at high temperature, the lithiation process becomes almost independent of the cycling rate and remains distinctively two-phase, i.e. the lattice parameters of each phase remain almost invariant in the regime when both phases are present, as seen in Fig. 6D. This observation suggests any lattice parameter deviation from equilibrium values observed for the room temperature cycling is primarily due to slow Li diffusion, which is found to cause deviations in lattice parameters even during lithiation at a rate of C/120.9 It must be pointed out that the deviation from equilibrium observed here is fundamentally different from the non-equilibrium phase transition observed for LiFePO4 at high rates: the non-equilibrium phase transition of LiFePO4 is rooted in the small energy difference between the equilibrium and non-equilibrium phase transition path,23 which is not available to anatase TiO2.
Conclusions
The lithiation mechanism of anatase TiO2 particles during Li insertion was investigated by in situ XRD as a function of rate, particle size and cycling temperature. Li solubilities of the end member phases, α-TiO2 and β-Li0.5TiO2, are found to increase noticeably with increasing rate, yet no continuous transition from α-TiO2 to β-Li0.5TiO2 is observed, even at a cycle rate of 20C, in contrast to the behaviour observed for LiFePO4.1,2 An increase in temperature from room temperature to 80 °C results a significant improvement in the electrode's electrochemical performance although the reaction still proceeds by a two-phase reaction. The Li solubility exceeds the thermodynamic limit and increases with cycling rate for both the α-TiO2 and β-Li0.5TiO2 phases, due to the kinetic limitation imposed by the finite Li diffusivity. Domain size information obtained from the line broadening analysis reveals a change in the phase transition mechanism brought about by a reduction in particle size from 100 nm to 25 nm: the 100 nm particles react simultaneously via a conventional nucleation and growth (two-phase) mechanism, while the 25 nm particles react sequentially again via a two-phase, domino-cascade mechanism. (De)lithiation via a first-order rather than a second-order phase transition may be inherent in phase-separating compounds with end member phases of different symmetries. The lack of a continuous structural phase transition may hinder the reaction kinetics, and the search for high-rate electrode materials should be focused on compounds exhibiting no phase separation or phase-separating compounds with isostructural end member phases.Acknowledgements
This research used resources of the Advanced Photon Source, a U.S. Department of Energy (DOE) Office of Science User Facility operated for the DOE Office of Science by Argonne National Laboratory under Contract No. DE-AC02-06CH11357. This work was supported by funding from European Union FP7-265368 via the Eurolion Project and the Cambridge Overseas Trust (materials preparation, XRD), and as part of the NorthEast Center for Chemical Energy Storage (NECCES), an Energy Frontier Research Center funded by the U.S. Department of Energy, Office of Science, Basic Energy Sciences under Awards DE-SC0012583 (data analysis). We thank Dr Tao Liu for help with the SEM, Dr Simon Clarke and Dr Michael Carpenter for their helpful comments and discussions, and Dr Kamila Wiaderek, Dr Olaf Borkiewicz, Dr Karena Chapman and Dr Peter Chupas for their help with the setup for XRD measurement.Notes and references
- H. Liu, F. C. Strobridge, O. J. Borkiewicz, K. M. Wiaderek, K. W. Chapman, P. J. Chupas and C. P. Grey, Science, 2014, 344, 1252817 CrossRef PubMed.
- X. Zhang, M. van Hulzen, D. P. Singh, A. Brownrigg, J. P. Wright, N. H. van Dijk and M. Wagemaker, Nano Lett., 2014, 14, 2279–2285 CrossRef CAS PubMed.
- A. Singer, A. Ulvestad, H. Cho, J. W. Kim, J. Maser, R. Harder, Y. S. Meng and O. G. Shpyrko, Nano Lett., 2014, 14, 5295–5300 CrossRef CAS PubMed.
- M. Wagemaker, W. J. H. Borghols and F. M. Mulder, J. Am. Chem. Soc., 2007, 129, 4323–4327 CrossRef CAS PubMed.
- M. Wagemaker, G. J. Kearley, A. A. Van Well, H. Mutka and F. M. Mulder, J. Am. Chem. Soc., 2003, 125, 840–848 CrossRef CAS PubMed.
- D. Murphy, R. Cava, S. Zahurak and A. Santoro, Solid State Ionics, 1983, 9–10, 413–417 CrossRef CAS.
- A. A. Belak, Y. Wang and A. Van Der Ven, Chem. Mater., 2012, 24, 2894–2898 CrossRef CAS.
- W. J. H. Borghols, D. Lützenkirchen-Hecht, U. Haake, E. R. H. van Eck, F. M. Mulder and M. Wagemaker, Phys. Chem. Chem. Phys., 2009, 11, 5742–5748 RSC.
- K. Shen, H. Chen, F. Klaver, F. M. Mulder and M. Wagemaker, Chem. Mater., 2014, 26, 1608–1615 CrossRef CAS.
- C. Delmas, M. Maccario, L. Croguennec, F. Le Cras and F. Weill, Nat. Mater., 2008, 7, 665–671 CrossRef CAS PubMed.
- O. J. Borkiewicz, B. Shyam, K. M. Wiaderek, C. Kurtz, P. J. Chupas and K. W. Chapman, J. Appl. Crystallogr., 2012, 45, 1261–1269 CrossRef CAS.
- A. A. Coelho, TOPAS v2.0: General profile and structure analysis software for powder diffraction data, Karlsruhe, 2000 Search PubMed.
- M. Järvinen, J. Appl. Crystallogr., 1993, 26, 525–531 CrossRef.
- T. Ohzuku, T. Kodama and T. Hirai, J. Power Sources, 1985, 14, 153–166 CrossRef CAS.
- Y.-G. Guo, Y.-S. Hu and J. Maier, Chem. Commun., 2006, 2783–2785 RSC.
- J. S. Chen, Y. L. Tan, C. M. Li, Y. L. Cheah, D. Luan, S. Madhavi, F. Y. C. Boey, L. A. Archer and X. W. Lou, J. Am. Chem. Soc., 2010, 132, 6124–6130 CrossRef CAS PubMed.
- X. P. Gao, Y. Lan, H. Y. Zhu, J. W. Liu, Y. P. Ge, F. Wu and D. Y. Song, Electrochem. Solid-State Lett., 2005, 8, A26 CrossRef CAS.
- G. Sudant, E. Baudrin, D. Larcher and J.-M. Tarascon, J. Mater. Chem., 2005, 15, 1263–1269 CAS.
- P. Bai, D. A. Cogswell and M. Z. Bazant, Nano Lett., 2011, 11, 4890–4896 CrossRef CAS PubMed.
- M. Wagemaker, R. van de Krol, A. P. Kentgens, A. A. van Well and F. M. Mulder, J. Am. Chem. Soc., 2001, 123, 11454–11461 CrossRef CAS PubMed.
- H. T. Stokes, D. M. Hatch and B. J. Campbell, ISOTROPY Software Suite, iso.byu.edu Search PubMed.
- L. D. Landau and E. M. Lifshitz, Statistical Physics, Pergamon Press, Oxford, 3rd edn, 1980 Search PubMed.
- R. Malik, F. Zhou and G. Ceder, Nat. Mater., 2011, 10, 587–590 CrossRef CAS PubMed.
Footnote |
| † Electronic supplementary information (ESI) available. See DOI: 10.1039/c6ta00673f |
| This journal is © The Royal Society of Chemistry 2016 |