Monolithic nitrogen-doped carbon as a water sorbent for high-performance adsorption cooling

Lukas Hubera, Patrick Ruch*b, Roland Hauertc, Gesine Saucked, Santhosh Kumar Matamd, Bruno Michelb and Matthias M. Koebel*a
aEmpa Swiss Federal Laboratories for Material Science & Technology, Laboratory for Building Energy Materials and Components, Überlandstrasse 129, CH-8600 Dübendorf, Switzerland. E-mail: matthias.koebel@empa.ch; Tel: +41 58 765 4780
bIBM Research GmbH, Säumerstrasse 4, CH-8803 Rüschlikon, Switzerland. E-mail: ruc@zurich.ibm.com; Tel: +41 44 724 8923
cEmpa Swiss Federal Laboratories for Material Science & Technology, Laboratory for Joining Technologies and Corrosion, Überlandstrasse 129, CH-8600 Dübendorf, Switzerland
dEmpa Swiss Federal Laboratories for Material Science & Technology, Materials for Energy Conversion Laboratory, Überlandstrasse 129, CH-8600 Dübendorf, Switzerland

Received 7th January 2016 , Accepted 23rd February 2016

First published on 26th February 2016


Abstract

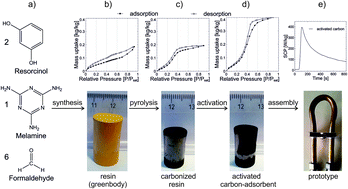
In the present study, we report on the development of carbon adsorbents for water adsorption heat pumps. Resorcinol-melamine-formaldehyde (RMF) resins were synthesized and molded into monolithic shapes before pyrolysis and chemical activation with KOH. The influence of the carbonization and activation treatments on the physicochemical properties and the water sorption behavior of the final adsorbent materials were investigated. Activated carbons with a one-to-one (C to KOH) impregnation mass ratio, an activation temperature of 800 °C and an activation time of one hour exhibited the highest water cycling ability. For isobaric adsorption at 23 mbar, the peak specific cooling power of the best monolithic activated carbon produced in this way was 192 W kg−1 for a temperature step from 90 °C to 50 °C compared to 255 W kg−1 for silica gel for a finned tube heat exchanger of comparable fin spacing. For a temperature step from 60 °C to 30 °C, the monolithic activated carbon exhibited a higher peak specific cooling power (389 W kg−1) compared to silica gel (240 W kg−1). In situ infrared thermography revealed superior thermal transport properties of the monolithic carbons compared to commercial silica gel.


Introduction

Adsorption heat pumps (AHP) are driven by heat rather than electrical energy, which makes them excellent candidates for solar cooling applications. They run mainly on waste heat or solar heat, which reduces the amount of electrical energy needed per kW of cooling power compared to compression heat pumps. Fundamental limitations in AHPs originate from the low thermal conductivity and poor heat and mass transport properties of the solid adsorbent available.1 To address these issues, monolithic adsorbents have been proposed to enhance thermal transport properties.2 In particular, monolithic carbon-based adsorbents have been investigated more recently as a new class of promising candidates.3–6 An attractive method to produce carbon monoliths with different geometries is by mold-casting of precursor resins. One disadvantage of commonly used resins such as phenol-formaldehyde, resorcinol-formaldehyde and melamine-formaldehyde is their typically long gelation times which can last up to several days.7–9 In order to increase the microporosity of the carbon monoliths which is responsible for high water sorption capacities, they must be physically or chemically activated. Alkali metal hydroxides are generally used as chemical activators to create microporosity and to increase specific surface areas in carbons derived from phenol-formaldehyde resins.10 In this work, we present a resorcinol-melamine-formaldehyde (RMF) resin synthesis as well as the carbonization and activation thereof, yielding monolithic carbons with tailorable microporosity. A schematic of the chosen synthesis methodology starting from an RMF resin formulation to the final specific cooling power measurement is presented in Fig. 1.
image file: c6ra00548a-f1.tif
Fig. 1 Experimental flow chart showing (a) molar ratios and molecular structures of precursors, (b–d) photographs of cast resins before and after pyrolysis and activation including representative water sorption isotherms, and (e) photograph of adsorber heat exchanger with a representative specific cooling power (SCP) measurement.

Although carbon is often used in combination with methanol or ammonia as refrigerants, water is the refrigerant of choice for large-scale solar cooling applications owing to its high latent heat of evaporation, non-toxicity, thermal stability and non-flammability.11 However, its affinity to carbonaceous adsorbents is significantly lower than those of the classical refrigerant systems. Shimooka et al.12 attempted to overcome this challenge by treatment of active carbon with HNO3 or HCl. It was found that the water uptake in the adsorption isotherm of the treated active carbons shifted to lower relative vapor pressure compared to those of the non-treated active carbon. In a follow-up study,13 synthesized phenol resins with chemically bound melamine (PM) were activated with KOH. This activation clearly resulted in a drastic increase of surface functional groups of the carbon model adsorbent: the activated carbon prepared from PM carbonized and activated in one step at 800 °C adsorbed 1.7 times more water than a reference silica gel. Kobayashi et al.14 prepared chemically activated polycarbonate with NaOH and KOH at low temperatures. The best activated carbon adsorbed 2 times more water between 0.1 and 0.35P/Psat compared to silica gel.

While the thermal conductivity and mass transport properties of carbon monoliths have been investigated in the past, the specific cooling power of these materials is frequently not taken into consideration despite this quantity being the most important performance metric for the adsorption cooling.5,15 Here, we report the first time application of monolithic porous carbons derived from RMF resins for adsorption cooling using water as refrigerant. The effect of the impregnation mass ratio C to KOH and the activation time on the water sorption behavior was examined. Best candidate materials were benchmarked against commercially available activated carbons and silica gel.

Experimental

Materials

Resorcinol (≥98.5%) was purchased from VWR and used as-received. Melamine (≥98%) and potassium hydroxide (≥85%) were supplied by MERCK. Sodium hydroxide (≥98%) and hydrochloric acid (37 wt%) were received from Sigma Aldrich whereas formaldehyde was obtained from Sigma Aldrich as an aqueous solution (37 wt%; methanol stabilized). All solutions were prepared from double distilled quality water. Commercial silica gel beads (RD-type, bead size 1.8–2.0 mm, Fuji Silysia Chemical Ltd.) and activated carbons (Chemviron Carbon Ltd.) were used as reference adsorbents.

Preparation of the RMF resin

A typical RMF sol preparation procedure is composed of the following steps: 20 ml distilled water and 15 ml formaldehyde were mixed in a beaker. The solution was stirred on a heating plate before 4.0 g melamine was added. The resulting whitish opaque suspension was warmed up to 55 °C for five minutes under vigorous stirring. Then, 10 ml of 0.5 M sodium hydroxide solution were added under continuous stirring. The suspension was stirred until a colorless clear solution was obtained, at which point 3 ml of concentrated hydrochloric acid and 7.0 g of resorcinol were added to the solution which was kept stirring for approximately one minute until the resorcinol became fully dissolved. This RMF sol was poured into plastic cylinder molds with an inner diameter of 16.4 mm. These cylinders were placed in an oven at 55 °C for 24 hours. On top of the gels, a small amount of syneresis liquid was observed. The gels appeared darker at the gel–air interface as a result of slight oxidation.16 The RMF resins were then removed from the mold and dried in an oven at 55 °C for 24 hours.

Pyrolysis

The RMF resins were pyrolyzed in a tube furnace (Carbolite, STF 16/50 818P). The resins were placed in a quartz boat which was inserted into the center of a ceramic tube (Pythagoras, Haldenwanger MTC). The ceramic tube was purged with nitrogen (99.995%) for 2 hours before heating to the defined pyrolysis temperature at a rate of 5°C min−1.

The chosen pyrolysis temperatures were 600 °C, 700 °C, 800 °C, 900 °C, 1000 °C and 1100 °C. The hold time at the pyrolysis temperature was 1 hour for all experiments before cooling down to room temperature at a rate of 5 °C min−1. The nitrogen flow rate during the entire pyrolysis was 22.2 norm liters per hour.

Chemical activation with KOH

The resins pyrolyzed at 900 °C were impregnated with different carbon to KOH mass ratio, namely 1[thin space (1/6-em)]:[thin space (1/6-em)]1, 1[thin space (1/6-em)]:[thin space (1/6-em)]2 and 1[thin space (1/6-em)]:[thin space (1/6-em)]4. Impregnated samples were placed into an alumina crucible and then arranged in a quartz boat. The activation heat treatment inside the tube furnace was adapted from ref. 17 as follows:

The wet monolith was dried at 110 °C for 2 hours followed by a dehydration at 400 °C for another 2 hours. Subsequently, the mixture was activated at 800 °C before the temperature was decreased again to room temperature. The heating/cooling rates were kept the same at 5 °C min−1. The nitrogen flow rate during the entire activation was also 22.2 norm liters per hour. In order to fully remove the remaining KOH and salts formed during the activation, all samples were soaked in distilled water for a week. Each day, the aqueous wash solution was replaced with fresh distilled water to maximize the removal of KOH until its final pH-value was close to 7. The designations of the samples presented here are shown in Table 1.

Table 1 Table of experiments
Sample Pyrolysis temperature [°C] C[thin space (1/6-em)]:[thin space (1/6-em)]KOH impregnation ratio [g g−1] Activation temperature [°C] Activation time [hours]
A        
A-p600 600      
A-p700 700      
A-p800 800      
A-p900 900      
A-p1000 1000      
A-p1100 1100      
A-p900-1:1-KOH-1h 900 1[thin space (1/6-em)]:[thin space (1/6-em)]1 800 1
A-p900-1:2-KOH-1h 900 1[thin space (1/6-em)]:[thin space (1/6-em)]2 800 1
A-p900-1:4-KOH-1h 900 1[thin space (1/6-em)]:[thin space (1/6-em)]4 800 1
A-p900-1:1-KOH-0.5h 900 1[thin space (1/6-em)]:[thin space (1/6-em)]1 800 0.5
A-p900-1:1-KOH-2h 900 1[thin space (1/6-em)]:[thin space (1/6-em)]1 800 2
A-p900-1:1-KOH-3h 900 1[thin space (1/6-em)]:[thin space (1/6-em)]1 800 3


Characterization

Thermogravimetric analysis (TGA) of the RMF resins was performed using a TGA/SDTA851e thermogravimetric analyzer (Mettler-Toledo). The alumina crucibles were calcined at 1000 °C in air before loading them with approximately 30 mg of resin. The measurements were conducted under nitrogen flow (50 ml min−1). The temperature ramps were identical with those in the tube furnace.

For X-ray photoelectron spectroscopy (XPS) measurements, specimens were prepared by scratching a groove in the specimens before drying them in a vacuum oven at 80 °C for 12 h. Immediately before mounting the specimen on the sample holder and subsequent evacuation to 1.3 × 10⁻⁷ mbar, each sample was fractured in ambient air to generate a fresh surface with minimal contamination. Specimens were inserted into the XPS instrument the day before the measurement. XPS spectra were acquired on a Physical Electronics (PHI) Quantum 2000 photoelectron spectrometer using monochromatic Al Kα radiation ( = 1486.6 eV) and a hemispherical capacitor electron-energy analyzer equipped with a channel plate and a position-sensitive detector. Atomic concentrations were obtained from the different peak areas after Shirley background subtraction using the built in PHI sensitivity factors. The electron take-off angle was 45° and the analyzer was operated in the constant pass energy mode. The pass energy used for the detail spectra of the C 1s, O 1s and N 1s core levels was 46.95 eV to yield a total analyzer energy resolution of 0.95 eV (for Ag 3d electrons). The spectrometer was calibrated for the Au 4f7/2 signal to be at 84.0 ± 0.1 eV and had a resolution step width of 0.2 eV. The area analyzed was typically 100 μm in diameter. Partial compensation of surface charging during data acquisition was obtained by simultaneous operation of an electron- and an argon ion-neutralizer. The samples have been measured without any prior surface cleaning and the vacuum in the main chamber was 6.6 × 10⁻⁹ mbar during analysis. The N 1s envelopes were curve-fitted by mixed Gaussian–Lorentzian component profiles using the Multipak software from Ulvac-Phi Inc. The Shirley baseline was used for background subtraction. X-ray diffraction (XRD) measurements were carried out using a PANalytical Empyrean device. The step integration time was 10.4 seconds. Two theta was varied from 5° up to 90° with a step size of 0.02°. Cu Kα served as the X-ray source. The scattered X-rays were detected with a PIXcel1D Detection System.

High-resolution transmission electron microscopy (HRTEM) characterization was performed with a JEOL 2200FS TEM/STEM microscope equipped with an in-column Omega-type energy filter operating at 200 kV.

N2 physisorption measurements were carried out at 77 K on a Micromeritics ASAP 2020 Surface Area and Porosity Analyzer. Prior to measurements, carbon monolith pieces of approximately 200 mg were degassed at 250 °C for 4.5 hours at a pressure of 1.3 × 10⁻² mbar. The micropore volume (Vmicro) was determined with the t-plot method.18 The specific surface area of the materials was calculated by the Brunauer–Emmet–Teller (BET) method over a relative pressure (P/P0) ranging from 0.1 to 0.3.19

Dynamic vapor sorption (DVS) isotherms were recorded using an isothermal gravimetric DVS apparatus (DVS Vacuum 1, Surface Measurement Systems, UK). In a gravimetric technique, the amount of adsorbed water vapor is measured directly using a sensitive recording microbalance. Residual gas was evacuated by a mechanical roughing pump and a turbomolecular pump at a vacuum below 10−4 mbar prior to measurement. The pressure in the experiment chamber during measurement was controlled by introducing water vapor from a water reservoir at 50 °C via a mass flow controller (static operation mode). Adsorption/desorption cycles were performed at a constant temperature of 50 °C. Approximately 3–8 mg of the sample material was placed in the experiment chamber. In the first step, the sample was dried at 90 °C under high vacuum (p < 10−4 mbar) for an hour and the resulting mass was taken as the dry reference mass. The sample was then cooled to 50 °C for the subsequent measurement. All data was collected at a temperature of 50 °C. To obtain the adsorption isotherm, the sample mass was recorded every 10 s during relative pressure (P/Psat) steps between 0 and 0.6 in 0.05 intervals and between 0.6 and 0.9 in 0.1 intervals. The saturation pressure of water at 50 °C is 124 mbar (P/Psat = 1). For each pressure step, the pressure was maintained until the rate of mass change became negligible (less than 0.05% min−1) and the corresponding values for pressure and mass were taken as data points for the adsorption isotherm.

Laser-flash-apperatus (LFA) measurements were carried out under vacuum conditions (10−3 mbar) with a NETZSCH LFA 457 in order to determine the thermal diffusivity α and the heat capacity Cp. The carbon monoliths were cut into disks with a diameter of 10 mm and a thickness of 1 mm using a diamond wire saw. All samples were coated with graphite spray in order to compensate for the surface roughness of the porous samples. For each sample, six measurements were performed at a temperature of 50 °C. In between the measurements, a relaxation time of five minutes allowed the sample to reach equilibrium conditions. Cp was determined via a comparative method using a Pyroceram 9609 reference sample. The uncertainty of the Cp measurement is in the range of 5%. The thermal diffusivity α was calculated by α = d2/t1/2, where d is the thickness of the disk and t1/2 the time needed for the temperature of the rear specimen surface to achieve half its peak value.

Temperature swing adsorption (TSA) tests were conducted on an adsorption test rig20 equipped with an evaporator, a flow sensor calibrated for water vapor, a thermal imaging camera (FLIR SC5000, resolution: 320 × 256 pixel) and a vacuum chamber. The mass flow rate of water vapor was converted to specific cooling power (SCP) by SCP = ΔvapH(Te), where ΔvapH is the enthalpy of evaporation of water at the evaporator temperature Te. The carbon monoliths were cut into cylinders with a diameter and a height of approximately 10 mm and 5 mm, respectively. In a typical experiment, the total mass of the carbon monoliths was 1 g. An epoxy resin (Araldit Rapid) was used to glue these cylinders between two aluminum lamellae which were pressed onto a copper tube to form an adsorber heat exchanger. A reference measurement was carried out by filling 4.7 g of silica beads between two aluminum lamellae separated by 4 mm and wrapping the lamellae with a steel wire mesh to fix the beads. The temperature of the heat transfer fluid passing through the copper tube of the heat exchanger was controlled by two hydraulic circuits coupled to the adsorber heat exchanger by a 6/2-way-valve, which was connected to two thermal baths with different temperatures. The evaporator temperature was kept at 20 °C for all measurements. Prior to the experiment, the test chamber was evacuated to a pressure below 1 mbar and the adsorber heat exchanger was heated to the maximum experimental temperature (90 °C or 60 °C) for at least one hour for the purpose of obtaining reproducible starting conditions for the temperature swing experiments.

Results and discussion

Carbonization and chemical identity

TGA studies were carried out to provide a better understanding of the pyrolysis mechanism and to determine the optimal pyrolysis temperature (Fig. 2). Good agreement is obtained between individual measurements at different pyrolysis temperatures. The degradation can be divided into three temperature ranges with pronounced mass loss and a fourth range above 600 °C where little mass loss was observed. The mass loss is attributed to the release of different molecular species identified by in situ infrared and mass spectrometry (see ESI). The first region (I) of mass loss is observed between 50 °C and 100 °C, which is attributed to adsorbed moisture within the resin being released. The mass loss in the region between 100 °C and 300 °C(II) is due to release of residual hydrochloric acid, formaldehyde and possibly piperidine from the resin.21 Above 300 °C, we observed the highest weight loss (III) due to the polycondensation reaction and oxidation of carbon. Water from the condensation reaction, carbon dioxide as well as amines are volatilized in this step. The weight loss beyond 410 °C is attributed to the thermal degradation of the triazine ring.22 It is assumed that the resin gradually deaminates and releases HCN as well as CH3CN. Above 600 °C(IV), the mass loss is small and mainly carbon dioxide and amine groups are removed. According to Costa et al.,23 the melamine formaldehyde condensate undergoes extensive degradation above 620 °C and forms volatile products. Higher pyrolysis temperatures lead to an increased mass loss.
image file: c6ra00548a-f2.tif
Fig. 2 Thermogravimetric analysis of RMF resin for different pyrolysis temperatures.

The type and atomic concentration of the chemical species present at the surface is expected to have an important effect on the water sorption behavior. XPS measurements reveal that the surface atomic composition of the dried resin contains approximately one third of nitrogen and oxygen (Table 2), which means that every third atom in the depth analyzed (ca. 3 nm) is a heteroatom without taking hydrogen into account. Higher pyrolysis temperatures were found to reduce the concentration of oxygen and especially nitrogen surface functional groups. After pyrolysis at 1100 °C, only one atomic percent of nitrogen is present at the surface of the material. Wu et al.24 reported similar results for the pyrolysis of melamine resins: the concentration of nitrogen containing surface functional groups decreased significantly upon pyrolysing above 400 °C. Oxygen containing surface functional groups were found to be less susceptible to pyrolysis: over a wide temperature range (600–1000 °C), the oxygen content only changed marginally.25

Table 2 XPS measurements of the dried resin, the pyrolyzed and the activated carbons
Sample C [at%] N [at%] O [at%]
A 65.54 17.25 17.20
A-p600 86.86 5.45 7.69
A-p700 85.17 6.19 8.64
A-p800 88.33 5.15 6.51
A-p900 89.96 4.23 5.82
A-p1000 92.42 2.39 5.19
A-p1100 93.21 1.08 5.71
A-p900-1:1-KOH-1 h 96.13 0.44 3.43


Chemical activation with KOH again leads to a significant decrease of the nitrogen containing surface functional groups from 4.23 at% to 0.44 at%. The oxygen containing surface functional groups are more stable during chemical activation, although their concentration also declines. Moreno-Castilla et al.26 observed a decrease of the surface functional groups during chemical activation with KOH which agrees with our present data.

Fig. 3 summarizes the N 1s XPS spectra of the samples before and after pyrolysis at different temperatures whereas the insert in Fig. 3 exhibits a possible structure after pyrolysis.


image file: c6ra00548a-f3.tif
Fig. 3 N 1s XPS spectra of the samples before and after pyrolysis at different temperatures. The intensity of sample A is divided by a factor of 6. Insert displays a proposed structure of the carbon after pyrolysis.

To determine the amounts of the different nitrogen components, the N 1s signal has, analogous to ref. 27–30. Been separated into four different chemical states which correspond to pyridinic-type nitrogen (N-6), pyrrolic and/or pyridone-type nitrogen (N-5), quaternary nitrogen (N-Q) and pyridine nitrogen-oxide (N-X).31,32 To compensate for possible sample charging during analysis as well as for differences in spectrometer energy scale calibration, during fitting the relative separation of these four peaks had been kept constant, and a maximum of 2.2 for FWHM was allowed. The detailed results of the fitting procedure are displayed in the ESI. Only pyrolyzed samples have been fitted, as for the resin other chemical groups would have to be considered as well. However the position of the N 1s signal of the resin indicates the absence of any N-Q and N-X groups.

The N-5 groups appear to be the least stable, their relative concentration continuously decreases with higher pyrolysis temperatures and they are no longer present at temperatures above 900–1000 °C. This is consistent with observations of Pels et al.31 who reported that pyrrolic-N is converted to N-6 above 600 °C.

The N-6 groups initially fluctuate around a relatively constant value. This is likely to be due to the simultaneous conversion of N-5 to N-6 as well as of N-6 to N-Q which seems to approximately compensate each other. At higher temperatures, where there are no longer any N-5 present, the relative concentration of N-6 decreases, indicating a continued conversion of N-6 to N-Q, consistent with the growth of the crystalline domains observed with XRD (Table 3).

Table 3 Domain size and interplanar distance in dependence of the heat treatment
Sample Lc [Å] La [Å] d002 [Å]
A-p600 8.5 16.9 3.7
A-p700 8.8 17.0 3.7
A-p800 8.8 17.0 3.7
A-p900 8.9 17.0 3.7
A-p1000 9.2 18.7 3.7
A-p1100 9.7 18.7 3.7
A-p900-1:1-KOH-1h 8.4 16.9 3.7


The relative concentration of N-X is slightly increasing with increasing pyrolysis temperature, indicating stable N-oxide groups in these materials. The activation of the carbons with KOH seems to have a similar effect on the nitrogen speciation as a higher pyrolysis temperature.

Microstructural features

The X-ray diffractograms of samples pyrolyzed at different temperatures are summarized in Fig. 4. Residuals of sodium chloride stemming from the sol–gel synthesis were detected (marked with asterisks) in the resin as well as in the carbon pyrolyzed at 600 °C and 700 °C. In carbons pyrolyzed above 800 °C, no residuals of sodium chloride were detected. This might be due to the melting point of sodium chloride which is at 801 °C. The (002) peak which is related to periodicity along the z-axis sharpens slightly with higher pyrolysis temperature. The scattering at low angles increases with higher pyrolysis temperature, which indicates the evolution of porosity. A study from Ko et al.33 shows a similar behavior for the development of the (002) peak as well as the scattering at low angles. In the dried resin, the broad band at a maximum of 22° is due to adjacent chains of linear polymer.34 After pyrolysis, this band disappears whereby a new one is formed at 2θ of 24.5°, which indicates the formation of short-range ordered structures from polyaromatic ring species. This peak sharpens with increasing pyrolysis temperature, an indication for enhanced ordering in the carbon material. Chemical activation with KOH, on the other hand, reduces the intensity of this peak particularly when high impregnation ratios are used. This indicates the destruction of the stacking order of the graphene sheets during chemical activation.
image file: c6ra00548a-f4.tif
Fig. 4 X-ray diffractograms of the resin, the pyrolyzed and activated carbon. Diffraction peaks attributable to NaCl are marked with asterisks.

Table 3 shows the influence of the pyrolysis temperature on the domain size, which was calculated by the Scherrer equation, Δ(2θ) = /(L[thin space (1/6-em)]cos[thin space (1/6-em)]θ). Δ(2θ) is the full width at half maximum (FWHM), λ the wavelength of the X-ray source (1.54 Å), L the domain size, θ the scattering angle and K represents a dimensionless shape factor which was set to 0.9 in the calculation. The crystallite length La was derived from the (100) band at 44° while the crystallite height Lc was derived from the (002) band at 24.5°.

Higher pyrolysis temperatures led to a slight increase in domain sizes. Above 600 °C, no pronounced change in the ratio of aromatic to linear sp2-hybridized carbon could be detected by Raman spectroscopy (see ESI), which may be due to the fact that the temperature range studied in this work is significantly lower than that required for graphitization. Carbons pyrolyzed at 600 °C exhibit a small (100) scattering peak at 44° which becomes more intense with higher pyrolysis temperature. This is indication of the growth of the carbon basal planes. Using the Bragg equation, 2d[thin space (1/6-em)]sin[thin space (1/6-em)]θ = , the distance d between two graphene planes was calculated for the first order diffraction peak (n = 1) based on the (002) band (Table 3). This distance was determined to be 3.7 Å which is typical for disordered carbons, compared to the interplanar spacing for crystalline graphite which is 3.35 Å.35 Note that, contrary to graphite, no stacking order of the graphene planes was found for the materials synthesized in the present work.

High resolution transmission electron micrographs of sample A-p900 and A-p900-1:1-KOH-1h are shown in Fig. 5. The microstructure is comparable to that of other forms of disordered carbon:35 there is no discernable long-range order, but there is local ordering in some regions involving 3–4 stacked graphene layers. The chemical activation with KOH does not seem to influence the alignment of the graphene layers. These micrographs support the observations of the XRD measurements: the calculated domain size along (002) lies between 8.4 and 9.7 Å which corresponds approximately to the distance between 3 graphene layers. Further, the lateral extension of the ordered domains was estimated to be between 16.9 and 18.7 Å from XRD (Table 3), which also agrees well with the TEM observations. The dashed square in Fig. 5b represents a possible domain with a lateral extension of 17 Å and a height of 9 Å. Fig. 6a illustrates the N2 adsorption and desorption isotherms of the carbons prepared at different pyrolysis temperatures. It can be seen that the isotherms of the carbons pyrolyzed between 600 °C and 900 °C are similar. The activated carbon shows a higher nitrogen sorption capacity at low relative pressure (p/p0 < 0.1) compared to the reference silica gel (Fig. 6b). The influence of the pyrolysis temperature on the BET surface area is shown in Table 4. Up to 900 °C, the BET surface area ranges between ca. 360 and 410 m2 g−1. Pyrolyzing carbons above 900 °C leads to a significant decrease in the BET surface area, which is less than 50 m2 g−1. One reason might be the significant decrease of the micropore volume that is the main contribution to the total BET surface area of the materials. Similarly, Pekala et al.7 have found a decreased BET surface area of resorcinol-formaldehyde resins that were pyrolyzed above 800 °C. By chemical activation with KOH at 800 °C, however, the BET surface area can significantly be increased to more than 800 m2 g−1 without destroying the carbon monolith. The reference silica gel has a similar BET surface area and total pore volume compared to the chemically activated carbon.


image file: c6ra00548a-f5.tif
Fig. 5 HRTEM micrograph of sample (a) A-p900 and (b) A-p900-1:1-KOH-1h. Dashed square represents a possible domain in agreement with XRD analysis.

image file: c6ra00548a-f6.tif
Fig. 6 The nitrogen adsorption (open symbols) and desorption (closed symbols) isotherms of (a) pyrolyzed carbons and (b) activated carbon and reference silica gel.
Table 4 BET surface area, micropore volume and total volume of pyrolyzed and activated carbons
Sample BET surface area [m2 g−1] Micropore volume [cm3 g−1] Total pore volume [cm3 g−1]
a t-Plot method not applicable.
A-p600 376 0.15 0.21
A-p700 389 0.15 0.23
A-p800 363 0.14 0.22
A-p900 410 0.15 0.22
A-p1000 36 0.01 0.06
A-p1100 32 0.01 0.03
A-p900-1:1-KOH-1h 839 0.30 0.42
Reference silica gel 779 n/aa 0.43


Water sorption isotherms

The influence of the pyrolysis temperature on the water sorption behavior is illustrated in Fig. 7. The samples which were pyrolyzed in the tube furnace below 800 °C still contain sodium chloride as detected by XRD (Fig. 4). This explains the increased water uptake above 0.7 relative pressure for these samples.36 The water uptake at relative pressure below 0.4 improved with increasing pyrolysis temperature from 600 °C to 800 °C. The adsorption isotherm for the sample pyrolyzed at 900 °C shows the most pronounced increase in sorption with highest water cycling capacity below 0.4 relative pressure. Above a pyrolysis temperature of 900 °C, the water uptake is shifted to higher relative pressure, which indicates an increase in hydrophobicity. Also, at pyrolysis temperatures above 900 °C, a collapse in BET surface area was measured indicating a loss in accessible surface area (Table 4). In this regard, the high sorption capacity of the samples pyrolyzed at 1000 °C and 1100 °C is unexpected. The sample A-p900 was selected for further activation owing to its combination of high sorption capacity and hydrophilicity.
image file: c6ra00548a-f7.tif
Fig. 7 Water sorption for RMF resins pyrolyzed at different temperatures.

The water sorption isotherms of KOH activated carbons with different impregnation ratios are given in Fig. 8a. Compared to the non-activated sample, the water sorption capacity is higher due to the increased specific surface area and pore volume. At an activation temperature of 800 °C, a higher sorption capacity was found for the sample impregnated at a C[thin space (1/6-em)]:[thin space (1/6-em)]KOH mass ratio of 1[thin space (1/6-em)]:[thin space (1/6-em)]1 compared to the sample impregnated at 1[thin space (1/6-em)]:[thin space (1/6-em)]2 (Fig. 8a). The sample with the highest impregnation ratio shows a sorption capacity of nearly 50% with most of the uptake occurring between 0.3 and 0.6 P/Psat. The onset of water sorption for impregnation ratios of 1[thin space (1/6-em)]:[thin space (1/6-em)]2 and 1[thin space (1/6-em)]:[thin space (1/6-em)]4 occurred at higher relative pressure compared to the impregnation ratio of 1[thin space (1/6-em)]:[thin space (1/6-em)]1 due to an increased hydrophobicity and/or larger pores. Also, the monoliths with C[thin space (1/6-em)]:[thin space (1/6-em)]KOH impregnation ratios 1[thin space (1/6-em)]:[thin space (1/6-em)]2 and 1[thin space (1/6-em)]:[thin space (1/6-em)]4 crumbled during the activation process, which resulted in powdered samples.


image file: c6ra00548a-f8.tif
Fig. 8 Water sorption isotherm of RMF resin pyrolyzed at 900 °C for 1 hour and activated with (a) different C[thin space (1/6-em)]:[thin space (1/6-em)]KOH mass impregnation ratios or (b) different activation times.

Fig. 8b illustrates the influence of the activation time on the water sorption behavior. All samples have an impregnation ratio C[thin space (1/6-em)]:[thin space (1/6-em)]KOH of 1[thin space (1/6-em)]:[thin space (1/6-em)]1 and an activation temperature of 800 °C. It can be observed that the sample with an activation time of one hour shows the best water sorption behavior in terms of hydrophilicity. The effect can be compared with the influence of the impregnation ratio: longer as well as shorter activation times do not lead to better sorption behavior within the operating window. Rather, there is an optimum value with respect to both impregnation ratio and time.

Fig. 9 depicts the water sorption isotherms of all the samples used for the TSA test as well as the commercial activated carbons. For the temperature swings investigated during the TSA experiments, the equivalent relative pressure can be estimated for different adsorbent temperatures as P/Psat = P(Te)/Psat(Tads), where P is the saturation pressure of water in the system given by the evaporator temperature Te and Psat is the saturation pressure of water at the adsorbent temperature Tads.


image file: c6ra00548a-f9.tif
Fig. 9 Water sorption isotherm of the samples used for TSA testing and of commercial activated carbons.

Based on the adsorption isotherms in Fig. 9, the highest amount of water cycled in the temperature step 90 °C → 50 °C is expected from the silica gel. Within this step, the water uptake of the silica gel is estimated at 10.4% (Table 5). For the temperature step 60 °C → 30 °C, sample A-p900-1:1-KOH-1h is expected to perform the best based on the water sorption capacity of 30.1% within this step. It is worth noting that the monolith A-p900-1:1-KOH-1h has a higher water sorption capacity than commercial carbon powders at relative pressure below 0.6, which might be due to the higher heteroatom content of the monolith. PULSORB PWA is produced from bituminous coal and has a reported surface area of ca. 900 m2 g−1 whereas PULSORB 208CP is made from coconut char and has a reported specific surface area of ca. 1200 m2 g−1.

Table 5 Amount of adsorbed water from 0.033 → 0.186 P/Psat and 0.115 → 0.542 P/Psat
Sample Temperature step 90 °C → 50 °C Temperature step 60 °C → 30 °C
A-p900-1:1-KOH-1h 4.1 wt% 30.1 wt%
A-p900 3.3 wt% 13.8 wt%
Reference silica gel 10.4 wt% 21.9 wt%
BPC 1993 1.0 wt% 17.9 wt%
PULSORB 208CP 2.0 wt% 21.2 wt%


Dynamic heat transport and sorption properties

The thermal conductivity κ can be calculated by κ(T) = ρ(T)α(T)Cp(T) where ρ is the density, α the thermal diffusivity and Cp the heat capacity. The sample densities were determined from the mass and geometry of the disks prepared for the LFA measurements and were assumed to be independent of temperature, while α and Cp were determined by LFA.

The effect of the pyrolysis temperature on the thermal diffusivity and conductivity is shown in Table 6. Due to the change of α and Cp, the thermal conductivity was found to increase steadily from 0.057 W (m−1 K−1) for pyrolysis at 600 °C to 0.263 W (m−1 K−1) for pyrolysis at 1100 °C. The loss of heteroatoms O and N with increasing pyrolysis temperature results in a decrease of the average molar mass of the remaining atoms Mmol,av. Therefore, an increase of Cp might be understood as a loss of heavier elements within the limits of the Dulong–Petit law Cp = 3R/Mmol,av, whereas R is the gas constant.

Table 6 Thermal diffusivity and heat capacity measured by LFA
Sample Density ρ [g cm−3] Thermal diffusivity α [mm2 s−1] Heat capacity Cp [J g−1 K−1] Thermal conductivity κ [W (m−1 K−1)]
A-p600 0.523 0.248 ± 0.012 0.44 ± 0.02 0.057 ± 0.006
A-p700 0.576 0.294 ± 0.015 0.44 ± 0.02 0.075 ± 0.007
A-p800 0.537 0.418 ± 0.021 0.57 ± 0.03 0.128 ± 0.012
A-p900 0.579 0.371 ± 0.019 0.60 ± 0.03 0.129 ± 0.013
A-p1000 0.514 0.541 ± 0.027 0.69 ± 0.03 0.191 ± 0.019
A-p1100 0.512 0.764 ± 0.0038 0.67 ± 0.03 0.263 ± 0.026
A-p900-1:1-KOH-1h 0.438 0.585 ± 0.029 0.63 ± 0.03 0.161 ± 0.016


The increase in thermal diffusivity with increasing pyrolysis temperature might be attributed to an increase of the mean free path of the phonons. This might be on one hand due to a decrease of boundary scattering connected to the growth of the ordered domain size with temperature as characterized by XRD (Table 3) and on the other hand due to the loss of heteroatoms connected to a reduction of point defect scattering.

Although the density decreases with the KOH activation at 800 °C, the thermal conductivity can be increased with respect to sample A-p900. This is caused by the thermal diffusivity which is increased by 60% through chemical activation.

The evolution of the specific cooling power (SCP) as a function of the time at the temperature step 90 °C → 50 °C is illustrated in Fig. 10a. Sample A-p900 and A-p900-1:1-KOH-1h show a lower SCP over the whole period than silica gel. The sample A-p900-1:1-KOH-1h shows a lower maximal SCP (192 W kg−1) compared to silica gel (255 W kg−1), which is in agreement with the smaller sorption capacity of the former.


image file: c6ra00548a-f10.tif
Fig. 10 Specific cooling power per unit adsorbent mass at temperature steps of (a) 90 °C → 50 °C and (b) 60 °C → 30 °C. The temperature step was initiated after 60 seconds.

Fig. 10b illustrates the time-dependent behavior of the SCP at the temperature step 60 °C → 30 °C. The SCP of sample A-p900-1:1-KOH-1h exhibits an improvement over the maximal SCP of silica gel (389 W kg−1 compared to 240 W kg−1), which can be attributed to a combination of enhanced water cycling capacity in this operating window (Fig. 9) and improved thermal transport properties described below. Former studies using the same silica gel and similar bead size37 found a maximum specific cooling power of 520 W kg−1 for a temperature step from 50 °C to 30 °C and a water vapor pressure of 8.8 mbar, when using four adsorbent layers. The SCP is slightly higher compared with the present data which might be due to different fin spacing. It can be concluded that KOH activation results in adsorbents with higher water cycling capacity than silica gel for low-grade heat utilization in adsorption cooling. However, obtaining the final carbon materials is still time consuming due to the separation of the pyrolysis and KOH activation processes. Therefore, additional work is necessary to facilitate industrial production of such carbon monoliths such as thermophysical activation with CO2.

The normalized temperature change of the adsorbent during the thermal swing adsorption process was determined by infrared thermography. The intensity of the emitted radiation was normalized according to In = (ItImin)/(ImaxImin) where In is the normalized intensity, It the intensity at time t, Imin the minimal measured intensity and Imax the maximal measured intensity during one temperature step. The normalized intensity is related to the temperature of the sample according to InεσT4, where ε is the emissivity of the sample, T is the sample temperature and σ is the Stefan–Boltzmann constant. A comparison of the normalized temperature change of the three samples during adsorption is shown in Fig. 11. It was measured at the center point of each sample. During both temperature steps, it takes longer time for the silica gel to reach thermal equilibrium than for the carbon monolith. This is attributed to the monolithic structure of the carbon which eliminates thermal interfaces and provides a continuous thermal conduction path. During the temperature step 90 °C → 50 °C, the sample A-p900-1:1-KOH-1h shows the fastest change in temperature. This result agrees with the LFA measurements: the thermal conductivity of A-p900-1:1-KOH-1h is higher compared to A-p900. Overall, it can be concluded that monolithic carbons produced by pyrolysis of RMF resin in the present work have superior thermal transport properties compared to commercial silica gel in the investigated adsorption cooling scenarios.


image file: c6ra00548a-f11.tif
Fig. 11 Transient thermal response of adsorbents for (a) 90 → 50 °C and (b) 60 → 30 °C temperature steps during TSA testing including infrared thermography images (inserts).

Conclusions

Chemically and mechanically stable, monolithic RMF resins can be synthesized in two days. Carbon monoliths with high water sorption capacity can be obtained by pyrolysis and KOH activation (KOH impregnation mass ratio of 1[thin space (1/6-em)]:[thin space (1/6-em)]1, activation temperature 800 °C, activation duration 1 hour) resulting in a BET surface area greater than 900 m2 g−1.

The water cycling capacity of KOH activated RMF carbons was superior to that of the reference silica gel from 0.115 → 0.542 P/Psat (30.1% compared to 21.9%). The activated carbon showed a maximal SCP of 389 W kg−1 at a temperature step 60 °C → 30 °C compared to silica gel which had a maximal SCP of 240 W kg−1 under the same conditions. This improvement can be attributed to a combination of enhanced water cycling capacity and improved heat and mass transport properties. Based on our findings, resin derived carbons must be marked as highly efficient sorbent materials for AHP applications. In particular, the ability to produce monolithic materials with high and controllable porosity is of critical importance. The control of the porosity through RMF synthesis parameter variation will be the focus of a future publication.

Acknowledgements

L. H. thanks Empa Dübendorf and IBM Research for hosting his Master thesis. The authors acknowledge the support of the Swiss National Science Foundation: National Research Programme (NRP70 under grant number 154008). The authors would like to thank Dr Bruno Michel and Dr Sarmenio Saliba of IBM Research, Prof. Markus Niederberger of ETH Zürich and Dr Rudder Wu of NIMS for technical discussions and support. Furthermore the following colleagues are acknowledged: Hans-Jürgen Schindler for the access to the tube furnace and Samuel Mühlemann and Dr Tzu-Wen Huang for discussions. The authors are also grateful to Dr Ulrich Müller (XPS), Dr Yadira Arroyo (TEM) and Dr Santhosh Matam (Raman) of Empa Dübendorf as well as Niklaus Kränzlin, Ofer Hirsch and Mario Baertsch (XRD) of ETH Zürich for their assistance with materials characterization. Chemviron Carbon is specially acknowledged for providing activated carbon powder samples. Finally, the authors would like to thank Elisabeth Michel of Empa St. Gallen for TGA-MS-IR measurements.

References

  1. R. E. Critoph and Y. Zhong, Proc. Inst. Mech. Eng., Part E, 2005, 219, 285–300 CrossRef.
  2. S. G. Wang, R. Z. Wang and X. R. Li, Renew. Energy, 2005, 30, 1425–1441 CrossRef CAS.
  3. R. E. Critoph and S. J. Metcalf, Appl. Therm. Eng., 2004, 24, 661–678 CrossRef CAS.
  4. Z. Tamainot-Telto, S. J. Metcalf, R. E. Critoph, Y. Zhong and R. Thorpe, Int. J. Refrig., 2009, 32, 1212–1229 CrossRef CAS.
  5. L. W. Wang, S. J. Metcalf, R. E. Critoph, R. Thorpe and Z. Tamainot-Telto, Carbon, 2012, 50, 977–986 CrossRef CAS.
  6. Z. Tamainot-Telto, S. J. Metcalf and R. E. Critoph, Int. J. Refrig., 2009, 32, 727–733 CrossRef.
  7. R. W. Pekala, C. T. Alviso, F. M. Kong and S. S. Hulsey, J. Non-Cryst. Solids, 1992, 145, 90–98 CrossRef CAS.
  8. M. H. Nguyen and L. H. Dao, J. Non-Cryst. Solids, 1998, 225, 51–57 CrossRef CAS.
  9. W. Zhao, H. Gao and M. Fan, RSC Adv., 2015, 5, 104936–104942 RSC.
  10. Y. Yamashita and K. Ouchi, Carbon, 1982, 20, 41–45 CrossRef CAS.
  11. A. A. Askalany, M. Salem, I. M. Ismail, A. H. H. Ali and M. G. Morsy, Renewable Sustainable Energy Rev., 2012, 16, 493–500 CrossRef CAS.
  12. S. Shimooka, M. Yamazaki, T. Takewaki, E. Akashige, F. Ikehata, H. Kakiuchi, F. Watanabe, M. Kubota and H. Matsuda, Kagaku Kogaku Ronbunshu, 2006, 32, 528–534 CrossRef CAS.
  13. S. Shimooka, M. Yamazaki, T. Takewaki, E. Akashige, F. Ikehata, H. Kakiuchi, M. Kubota and H. Matsuda, in Proceedings of International Symposium on EcoTopia Science 2007, ISETS07, 2007, vol. 07, pp. 174–177 Search PubMed.
  14. J. Kobayashi, T. Imamura, M. Ichikawa, M. Kubota, F. Watanabe, N. Kobayashi and M. Hasatani, Kagaku kogaku Ronbunshu, 2006, 32, 186–189 CrossRef CAS.
  15. B. Crittenden, A. Patton, C. Jouin, S. Perera, S. Tennison and J. A. B. Echevarria, Adsorption, 2005, 11, 537–541 CrossRef.
  16. R. W. Pekala, J. Mater. Sci., 1989, 24, 3221–3227 CrossRef CAS.
  17. T. Otowa, R. Tanibata and M. Itoh, Gas Sep. Purif., 1993, 7, 241–245 CrossRef CAS.
  18. B. C. Lippens and J. H. de Boer, J. Catal., 1965, 4, 319–323 CrossRef CAS.
  19. S. Brunauer, P. H. Emmett and E. Teller, J. Am. Chem. Soc., 1938, 60, 309–319 CrossRef CAS.
  20. P. Ruch, S. Saliba, C.-L. Ong, Y. Al-Shehri, A. Al-Rihaili, A. Al-Mogbel and B. Michel, in Proceedings of the 11th IEA Heat Pump Conference, Montréal (Québec) Canada, 2014 Search PubMed.
  21. M. Rubiralta, E. Giralt and A. Diez, Studies in Organic Chemistry, Elsevier publishing, 1991, vol 43, pp. 135–171 Search PubMed.
  22. C. Devallencourt, J. M. Saiter, A. Fafet and E. Ubrich, Thermochim. Acta, 1995, 259, 143–151 CrossRef CAS.
  23. L. Costa and G. Camino, J. Therm. Anal., 1988, 34, 423–429 CrossRef CAS.
  24. Y. Wu, S. Fang and Y. Jiang, J. Mater. Chem., 1998, 8, 2223–2227 RSC.
  25. S. Ranganathan, R. McCreery, S. M. Majji and M. Madou, J. Electrochem. Soc., 2000, 147, 277 CrossRef CAS.
  26. C. Moreno-Castilla, F. Carrasco-Marín, M. V. López-Ramón and M. A. Alvarez-Merino, Carbon, 2001, 39, 1415–1420 CrossRef CAS.
  27. J. Yu, M. Guo, F. Muhammad, A. Wang, G. Yu, H. Ma and G. Zhu, Microporous Mesoporous Mater., 2014, 190, 117–127 CrossRef CAS.
  28. J. Wei, D. Zhou, Z. Sun, Y. Deng, Y. Xia and D. Zhao, Adv. Funct. Mater., 2013, 23, 2322–2328 CrossRef CAS.
  29. H. F. Gorgulho, F. Gonçalves, M. F. R. Pereira and J. L. Figueiredo, Carbon, 2009, 47, 2032–2039 CrossRef CAS.
  30. Z. Wu, P. A. Webley and D. Zhao, J. Mater. Chem., 2012, 22, 11379 RSC.
  31. J. R. Pels, F. Kapteijn, J. A. Moulijn, Q. Zhu and K. M. Thomas, Carbon, 1995, 33, 1641–1653 CrossRef CAS.
  32. S. R. Kelemen, M. L. Gorbaty and P. J. Kwiatek, Energy Fuels, 1994, 8, 896–906 CrossRef CAS.
  33. T.-H. Ko, W.-S. Kuo and Y.-H. Chang, Polym. Compos., 2000, 21, 745–750 CrossRef CAS.
  34. Z. Lausevic and S. Marinkovic, Carbon, 1985, 24, 575–580 CrossRef.
  35. H. Marsh, Activated Carbon, Elsevier Science Ltd, Oxford, 2006 Search PubMed.
  36. L. Wadsö, A. Anderberg, I. Åslund and O. Söderman, Eur. J. Pharm. Biopharm., 2009, 72, 99–104 CrossRef PubMed.
  37. Y. I. Aristov, I. S. Glaznev and I. S. Girnik, Energy, 2012, 46, 484–492 CrossRef CAS.

Footnote

Electronic supplementary information (ESI) available: Curing behavior of the RMF resin, thermal gravimetric analysis measurement combined with mass spectroscopy and infrared spectroscopy (TGA-MS-IR) of the RMF resin and Raman spectra of pyrolyzed carbons. See DOI: 10.1039/c6ra00548a

This journal is © The Royal Society of Chemistry 2016
Click here to see how this site uses Cookies. View our privacy policy here.