Preparation of graphene oxide by dry planetary ball milling process from natural graphite

Pranita Dasha, Tapan Dasha, Tapan Kumar Routb, Ashok Kumar Sahua, Surendra Kumar Biswal*a and Barada Kanta Mishraa
aCSIR-Institute of Minerals and Materials Technology, Bhubaneswar-751013, Odisha, India. E-mail: skbiswal61@gmail.com; Tel: +91-9437860089
bTata Steel Ltd, Jajpur-755026, Odisha, India

Received 11th December 2015 , Accepted 18th January 2016

First published on 21st January 2016


Abstract

Graphene oxides (GO) with different degrees of oxidation have been prepared by an in-house designed horizontal high energy planetary ball milling process. The prepared graphene oxides have been studied by X-ray diffraction (XRD), field emission scanning electron microscopy (FESEM), transmission electron microscopy (TEM) with selected area electron diffraction (SAED), high resolution transmission electron microscopy (HRTEM), X-ray photoelectron spectroscopy (XPS), micro Raman spectroscopy, Fourier transform infrared (FTIR) spectra, Brunauer–Emmett–Teller (BET) test and thermogravimetric analysis (TGA). XPS study shows an increasing trend of atomic concentration ratio of O/C with increasing ball milling time duration from 2 to 24 h of high purity graphite sample (FEED). This result is attributed to the formation of more oxidation in the graphite sample, produced due to the increasing time duration of milling. From micro Raman analysis it is also noted that ID/IG ratio increases with increasing milling time of FEED, which further supported the preparation of graphene oxide. In this study the graphene oxide prepared by 16 h of milling may be considered as the optimized sample as far as the degree of oxidation, time and energy consumption factors are concerned.

1. Introduction

Graphene oxide (GO) was reported for the first time in 1840 by Schafhaeutl1 and in 1859 by Brodie.2 The synthesis methods and chemical structures were systematically studied and reviewed by Dreyer et al., and Compton and Nguyen.3,4 GO is mostly prepared through a chemical oxidation process proposed by Hummers and Offeman in 1958.5 GO sheets have been attractive for many applications directly such as polymer composites,6 corrosion resistance coatings,7,8 anti-bacterial coatings,9,10 energy related materials, and paper-like materials and also have shown potential as a possible intermediate for the processing of graphene.11–14 It is known that graphene covers large high end applications such as electronics and sensors, memory storage, flexible displays, and solar cells due to outstanding physical, mechanical, thermal, electrical, optical and chemical properties that depend on the quality of GO production.15–18 Studies have been carried out worldwide for production of graphene oxide in different ways, broadly separated into (i) chemical intercalation methods (chemical oxidation), (ii) growth methods using chemical vapour deposition (CVD), (iii) mechanical exfoliation methods and (iv) unzipping of carbon nanotubes.5,19–30 However each of the above methods has its own advantages as well as limitations depending on its target application. The quality of graphene sheet is decided by the composition, morphology, and production process route of graphene oxides. The structure and properties of graphene oxide are highly influenced by synthesis method and degree of oxidation.31 We typically observed buckled layers, folding and cracking with interspacing of about two times larger than that of graphite. Internal spacing increased more than 1.2 nm with wet-grinding of graphite in the presence of solvents and surfactants.32 During oxidation, composition is largely affected by the degree of oxidation in terms of formation of epoxy rings and edge fictionalization.33 The present processes of production of graphene oxide are not free from impurities coming from the source of solution chemical oxidation (Hummers methods) which involves strong, hazardous oxidizing reagents and a tedious multistep process. Such a process has negative influence on the structural integrity and electron transfer due to defects of edge distortion and atomic displacement (alteration to basal planes). The entire above process route consumes hazardous chemicals, time and energy in order to achieve high yield at large scale. One of the greatest challenges being faced today in commercializing graphene is how to produce high quality material without basal plane distortion, on a large scale at low cost without using additives/chemicals and in a reproducible manner. Further, the use of multistep processes, concentrated acids in oxidization and the harsh chemicals for reduction of graphene oxide (GO) have increased the economic, safety and environmental costs in large scale production of graphene. In order to achieve production of graphene in commercial scale, the process needs to be simplistic and cost effective and environmentally sustainable.

Therefore, the present study explored a low cost, eco-friendly & simple process for preparation of graphene oxide from high pure natural graphite flake powder via a newly developed horizontal high energy dry planetary ball milling route where no acids, catalyst and harsh chemicals are needed.34–36 Dry planetary ball milling process is a single step process which aims to lower the cost of large scale production of graphene oxide in comparison to the above discussed conventional processes. As the present process does not involve any chemical reagents, the chances of presence of impurities in GO products are very less, which ultimately upgrade the quality of the product. This innovative dry milling single step process of producing graphene oxide is successfully employed for the first time. The details about the planetary ball milling process are presented in Section 2.2. The systematic effort has been taken to evaluate the micro structural, spectroscopic and physical properties of prepared graphene oxide samples by using various advanced characterization techniques such as X-ray diffraction (XRD), field emission scanning electron microscopy (FESEM), transmission electron microscopy (TEM) with selected area electron diffraction (SAED), high resolution transmission electron microscopy (HRTEM), X-ray photoelectron spectroscopy (XPS), micro Raman, Fourier transform infrared (FTIR), Brunauer–Emmett–Teller (BET) and thermogravimetric analysis (TGA).

2. Experimental

2.1. Material: preparation of high purity graphite

The natural graphite is produced by beneficiation process from low grade graphite ore using flotation technique. Depending on the ore characteristics, the carbon content in graphite concentrate varies from 70–96 percentages. The carbon content more than 96% is not achieved due to entrainment of ultrafine gangue particles presence in the concentrate, coating of graphite layer on the gangue particles during ore grinding and also presence of locked particles. Hence further up gradation is done by chemical leaching followed by conventional flotation process. The graphite was collected from one of the graphite beneficiation plant in Odisha, India. It contains around 90% carbon and it is also flaky particles. Under microscope, it has been observed that lot of locked particles are present due to efficient of beneficiation process. Hence it was further ground and floated to enrich the carbon value up to 96–97 percentages. Then it was treated with sodium hydroxide with particular concentrate and neutralized by dilute hydrochloric acid.37 During the leaching the ultrafine gangue particles mostly silicate minerals go to aqueous phase in form of sodium silicate. The graphite layer coating comes out from the gangue minerals. The locked particle either liberates as well as behaves hydrophilic particles after treatment. The trace elements presences of like calcium, magnesium and iron phase minerals dissolve during acid washing. Finally the leaching product is again floated to reject gangue particles and locked particles. As a result the carbon percentage could be improved to 99.99% purity of graphite particles.

2.2. Horizontal high energy planetary ball milling process

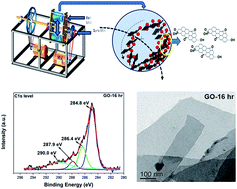
High pure graphite (99.99%) sample (denoted as FEED) was taken for planetary ball milling. Fig. 1 shows the schematic design of planetary ball mill. The planetary ball mill was designed to generate both impact and shear forces to the particles. The planetary ball mill overcomes the limitation of the gravitational field and supplying strong acceleration field. The dual-drive planetary ball mill consists of a gyratory shaft (580 mm) and two cylindrical steel jars of diameter 200 mm each, both are rotated simultaneously and separately at a speed of 340 rpm and 152 rpm respectively. The rotation of both jars and the shaft makes the balls to move strongly and violently, leading to large impact energy of balls that improves the grinding kinetics and results ultra fine comminution.38 This mill is powered by two motors. One is used to rotate the shaft and another drives both jars. The rotating speed of the both motors can be varied independently and continuously by a frequency controller. With a graphite-to-ball charge ratio of 1[thin space (1/6-em)]:[thin space (1/6-em)]7 is fed to the planetary ball mill. The balls are harden steel balls (7 and 5 mm in diameter) were put into a hardened steel jar. The planetary ball mill was designed in such a manner that at a time two jar will fixed to the machine. The force balance is very important factor in the grinding time. That's why it is also called dual drive planetary ball mill. The two jars are placed inside a glove bag and fed with the samples to ball ratio and sealed without any solvents, additives and chemicals. The milling of the high purity graphite samples was done between 2 and 24 h. Finally the milled samples were cooled down and unloaded in air, and then taken for various characterizations.
image file: c5ra26491j-f1.tif
Fig. 1 Schematic diagram: preparation of graphene oxide in a laboratory designed ball mill.

2.3. Calculation of balls and graphite charge into the ball mill

The total volume of each jar is about 4.2 liters where 15% volume is occupied by balls; hence total volume occupied by balls is 0.63 liters. Thus the mass of the balls in the mill was 4.9 kg considering ball density 7.8 × 10³ kg m−3. The mass of the graphite charged to the mill was approximately 0.7 kg keeping balls to graphite mass ratio 7[thin space (1/6-em)]:[thin space (1/6-em)]1.

2.4. Characterization of high purity graphite sample and its ball milling products

Evaluation of the properties of the high purity graphite sample and its ball milling products (milling of samples was done between 2 and 24 h) were carried out by employing various advanced characterization techniques. XRD characterization of the samples was done by using PANalyticalX'Pert Pro diffractometer equipped with Cu Kα radiation (λ = 0.15406 nm). The microstructures of samples were observed by FESEM using back scattered electron mode (model: ZEISS SUPRA 55), TEM (model: TECNAI G2 (200 kV), FEI (Netherland)) and HRTEM (model: JEOL 2010 (UHR)) of 200 keV at 0.143 nm (lattice) and 0.194 nm (pp) resolution using LaB6 as electron source. TEM-specimens of ball milled GO products were prepared by ultrasonicating the samples in ethanol medium and loading one drop of the suspension liquid on to a carbon coated copper grid of 2 mm diameter followed by drying under IR lamp. But for preparing TEM-specimen of high purity graphite sample, first of all initial size of particles i.e. 150 μm was reduced below 0.2 μm by grinding the sample using hand mortar. The SAED patterns of the samples were studied by the facility available in the TEM instrument. Micro Raman spectra were recorded by employing a dispersive type Renishaw invia Reflex (UK) spectrometer with a spectral resolution of 1 cm−1 (514 nm line of an Ar+ ion laser). XPS measurement of the samples was carried out by employing the model S/N-10001 (Project no. 251, Prevac, Poland) with a VG Scienta-R3000 hemispherical energy analyzer. Spectra were recorded using Al Kα ( = 1486.6 eV) radiation as the X-ray source. Instrument base pressure of 6 × 10⁻¹⁰ mbar was maintained during data acquisition. The spectra were analyzed using casa XPS software (attached to XPS system) and following the literature. The high-resolution spectra were de-convoluted using origin 8.5 software (Gaussian–Lorentzian fitted) to find and assign the different binding energy (B.E.) states in a specific region. Specific surface area was determined by BET method (model: ASAP 2020, micrometrics, USA) by N2 adsorption–desorption technique. FTIR spectra were recorded in the range 400–4000 cm−1 by using Perkin Elmer spectrophotometer (model: Spectrum Gx). TGA analysis of the samples was carried out using model Thermax 700, Thermo Fishers Scientific Private India Ltd., Germany. TGA was performed under inert gas (argon) atmosphere heating and the rate of heating was maintained at 10° min−1. The analysis was done from 25 to 1000 °C.

3. Results and discussion

3.1. Preparation of GO

Graphite sample of particle size 150 micron was charged to the ball mill for grinding using variable diameter of balls to produce graphene oxide (GO), where graphite-to-ball ratio was kept 1[thin space (1/6-em)]:[thin space (1/6-em)]7. The mill runs at a critical speed of 65% where a single ball is allowed to high impact by following cascading fall under a strong acceleration field. This motion is characterized by collisions with the breakage of particles induced by impact and/or frictional force as shown in the schematic diagram in Fig. 1. The frictional force is induced during grinding action by relative motion between the media and balls. Both impact force and frictional force has intensified to shear the graphite flake layers at a higher rate to the smallest layer possible, this is indicated by the significant size reduction and high surface area of the analyzed graphene oxide.39–41 The mechanical energy provided by the mill is consumed by the media and balls and which has been used for reactant activation to reach a critical state as per equation 1/t α NR3, where t = ignition time; NR = revolution speed. The specific energy increases with NR due to higher number of collisions.42,43 We varied milling time from 2 h to 24 h at a constant frequency of 22.5 Hz, and it was observed that considerable amount of oxidized graphite products (dark black in color) formed after 8 h of milling. The milling samples are denoted as GO-2 h, GO-4 h, GO-8 h, GO-12 h, GO-16 h, GO-24 h following to their respective milling time. Specific surface area determined by BET method (Table 1) of the ball milled samples was found to increase with increasing milling time from 2 h to 24 h. In Table 1 a sharp increasing of specific surface area value from 36.9 m2 g−1 to 174.0 m2 g−1 is marked for GO samples prepared by 8 h and 12 h of milling respectively.
Table 1 Specific surface area (by BET method) and average crystallite size (from micro Raman analysis) determined for high purity graphite (FEED) and ball milled GO samples
Sample ID Specific surface area (m2 g−1) Average crystallite size (nm)
FEED 0.56
GO-2 h 4.82 83.64
GO-4 h 8.00 83.64
GO-8 h 36.9 41.82
GO-12 h 174.00 18.59
GO-16 h 182.33 16.08
GO-24 h 188.25 18.59


This result may be due to more exfoliation produced in FEED sample because of increasing of milling time. No further significant increment in specific surface area is observed for samples prepared beyond 12 h of milling.

3.2. XRD study

X-ray diffraction (XRD) study was carried out to observe the crystalline nature, phase purity and find the signature of GO formation (with interlayer spacing) in the ball milled high purity graphite samples. Phases and planes were identified by comparing the observed d-values with the d-values of standard powder diffraction data file, C (graphite-2H): 00-041-1487 supplied in JCPDS-ICDD PDF-2 (2004). Fig. 2 shows the XRD patterns of high purity graphite (FEED) and ball milled high purity graphite samples in 2θ range of 7.5–80°. High purity graphite exhibited a typical strong (002) peak at 2θ = 26.6° with an interlayer d-spacing of 0.335 nm. Similar type of results was reported in literature.44 The XRD patterns of all samples clearly show that with increasing milling time of graphite, the intensity of the peak at 2θ = 26.6° starts decreasing suggesting a high degree of exfoliation produced in the ball milled samples. The high purity graphite samples milled for 12 h (GO-12 h), 16 h (GO-16 h) and 24 h (GO-24 h) show a peak broadening effect in their XRD patterns. The interlayer d-spacing for the peak at around 2θ = 26.6° of the ball milled samples was found to vary between 0.339–0.472 nm. We could also observe the appearance of a new peak (Fig. 3) at a lower diffracting angle at around 2θ = 12.0–12.3°, corresponding to the interlayer d-spacing: 0.71–0.78 nm, starts to grow with increasing milling time duration of high purity graphite sample. The peak can be attributed to the diffraction pattern of GO. The relatively larger d-spacing of milling samples than that of high purity graphite is due to the lattice expansion (occurs in AB stacking order of graphite lattice) and intercalation of oxygen molecules because of oxidation and the formation of oxygen-containing functional groups (such as hydroxyl, epoxy and carboxyl) attached to the graphite lattice.45,46 The increasing intensity of peak at around 2θ = 12.0–12.3° further indicates the increasing amount of oxidation due to increasing time duration of the milling of the sample. The peak of 2θ ∼ 12.3° (for GO) was broadened for sample prepared by 24 h of milling. The sample was initially supposed to be amorphous in nature, but we observed its crystalline structure in TEM with well order hexagonal arrangements of atoms (as seen from its SAED pattern).
image file: c5ra26491j-f2.tif
Fig. 2 XRD patterns observed for high purity graphite (FEED) and ball milled samples.

image file: c5ra26491j-f3.tif
Fig. 3 Comparison of XRD patterns observed for high purity graphite (FEED) and ball milled samples; ball milled samples depicting a peak due to GO.

Further evidence of the formation of oxygen-containing functional groups and increasing amount of oxidation in the ball milled high purity graphite samples were observed from their XPS measurements (infra). The lattice expansion or basal plane alteration of high purity graphite sample during the milling was also confirmed from their TEM, HRTEM and micro Raman studies (infra). The exfoliation and lattice expansion in the ball milled high purity graphite samples were realized through the impact/shearing force (energy) developed from this planetary ball milling route. After 24 h of milling, besides the major peak at around 2θ = 26.6°, some other prominent peaks of C such as C (100), C (101), C (102) and C (004) were emerging and may be relating to other diffraction lines associated with hexagonal graphite (h-graphite).

These three peaks i.e., C (100), C (101) and C (102) were not seen in the XRD patterns of FEED, GO-2 h, GO-4 h, GO-8 h and GO-12 h samples because of their lower intensity in comparison to the major peak of C (002).

3.3. Micro Raman analysis

Raman spectroscopy was employed to study the structure, defect levels and crystalline of the FEED (high purity graphite sample) and ball milled samples. Micro Raman spectra of these samples are presented in Fig. 4. The spectrum of graphite shows G and 2D bands at 1580 and 2725 cm−1 respectively. The former is due to the first-order scattering of the E2g phonon from sp2 carbon (graphite lattice) and latter associates with the strong stacking order of the graphite along the c-axis. The 2D peak is observed at twice of wavelength of D band (1350 cm−1). In literature47–50 it was reported that 2D peak can be observed in graphite sample even though the D peak is absent. The absence of D band in FEED sample51,52 at around 1350 cm−1 leads to the ratio of the D band to G band is zero. This could be explained from structural point of view where the D band intensity depends on the atomic structure at the edge, but it is absent in graphite edges (due to large grain size of graphite, D band associated with edge distortions is negligibly weak).53 The absence of D band indicates that FEED sample is almost defect free and high quality in nature. The intensity ratios of D to G peak i.e. ID/IG for ball milled samples was calculated and presented in Table 2. From Fig. 4 and Table 2 it was observed that the ratio of ID/IG gradually increases with increasing ball-milling time and becomes saturated after 16 h of milling. This result indicates about the increased structural distortion (structural imperfections created by the hydroxyl, carboxyl and epoxide groups on the carbon basal plane) and size reduction (due to mechanical milling) of the in-plane sp2 domain caused due to their processing through ball-milling route. As compared with Raman spectra of FEED, G band in ball milled samples is shifted gradually towards higher wave numbers with increasing ball-milling time. This result can be attributed to increasing degree of oxidation of graphite due to increasing ball-milling time of FEED. The shift in G band and increased its FWHM (full width at half maxima) in the ball milled samples compared with the FEED sample suggests that the presence of sp3 carbon has increased with respect to oxidation level. The D band in ball milled samples was broadened gradually with increasing ball-milling time, which was due to the reduction in size of plane sp2 domains by the creation of defects, vacancies and distortions of the sp2 domains after complete oxidation. In Fig. 4 it is marked that the intensity of the 2D band decreases with increasing ball milling time of FEED and starts broadening (it is not seen in the spectra) after 12 h of milling. The decrease in intensity of the 2D band is due to the breaking of the stacking order of C–C bonding and increasing degree of oxidation reaction. The result can be corroborated with the XPS results (infra), which shows the increasing amount of oxygen functional groups in the ball milled samples with increasing their ball milling time. The important fact noticed from Raman analysis that the 2D peak is not up-shifting with milling time, which is an indication of proper Bernal stacking of the graphene layers54–57 present in the ball milled GO samples. This suggests that though moderately large disorder regimes occur after 12 h of milling (low crystallite size), the C–C bonds are still sp2 kind and crystalline in nature with no significant strain in the bonds. This is evident from the absence of G′ band for all grinding samples at the adjacent to the G band. Therefore, the milled samples thus obtained by grinding were not associated with the strain induced by any surface interactions. This observation is further evident from XRD, XPS and TEM analysis. The planetary ball milling process is not only mechanically cracking graphitic C–C bonds and edge selectively functionalizing graphitic layers, but also delaminating into graphitic nano platelets. This result is further confirmed from the observation of downshifting (from 2725 cm−1 to 2702 cm−1) and broadening of 2D peak.
image file: c5ra26491j-f4.tif
Fig. 4 Comparison of micro Raman spectra of different ball milled samples with high purity graphite sample (FEED).
Table 2 Calculation of ID/IG ratio values from micro Raman spectra of FEED and six ball milled samples
Sample ID D peak, (cm−1) G peak (cm−1) 2D peak (cm−1) ID IG ID/IG
FEED 1580 2725 0 4100 0
GO-2 h 1354 1582 2725 1000 4800 0.2
GO-4 h 1355 1583 2725 900 4450 0.2
GO-8 h 1358 1585 2722 1900 4710 0.4
GO-12 h 1362 1591 2700 3558 3599 0.9
GO-16 h 1364 1596 Broad 2400 2300 1.04
GO-24 h 1364 1596 Broad 1520 1642 0.9


The average crystallite size of the sp2 domains (La (nm)) was calculated for ball milled GO samples by following the equation given by Lucchese et al.52 by relating the ID/IG ratio to the fourth power of laser line wavelength (λl in nm units). This equation can be written as

 
La (nm) = (2.4 × 10⁻¹⁰)λl4(ID/IG)−1 (1)

The calculated La (nm) values for ball milled GO-2 h, GO-4 h, GO-8 h, GO-12 h, GO-16 h and GO-24 h samples are presented in Table 1. The La (nm) values for ball milled samples lies between 83.64 and 16.08 nm. The La (nm) values calculated for six ball milled samples indicate that the average crystallite size decreases with increasing the ball milling time of samples (except GO-24 h sample), which associates the breaking of crystallites with increasing degree of oxidation (resulting in the formation of defects, disorders, sp3 hybridization and changes in crystalline). This result can be corroborated to our XRD and XPS findings such as (i) the decreasing intensity of major peak of C as seen in XRD spectra (Fig. 2) of ball milled samples and (ii) growth of various oxygenated function groups in the ball milled samples as observed in XPS spectra (Fig. 10(a)–(f), infra).

3.4. Morphological characterization and crystallinity analysis by FESEM, TEM, HRTEM and SAED

The field emission scanning electron microscopy (FESEM) was used to see the micro level morphology of the FEED and milled samples as shown in Fig. 5(a)–(d). The FEED sample shows large flaky type morphology (Fig. 5a) with stacking in nature. After milling, the flakes of FEED were found exfoliated into several layers. Similar kind of results is reported elsewhere.14,25 FESEM images of the graphene oxide ball milled samples (Fig. 5(b)–(d)) have well defined and interlinked three dimensional graphene sheets, forming porous networks that resemble loose sponge like structures. In our study 16 h milling sample is seen as the most exfoliated in nature, thereafter crystallite size (16.08 nm determined from Raman analysis) is found very small and becoming unstable due to high surface energy, and got into aggregating. Similar type of morphology is seen from 24 h milling sample. These observations are further supported from TEM and HRTEM studies.
image file: c5ra26491j-f5.tif
Fig. 5 FESEM micrograph of high purity graphite (FEED) and three typical ball milled sample surfaces.

The surface morphology and crystalline nature of the FEED and ball milled GO with different degrees of oxidation was analyzed using TEM, HRTEM and SAED patterns as shown in Fig. 6(a) and (b) and 7(a)–(h). The TEM (Fig. 6a) of FEED sample shows flaky type morphology with stacking of layers. The SAED pattern of FEED sample shows typical ring like patterns indicating the polycrystalline nature of the sample. The TEM images of ball milled GO-8 h, GO-12 h, GO-16 h and GO-24 h samples are presented in Fig. 7(a)–(d) respectively. TEM images of these samples show sheet like folded morphology with different transparencies. The transparent and featureless regions in Fig. 7(c) for GO-16 h sample are likely to be monolayer GO, which tends to scroll at the edges. The dense aggregates regions observed in ball milled GO samples confirmed that thin, continuous, twisted like structures randomly oriented and many thin layers entangled with each other with overlapped oxidized edges. Such type of results was supported by literature done by other workers.58,59 Comparing the TEM images of ball milled GO samples with that of FEED, it is found that grain size of GO samples is considerably decreased after the mechanical (ball milling) treatment. This is probably due to mechanical cracking and/or “smearing” of the graphite layers over the surface of the oxidant particles/compounds. That is also confirmed by the XRD diffraction data i.e. the intensity of (002) peak of the graphite is significantly lowered after the mechanical treatment due to decreasing size of the particles/grains and their cleavage.


image file: c5ra26491j-f6.tif
Fig. 6 TEM and SAED patterns of FEED (high purity graphite).

image file: c5ra26491j-f7.tif
Fig. 7 TEM, HRTEM and SAED patterns of ball milled samples: a, b, c & d are TEM images of 8 h, 12 h, 16 h and 24 h ball milled GO samples; e, f, g & h are HRTEM images with their corresponding selected area electron diffraction patterns (SAED) of 8 h, 12 h, 16 h and 24 h ball milled GO samples.

HRTEM images of the ball milled samples are shown in Fig. 7(e)–(h). HRTEM results of the ball milled samples exhibit multi layers (monolayer or few layers) as a result of exfoliation process (due to planetary ball milling). Further, the HRTEM micrographs for 8 h, 12 h, 16 h and 24 h milling samples clearly show the lattice fringes of graphene oxide. This provides additional information about the increased interplanar distance d002 for ball milled GO samples as compared to feed sample.

The SAED patterns of typical ball milled samples like GO-8 h, GO-12 h, GO-16 h, GO-24 h are shown in the inset of their corresponding HRTEM images. It is observed that the SAED pattern of all the samples possesses clear diffraction spots with six fold symmetry which is consistent with the structure of hexagonal lattice. These observations indicated that the graphite AB stacking order is preserved in the lattice even after higher degree of oxidation caused due to higher milling time. From the SAED patterns it is also confirmed that the oxidation process in the planetary ball milling did not alter the basal planes and the overall size of the unit cell in GO. The consecutive diffraction dots observed in 8 h, 12 h, 16 h and 24 h ball milled GO samples might be due to aligned shape of hexagonal rings of unidirectional six-fold symmetry, formed because of mechanical exfoliation. The bright diffraction spots along with tiny spots may be due to crumpled local regions in graphene oxides. Our finding is well matched to the results reported in literature.28 Hence, we may conclude here that our GO samples prepared by planetary ball milling technique are free from lattice distortion and crystalline in nature.

3.5. XPS study

XPS measurements of GO samples were performed to gain information about their composition, the degree of oxidation and the kind of oxygen species present. XPS survey spectra, de-convoluted high resolution C1s core level spectra for FEED and de-convoluted high resolution C1s core level spectra for six ball milled GO samples are presented in Fig. 8, 9 and 10(a)–(f) respectively. Survey spectra show C1s and O1s peaks in all the samples. The presence of minor peak of O1s in the FEED sample is due to physically absorbed oxygen. Table 3 shows the atomic concentration of O1s, C1s and their ratios for all samples. From the table it is marked that FEED sample contains a small proportion of oxygen concentration i.e. 1.12%. But after its ball milling, it is observed that oxygen concentration is increased up to 14.32% along with the reduction of carbon content. From Table 3 it is clearly observed that the ratio (%) of oxygen to carbon concentration increases from 1.13% to 16.71% as the milling time of FEED increases from 2 h to 24 h. This result indicates that the ball milling technique exfoliated the FEED material and introduced a large amount of oxygen functional groups on the surface of material. This is undoubtedly due to the existence of significant amounts of hydroxyl, epoxyl, carbonyl and carboxyl functional groups attached onto the basal or edge plane. But from the Table 3 it also marked that atomic concentration of O1s/C1s is not significantly increased beyond 16 h of milling of FEED. Hence, in the present study GO sample prepared by 16 h of milling (sample ID: GO-16 h) may be considered as the optimized GO sample.
image file: c5ra26491j-f8.tif
Fig. 8 XPS survey spectra of FEED and six ball milled GO samples.

image file: c5ra26491j-f9.tif
Fig. 9 De-convoluted C1s core level XPS spectra for high purity graphite sample (FEED).

image file: c5ra26491j-f10.tif
Fig. 10 De-convoluted C1s core level XPS spectra for six ball milled GO samples: (a) GO-2 h, (b) GO-4 h, (c) GO-8 h, (d) GO-12 h, (e) GO-16 h and (f) GO-24 h.
Table 3 The values of atomic concentrations of O1s, C1s and their ratios obtained by XPS survey spectra
Sample ID Elements (in at%)
O1s C1s O/C ratio
FEED 1.12 98.88 1.13
GO-2 h 3.85 96.15 4.00
GO-4 h 5.04 94.96 5.31
GO-8 h 5.46 94.54 5.78
GO-12 h 6.64 93.36 7.11
GO-16 h 12.50 87.50 14.28
GO-24 h 14.32 85.68 16.71


Inorder to identify the different oxygen functional groups that formed on the carbon surface (on basal or edge plane) during the ball milling process, de-convolution of high resolution C1s core level spectra of our samples were carried out and presented in Fig. 9 and 10(a)–(f). The de-convolution of C1s spectra into different binding energies (B.E.) with their peak assignments are summarized in Table 4. As expected the high purity graphite (FEED) displays (Fig. 9) a prominent peak at B.E. of 284.8 eV from the graphite sp2 carbon. From the Fig. 9, 10(a)–(f) and Table 4 it is observed that oxygen-bonded carbon components of C1s are increased by increasing milling time of FEED sample. The de-convoluted C1s spectra for 12 h, 16 h and 24 h ball milled GO samples exhibited the characteristic peaks of C–C skeleton, hydroxyl (C–OH), epoxyl (C–O–C) and carbonyl/carboxyl (C[double bond, length as m-dash]O/COOH) groups17,45,60 in the B.E. range of 284.6–284.7, 286.3–286.5 eV, 287.7–288.2 and 289.2–290.4 respectively. Hence, from XPS study we may be concluded that our employed planetary ball mill process is an efficient process for preparation of GO without adding any chemical reagents.

Table 4 XPS analysis summary of binding energy values observed in the C1s level for the FEED and six ball milled GO samples
Sample ID C1s level with corresponding B.E. (eV) and peak assignment
C–C/C–H C–OH C–O C[double bond, length as m-dash]O/COOH
FEED 284.8 286.0
GO-2 h 284.8 286.1    
GO-4 h 284.8 286.1
GO-8 h 284.7 286.2 287.5
GO-12 h 284.7 286.4 288.2 290.2
GO-16 h 284.6 286.5 288.2 290.4
GO-24 h 284.7 286.3 287.7 289.2


3.6. FTIR characterization

To further understand the structural changes before and after ball milling, we carried out FTIR spectroscopic measurements (shown in Fig. 11). FTIR spectrum of the high purity graphite sample (FEED) shows a weak band at 1624 cm−1, which is characteristic of the vibration mode of C–C stretching in graphite domains. Another relatively stronger peak is observed at 3445 cm−1 due to the physically adsorbed water/moisture on the surface of sample. In the FTIR spectra of ball milled GO samples (from GO-2 h to GO-24 h) following functional groups are identified by referring to literature:59,61–63 827 cm−1 (C–H out-of-plane wagging vibration), 1030 cm−1 (C–O), 1110 cm−1 (C–O epoxide group), 1317 cm−1 (O[double bond, length as m-dash]C–OH), 1361 cm−1 (COO-symmetric stretch skeletal vibrations of oxidized graphitic domains), 1640 cm−1 (resonance peak due to C–C stretching and absorbed hydroxyl groups in GO), 2854 cm−1 (sp3 C–H peak associated with defects), 2925 cm−1 (sp2 C–H peak), 3450 (–OH stretching vibrational mode from COOH and C–OH cm−1). The intensities of the bands associated with oxygen functional groups of ball milled GO samples are found to increase in comparison to that of FEED sample. The high intensity of the main peaks in GO confirmed the presence of a large amount of oxygen functional groups after the oxidation process. Once again these results indicated that GO is efficiently formed during ball-milling process of graphite.
image file: c5ra26491j-f11.tif
Fig. 11 FTIR spectra of FEED and six ball milled GO samples.

3.7. TGA characterization

Thermometric analyses (TGA) for FEED and six ball milled GO samples were conducted and the results are shown in Fig. 12. It could be clearly seen from Fig. 12 that the samples are differed in their degrees of oxidation caused due to their milling behavior. The 2 h, 4 h and 8 h ball milled GO samples display simple linear dependence plots without any significant changes in steps (in comparison to TGA plot for FEED), indicating uniform weight loss (∼22%) due to removal of physically adsorbed oxygen and loosely bonded oxygen functional groups. In contrast, TGA plots for 12 h, 16 h and 24 h milling GO samples show significant changes in peaks. TGA plot for 12 h milling sample remains constant till 500 °C and then the plot sharply dropped to 900 °C indicating a weight loss of more than 87%. This weight loss of sample can be attributed to the decomposition of labile oxygen functional groups (various oxygenated functional groups such as carboxylic, anhydride, lactones groups, etc.).17,63 Whereas, three major weight loss peaks (total weight loss of about 97%) for 16 h ball milled sample are identified at 380 °C, 780 °C and 920 °C. The first weight loss is attributed to the loss of moisture, and the second and third are attributed to the decomposition of GO (removal of more stable oxygenated functional groups such as phenol, carbonyl, quinine, etc.).63,64 TGA plot for 24 h sample is found to be similar as exhibited by 12 h sample. Hence, from the TGA characterizations, it has been found that more and more oxygen functionalities in the GO samples are observed after 12 h of milling of FEED. This results are in good agreement with the formation of GO in ball milled samples, and also with other micro structural observations taken from XRD, XPS, FTIR, Raman and HRTEM.
image file: c5ra26491j-f12.tif
Fig. 12 TGA plots for FEED and six ball milled GO samples.

Therefore, from our experiments and observations (from various advanced characterizations such as XRD, BET, FESEM, TEM, HRTEM, SAED, XPS, micro Raman, FTIR and TGA), it may be concluded that our high energy horizontal planetary ball mill technique adopted in the present work is an single step and eco-friendly process to achieve controllable properties of graphene oxide for the first time.

4. Conclusion

The high energy horizontal planetary ball mill technique was found to efficiently exfoliate the high purity graphite (FEED) directly into graphene oxide with controlled degree of oxidation. Various microstructural and spectroscopic measurements have been carried out to confirm the formation of GO by ball milling process. The XRD studies revealed that the graphatic nature of the FEED material decreased with increasing milling time, whereas the oxidation level of FEED was increased. The interlayer spacing of the prepared ball milled samples was found to be larger (due to more oxygenated functional groups graft between layers of graphite) than that of FEED, which confirmed the formation of GO in the samples. Specific surface area of ball milled GO samples was found to increase (upto 188.25 m2 g−1) with increasing the milling time of FEED. Further, from micro Raman, XPS and FTIR studies it was observed that the degree of oxidation (the oxygen-bonded carbon components) of FEED was increased due to increasing of milling time from 2 h to 24 h. The 12 h, 16 h and 24 h samples show massive oxygenated functional groups attached onto the basal or edge plane such as hydroxyl, epoxyl and carbonyl/carboxyl. In the present work the GO sample prepared by 16 h of milling (sample ID GO-16 h) may be considered as the optimized sample as per the degree of oxidation, time and energy consumption factors are concerned. The morphological studies using FESEM and TEM show a sheet like morphology with exfoliation of grains in all stages of oxidation. The oxygen content increased with milling time without distortion of lattice structure was also confirmed from HRTEM and SAED patterns. Therefore, from the our study it may be concluded that the ball-milling process could be considered as an easy, single step, reproducible and green synthetic approach to produce large scale and low cost GO for various industrial applications ranging from a intermediate for preparing graphene to preparing composites for energy storage devices.

Acknowledgements

Authors are thankful to the management for their support and giving permission to publish this research paper. We are also thankful to all technicians of our laboratory for their help extended for various characterizations of the samples. Thanks to Tata Steel Ltd, India for giving full funding to support this advanced research. We are very much thankful to Prof. P.V. Satyam of Institute of Physics, Bhubaneswar, Odisha for extending HRTEM support for characterizing samples.

References

  1. C. Schafhaeutl, Philos. Mag., 1840, 16(104), 570–590 Search PubMed .
  2. B. C. Brodie, Ann. Chim. Phys., 1860, 59, 466–472 Search PubMed .
  3. D. R. Dreyer, S. Park, C. W. Bielawski and R. S. Ruoff, Chem. Soc. Rev., 2010, 39, 228–240 RSC .
  4. C. O. Compton and S. T. Nguyen, Small, 2010, 6, 711–723 CrossRef PubMed .
  5. W. S. Hummers and R. E. Offeman, J. Am. Chem. Soc., 1958, 80, 1339–1349 CrossRef CAS .
  6. S. Stankovich, D. A. Dmitriy, G. B. H. Dommett, K. M. Kohlhaas, E. J. Zimney, E. A. Stach, R. D. Piner, S. T. Nguyen and R. S. Ruoff, Nature, 2006, 442, 282–286 CrossRef CAS PubMed .
  7. R. V. Dennis, L. T. Viyannalage, V. A. Gaikwad, T. K. Rout and S. Banerjee, Am. Ceram. Soc. Bull., 2012, 92, 18–24 Search PubMed .
  8. J. Rafiee, X. Mi, H. Gullapalli, A. V. Thomas, F. Yavari, Y. Shi, P. M. Ajayan and N. A. Koratkar, Nat. Mater., 2012, 11, 217–222 CrossRef CAS PubMed .
  9. E. Merisko-Liversidge, G. G. Liversidg and R. E. Cooper, Eur. J. Pharm. Sci., 2003, 18, 113–120 CrossRef CAS PubMed .
  10. H. R. Müller, C. Jacobs and O. Kayser, Adv. Drug Delivery Rev., 2001, 47, 3–19 CrossRef .
  11. Z. Bo, X. Shuai, S. Mao, H. Yang, J. Qian, J. Chen, J. Yan and K. Cen, Sci. Rep., 2014, 4, 1–8 Search PubMed .
  12. B. Y. Zhu, S. Murali, W. Cai, X. Li, J. W. Suk, J. R. Potts and R. S. Ruoff, Adv. Mater., 2010, 22, 3906–3924 CrossRef PubMed .
  13. W. Gao, PhD thesis, Rice University, Houston, Texas, 2012 .
  14. C. N. R. Rao, A. K. Sood, K. S. Subrahmanyam and A. Govindaraj, Angew. Chem., Int. Ed., 2009, 48, 7752–7757 CrossRef CAS PubMed .
  15. S. Bae, H. Kim, Y. Lee, X. Xu, J. S. Park, Y. Zheng, J. Balakrishnan, T. Lei, H. K. Kim, B. Ozyilmanz, J. H. Ahn, B. H. Hong and S. Lijima, Nat. Nanotechnol., 2010, 5, 574–578 CrossRef CAS PubMed .
  16. W. Choi, I. Lahiri, R. Seelaboyna and Y. Kang, Crit. Rev. Solid State Mater. Sci., 2010, 35, 52–61 CrossRef CAS .
  17. D. C. Marcano, D. V. Kosynkin, J. M. Berlin, A. Sinitskii, Z. Sun, A. Slesarev, L. B. Alemany, W. Lu and J. M. Tour, ACS Nano, 2010, 4, 4806–4814 CrossRef CAS PubMed .
  18. C. E. Hamilton, J. R. Lomeda, Z. Sun, J. M. Tour and A. R. Barron, Nano Lett., 2009, 9, 3460–3462 CrossRef CAS PubMed .
  19. S. Park and R. S. Ruoff, Nat. Nanotechnol., 2009, 58, 1–8 Search PubMed .
  20. I. Vlassiouk, P. Fulvio, H. Meyer, N. Lavrik, S. Dai, P. Datskos and S. Smirnov, Carbon, 2013, 54, 58–67 CrossRef CAS .
  21. M. Batzill, Surf. Sci. Rep., 2012, 67, 83–115 CrossRef CAS .
  22. A. Nepal, G. P. Singh, B. N. Flanders and C. M. Sorensen, Nanotechnology, 2013, 24, 1–7 CrossRef PubMed .
  23. A. V. Gaikwad, T. K. Rout, D. V. der Plas, D. V. Dennis, S. Banerjee, S. P. Benito and L. Lefferts, Carbon, 2012, 50, 4722–4731 CrossRef CAS .
  24. Z. Sun, Z. Yan, J. Yao, E. Beitler, Y. Zhu and J. M. Tour, Nature, 2010, 468, 549–552 CrossRef CAS PubMed .
  25. K. R. Paton, Nat. Mater., 2014, 13, 624–630 CrossRef CAS PubMed .
  26. J. Coleman and K. Paton, US pat., WO 2014140324A1, 2014 .
  27. Y. Hernandez, M. Lotya, V. Nicolosi, F. M. Blighe, S. De and G. Duesberg, J. Am. Chem. Soc., 2009, 131, 3611–3620 CrossRef PubMed .
  28. I. Y. Jeon, Y. R. Shin, G. J. Sohn, H. J. Choi, S. Y. Bae, J. Mahmood, S. M. Jung, J. M. Seo, M. J. Kim, D. W. Chang, L. Dai and J. B. Baek, Proc. Natl. Acad. Sci. U. S. A., 2012, 109, 5588–5593 CrossRef CAS PubMed .
  29. I. Y. Jeon, H. J. Choi, M. Choi, J. M. Seo, S. M. Jung, M. J. Kim, S. Zhang, L. Zhang, Z. Xia, L. Dai, N. Park and J. B. Baek, Sci. Rep., 2013, 3, 1–7 Search PubMed .
  30. D. V. Kosynkin, A. L. Higginbotham, A. Sinitskii, J. R. Lomeda, A. Dimiev and B. K. Price, Nature, 2009, 458, 872–876 CrossRef CAS PubMed .
  31. K. Krishnamoorthy, M. Veerapandian, K. Yun and S. J. Kim, Carbon, 2013, 53, 38–49 CrossRef CAS .
  32. G. Wang, X. Shen, B. Wang, J. Yao and J. Park, Carbon, 2009, 47, 1359–1364 CrossRef CAS .
  33. H. C. Schniepp, L. J. Luen, M. J. McAllister, H. Sai, M. H. Alonso, D. H. Adamson, R. K. Prudhomme, R. Car, D. A. Saville and I. A. Aksay, J. Phys. Chem. B, 2006, 110, 8535–8539 CrossRef CAS PubMed .
  34. S. Stankovich, R. D. Piner, X. Chen, N. Wu, S. T. Ngugen and R. S. Ruoff, J. Mater. Chem., 2006, 16, 155–158 RSC .
  35. B. K. Mishra, KONA, 1995, 13, 151–158 CrossRef .
  36. A. Kwade, Int. J. Miner. Process., 2004, 74, 93–101 CrossRef .
  37. C. R. Panda, A. K. Rout, R. Mohapatra, S. Mohapatra and S. K. Biswal, Indian Pat., CSIR-IMMT 197530, 2006 .
  38. S. Rosenkranz, S. Breitung-Faes and A. K. Wade, Powder Technol., 2011, 212, 224–230 CrossRef CAS .
  39. R. H. Muller, K. Krause and K. Mader, PCT Patent Application 2001/03670 A1, 2000 .
  40. P. P. Chattopadhyay, I. Mannaa, S. Talapatra and S. K. Pabi, Mater. Chem. Phys., 2001, 68, 85–94 CrossRef CAS .
  41. C. C. Koch, R. W. Cahn, P. Hassan and E. J. Kramer, Materials Science and Technology, VCH, Weinheim, 1991, vol. 15, p. 193 Search PubMed .
  42. M. V. Antisari, A. Montone, N. Jovic, E. Piscopiello, C. Alvani and L. Pilloni, Scr. Mater., 2006, 55, 1047–1050 CrossRef CAS .
  43. L. Takacs, Prog. Mater. Sci., 2002, 47, 355–414 CrossRef CAS .
  44. C. Gomez-navarro, J. C. Meyer, R. S. Sundaram, A. Chuvillin, S. Kurasch and M. Burghard, Nano Lett., 2010, 10, 1144–1148 CrossRef CAS PubMed .
  45. L. Y. Meng and S. J. Park, Bull. Korean Chem. Soc., 2012, 33, 209–214 CrossRef CAS .
  46. K. S. Subramanian, S. R. C. Vivekchand, A. Govindaraj and C. N. R. Rao, J. Mater. Chem., 2008, 18, 1517–1523 RSC .
  47. C. Ferrari and D. M. Basko, Nat. Nanotechnol., 2013, 13, 235–246 CrossRef PubMed .
  48. A. Jorio, E. H. M. Ferreira, L. G. Cançado, C. A. Achete and R. B. Capaz, Phys. Appl., 2011, 439–454 CAS .
  49. L. G. Cancado, A. Jorio, E. H. Martins Ferreira, F. Stavale, C. A. Achete, R. B. Capaz, M. V. O. Moutinho, A. Lombardo, T. S. Kulmala and A. C. Ferrari, Nano Lett., 2011, 11, 3190–3196 CrossRef CAS PubMed .
  50. A. C. Ferrari, Solid State Commun., 2007, 143, 47–57 CrossRef CAS .
  51. F. Tuinstra and J. L. Koenig, J. Chem. Phys., 1970, 53, 1126 CrossRef CAS .
  52. M. M. Lucchese, F. Stavale, E. H. M. Ferreira, C. Vilani, M. V. O. Moutinho and R. B. Capaz, Carbon, 2010, 5, 1592–1597 CrossRef .
  53. L. G. Cançado, M. A. Pimenta, B. R. A. Neves, M. S. S. Dantas and A. Jorio, Phys. Rev. Lett., 2004, 93, 247401 CrossRef PubMed .
  54. Z. S. Wu, W. C. Ren, L. B. Gao, B. L. Liu, C. B. Jiang and H. M. Cheng, Carbon, 2009, 47(2), 493–499 CrossRef CAS .
  55. A. C. Ferrari, J. C. Meyer, V. Scardaci, C. Casiraghi, M. Lazzari, F. Mauri, S. Piscanec, D. Jiang, K. S. Novoselov, S. Roth and A. K. Geim, Phys. Rev. Lett., 2006, 97, 187401 CrossRef CAS PubMed .
  56. L. M. Malard, M. A. Pimenta, G. Dresselhaus and M. S. Dresselhaus, Phys. Rep., 2009, 506, 51–87 CrossRef .
  57. J. Zang, S. Ryu, N. Pugno, Q. Wang, Q. Tu, M. J. Buehler and X. Zhao, Nat. Mater., 2013, 12, 321–325 CrossRef CAS PubMed .
  58. M. Lotya, Y. Hernandez, P. J. King, R. J. Smith, V. Nicolosi, L. S. Karlsson, F. M. Blighe, S. De, Z. Wang, I. T. McGovern, G. S. Duesberg and J. N. Coleman, J. Am. Chem. Soc., 2009, 131, 3611–3620 CrossRef CAS PubMed .
  59. I. Y. Jeon, H. J. Choi, S. M. Jung, J. M. Seo, M. J. Kim, L. Dai and J. B. -Baek, J. Am. Chem. Soc., 2013, 135, 1386–1393 CrossRef CAS PubMed .
  60. D. W. Chang, H. J. Choi, I. Y. Jeon, S. J. Min, L. Dai and J. B. Baek, Carbon, 2014, 77, 501–507 CrossRef CAS .
  61. D. Yang, A. Velamakanni, G. Bozoklu, S. Park, M. Stollera, R. D. Piner, S. Stankovich, I. Jung, D. A. Field, C. A. Ventrice Jr and R. S. Ruff, Carbon, 2009, 47, 145–152 CrossRef CAS .
  62. C. Gómez-Navarro, R. T. Weitz, A. M. Bittner, M. Scolari, A. Mews, M. Burghard and K. Kern, Nano Lett., 2007, 7, 3499–3503 CrossRef PubMed .
  63. L. Sun, H. Yu and B. Fugetsu, J. Hazard. Mater., 2012, 101–105, 203–204 Search PubMed .
  64. N. Tsuyoshi and M. Yoshiaki, Carbon, 1994, 32, 469–475 CrossRef .

This journal is © The Royal Society of Chemistry 2016