Simultaneous determination of ciprofloxacin and paracetamol by adsorptive stripping voltammetry using copper zinc ferrite nanoparticles modified carbon paste electrode

Mal Phebe Kingsley, Pramod K. Kalambate and Ashwini K. Srivastava*
Department of Chemistry, University of Mumbai, Vidyanagari, Santacruz (E), Mumbai – 400098, India. E-mail: aksrivastava@chem.mu.ac.in; akschbu@yahoo.com; Fax: +91 22 26528547; Tel: +91 22 26527956

Received 25th September 2015 , Accepted 19th January 2016

First published on 28th January 2016


Abstract

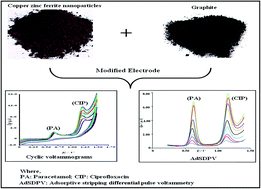
This work presents the development of an electrochemical sensor in the form of a copper zinc ferrite nanoparticle modified carbon paste electrode (CZF-CME) for the simultaneous determination of ciprofloxacin (CIP) and paracetamol (PA) using adsorptive stripping differential pulse voltammetry. The results indicate that the modified electrode exhibited enhancement of the oxidation peak current and shift in the oxidation potential to lower values in comparison with plain carbon paste electrode (CPE) for ciprofloxacin and paracetamol. The electrochemical performances of the modified electrode were investigated by cyclic voltammetry, chronocoulometry and electrochemical impedance spectroscopy, indicating the greater affinity of CIP and PA at the CZF-CME than at PCPE. Under the optimized conditions, the linear working ranges are from 9.09 × 10⁻⁷ M to 4.70 × 10⁻³ M and 1.85 × 10⁻⁷ M to 4.76 × 10⁻⁴ M for CIP and PA respectively. The detection limits (S/N = 3) of 2.58 × 10⁻⁹ M and 8.85 × 10⁻⁸ M for CIP and PA respectively were obtained when taken together. The CZF-CME showed relatively high sensitivity, selectivity, stability and the proposed method was successfully used for individual and simultaneous determination of ciprofloxacin and paracetamol in pharmaceutical formulations, serum and urine samples.

1. Introduction

Fluoroquinolones are an important antibacterial group of drugs which have been widely used for treatment of many bacterial infections. Ciprofloxacin (1-cyclopropyl-6-fluoro-1,4 dihydro-4-oxo-7-(1-piperazinyl)-3-quinolinecarboxylicacid) is a second generation fluoroquinolone.1 It is a broad-spectrum antibiotic, active against both Gram-positive and Gram negative bacteria. It is used for the treatment of urinary and lower respiratory tract infections, anthrax, urethral and cervical gonococcal infections, bone and joint infections, gastroenteritis, typhoid fever and acute sinusitis. It has excellent tissue penetration and available in both oral and intravenous formulations.2 Over the years, a wide range of techniques have been used for the determination of ciprofloxacin such as high-performance liquid chromatography,3–5 micellar liquid chromatography,6 turbidimetry,7 spectrophotometry,8–10 spectrofluorometry,11,12 capillary electrophoresis13,14 and electrochemical analysis.15–19

Paracetamol (N-acetyl-p-aminophenol) is an analgesic and an antipyretic.20 It is the most widely used over-the-counter analgesic agent in the world. It is the single most commonly taken drug in overdoses for deliberate self-poisoning, inducing life-threatening hepatic and renal failure.21 Varieties of methods have been used for the determination of paracetamol in pharmaceutical preparations and human plasma e.g. flow injection chemiluminescence,22 TLC densitometry,23 RP-HPLC,24 HPTLC,25 capillary electrophoresis,26 spectrophotometry27 and electrochemical method.28–32

It is interesting to note, in vitro and in vivo studies have suggested that synergistic effect is produced when antibiotics are given in combination with antipyretic drug.33 Thus combination of non-antibiotic drugs with antibiotics offers an opportunity to sample a previously untapped expanse of bioactive chemical space. Therefore, antipyretic medicaments in medical treatments with antibiotics are recommended.34,35 As of now, even though antibiotic and antipyretic drugs are co-administered in therapeutic treatment, they are not commonly found in combination in pharmaceutical formulations. However, an antipyretic with antihistaminic and anti-allergic formulations are available. Notwithstanding, in view of synergism produced as combinational formulations of antibiotic and antipyretic it is necessary therefore to develop an analytical method for simultaneous determination of these in order to detect any interference when present in combinations. Techniques like capillary electrophoresis, extractive spectrophotometry, HPLC and photo induced spectro-fluorimetry36–38 have been employed for simultaneous determination of its combined formulations in pharmaceutical and biological samples. However, its simultaneous determination by electrochemical technique has not been reported even though it has advantages like low cost, short analysis time and high sensitivity. Recently, electrochemical determination of drugs using modified electrode has received much attention because of its easier fabrication, selectivity and better reproducibility.39,40 Nanomaterials modified carbon paste electrodes have also been widely used for simultaneous determination of different analytes41,42 because of their exceptional properties such as high electrical conductivity, high surface area, mechanical strength and good chemical stability. Nanomaterials promote electron transfer reactions at the electrode surface when used as modifying material. Besides, metal oxide nanoparticles modified carbon paste electrode enhances the sensitivity of the electrode than plain carbon paste electrode.43–46 Ferrite nanoparticles due to their electrocatalytic activity and high surface area are commonly used as electrochemical sensors viz., magnetite nanoparticles47 for simultaneous determination of ascorbic acid and folic acid, carbon nanotube decorated with nickel ferrite nanoparticles48 for determination of satalol and recently barium cobalt ferrite nanoparticles49 for analysis of ciprofloxacin. The aim of this work is to first study the electrochemical behavior of ciprofloxacin and paracetamol and secondly to develop a highly sensitive electrochemical method for the simultaneous determination of ciprofloxacin (antibiotic) and paracetamol (antipyretic and analgesic) in pharmaceutical formulations, blood plasma and urine.

2. Material and methods

2.1. Chemicals

Chemicals used were of Analytical grade and used without any further purification. Graphite powder (amorphous graphite size, <50 μm) and paracetamol (PA) were purchased from S. D. fine Chemicals. Zinc ferrite, magnetite, copper ferrite, copper zinc ferrite nanoparticles (with sizes <100 nm) and mineral oil were purchased from Sigma-Aldrich. Ciprofloxacin (CIP) was purchased from Fluka. A stock Britton–Robinson buffer (BR) solution 0.04 M with respect to boric, orthophosphoric and acetic acid was used to investigate pH dependence of CIP and PA. Other buffer solutions used were acetate (Acet), phosphate (Phos), potassium hydrogen phthalate–hydrochloric acid (KHP–HCl) and citrate buffer (Cit). Double distilled water was used for the preparation of aqueous solutions. Few of the commercial pharmaceuticals of CIP and PA available from local pharmacies were subjected to analysis.

2.2. Instrumentation

Electrochemical experiments have been performed on Eco Chemie, Electrochemical Work Station, model Autolab PGSTAT 30 using GPES software version 4.9005 and Frequency Response Analyser, software version 2.0. Electrode system employing an Ag/AgCl (3 M KCl) as reference electrode, platinum electrode as counter electrode and a carbon paste working electrode (unmodified or modified) were used. ELICO LI 120 pH meter was used to measure the pH. Surface characterization of the copper zinc ferrite nanoparticles and composite of graphite–copper zinc ferrite nanoparticles was studied by scanning electron microscope (SEM) a FEI Inspect-250 model with an operating voltage of 20 kV.

2.3. Preparation of carbon paste electrode (CPE) and copper zinc ferrite nanoparticles modified carbon paste electrode (CZF-CME)

The CPE was prepared by thoroughly mixing fine graphite powder with mineral oil at composition 70[thin space (1/6-em)]:[thin space (1/6-em)]30 (w/w graphite/oil) using a motor and pestle and was allowed to homogenize for 48 hours.50 CZF-CME was prepared by mixing mineral oil, graphite powder and copper zinc ferrite nanoparticles with various weight ratios. A portion of the paste was then packed into a Teflon micro tip (diameter 0.5 mm) and a copper wire was inserted to establish an electrical contact. Electrode surface was smoothed on a zero grade butter paper to produce a reproducible working surface.

2.4. Voltammetric determination and SEM analyses

Cyclic voltammetric (CV) and adsorptive stripping differential pulse voltammetric (AdSDPV) studies were carried out for CIP and PA. Stock solution of CIP was prepared in 0.01 M HCl and for paracetamol it was prepared in distilled water. An appropriate aliquot was taken in 25 mL standard volumetric flask and made up to the mark with 0.05 M KHP–HCl buffers (pH 3). The solution was then transferred into an electrochemical cell and the measurements were carried out at 25 ± 0.2 °C. Oxygen did not interfere in the measurements therefore N2 gas purging was not required. The CV and AdSDPV studies were carried out by sweeping the potential between +0.25 to +1.5 V and from +0.2 to +1.4 V, respectively. The voltammograms were recorded using unmodified and modified (CZF-CME) carbon-paste electrodes. The EIS studies were performed on 5.00 × 10⁻⁵ M CIP or 1.00 × 10⁻⁶ M PA in 0.05 M of KHP–HCl (pH 3) in the frequency range from 10−1 to 105 Hz at open circuit potential with amplitude of 5 mV. For SEM analysis, samples were sonicated in toluene and analyzed after drying the samples.

2.5. Treatment and determination of samples

The pharmaceutical preparations were crocin and calpol (Glaxo Smithkline Pharmaceuticals Ltd) each containing 500 mg of PA, dolo 650 mg of PA (Micro labs ltd), flexon 650 mg of PA and 400 mg of ibuprofen (Aristo Pharmaceuticals Pvt ltd). Alcipro (Alkem Laboratories Ltd) and ciplox (Cipla) each contained 500 mg of CIP. Cibran (Ranbaxy Laboratories Ltd), zoxan (FDC Ltd) and cifran (Ranbaxy Laboratories Ltd), each contained 250 mg of CIP and zoxan eye/ear drops −0.3% w/v (FDC Ltd).
2.5.1. Preparation of solution for individual determination of CIP or PA in tablets. Five tablets each were accurately weighed and finely powdered with a mortar and pestle. To the corresponding weight of the real sample 50 mL of 0.01 M HCl was added. The mixture was shaken for 10 min and filtered through a Qualigens (615) filter paper made into a 100 mL volumetric flask. Appropriate volume of the sample was diluted to 25 mL with 0.05 M KHP–HCl buffer (pH 3) and then transferred to an electrolytic cell for the determination of CIP or PA.
2.5.2. Preparation of solution for simultaneous determination of CIP and PA in tablets. Five tablets of CIP and PA each were accurately weighed and finely powdered separately with a mortar and pestle. A quantity equivalent to 500 mg/250 mg of ciprofloxacin and 500 mg/650 mg of paracetamol was accurately weighed, mixed and homogenized together. To the weighed mixture 50 mL of 0.01 M HCl was added. Further, the procedure similar for individual drug determination was followed.
2.5.3. Preparation of solution for determination of CIP and PA in blood serum, urine and eye/ear drops. Urine and blood serum samples were obtained from local pathology laboratory and all ethical guidelines were followed in handling the samples for all measurements. To 0.5 mL of the blood serum/urine was taken in a 10 mL volumetric flask and made up with the supporting electrolyte in a cell and analyzed. 50 μL of ear drops was added to 25 mL of supporting electrolyte in a cell and analyzed. Standard addition method was employed for quantification of CIP and PA in all pharmaceutical, blood serum and urine.

3. Results and discussion

3.1. Scanning electron microscope (SEM)

The SEM image in Fig. 1 shows the morphology of the CZF nanoparticles. Surface studies were done with SEM which confirms the formation of nano composite as shown in Fig. 1. The SEM of Fig. 1(A) shows graphite particles, (B) shows spherical CZF nanoparticles and (C) the adsorption of CZF nanoparticles on graphite which attributes to the increase in surface area of the graphite–CZF composite. The chemical constituent of particles was analyzed by energy-dispersive X-ray spectrum for the CZF nanoparticles (Fig. 1(D)). It was observed that prominent peak appeared for Fe Lα (0.705 keV), Cu Lα (0.930 keV) and Zn Lα (1.012 keV) indicating the presence of iron, copper and zinc element present in the nanoparticles.
image file: c5ra19861e-f1.tif
Fig. 1 SEM images of (A) graphite; (B) CZF nanoparticles; (C) graphite–CZF nanocomposite and (D) energy-dispersive X-ray spectrum for CZF nanoparticles.

3.2. Effect of pH

The effect of change in pH on peak potential for CIP and PA were investigated by differential pulse voltammetry from pH 2 to 10 with BR buffer. Standard solutions of CIP (5.00 × 10⁻⁵ M) and PA (1.00 × 10⁻⁶ M) were used to find the optimum pH of the supporting electrolyte at CPE. Fig. S1(A) represents the plot of Ip vs. pH and Ep vs. pH for CIP and Fig. S1(B) represents the plot of Ip (anodic) vs. pH and Ep (anodic) vs. pH for PA. The variation of anodic peak potential (Ep) with pH is linear for both the molecules. Increase in pH shifted the potential to less positive values suggesting the involvement of protons for the electro-oxidation of CIP and PA. A slope of −0.057 V per pH and −0.050 V per pH for CIP and PA respectively were observed, suggesting that same number of electrons and protons were involved for both the molecules. With the increase in pH the peak currents were found to increase in the beginning showing maximum at pH 3 and decrease thereafter for both the molecules. The reason could be due to the fact that the repulsive electrostatic interactions of the molecules with the surface of the electrode made the oxidation of CIP and PA at the electrode surface became kinetically less favorable. Therefore, pH 3 which showed maximum peak current for both the molecules was selected as the optimum pH for further studies. The effects of several supporting electrolytes (0.1 M) viz., acetate, phosphate, citrate and KHP–HCl buffer at pH 3 for 5.00 × 10⁻⁵ M CIP on peak current were tested (Fig. S2). Of these, KHP–HCl gave the best response in terms of peak height and the peak shape. Further, optimization of buffer concentration was carried out by varying KHP–HCl concentration in the range from 0.01 M to 0.3 M, the best peak response was observed for 0.05 M of KHP–HCl (pH 3) and hence was used for further studies.

3.3. Effect of surface modification and optimization of the amount of the modifier

DPV study for 5.00 × 10⁻⁵ M CIP and 1.00 × 10⁻⁶ M PA in 0.05 M of KHP–HCl (pH 3) at CPE and carbon paste electrodes modified with different nanoferrites viz., zinc ferrite, magnetite, copper ferrite and copper zinc ferrite (CZF-CME) were performed. It is observed from Fig. S3 that CZF-CME gave the best performance among the above mentioned ferrites and CPE in terms of peak current and resolution showing an increase in the electron transfer rate of CIP at the electrode surface. Similarly, paracetamol (data not shown) also gave a higher peak current at CZF-CME than that for unmodified carbon paste electrode and the other ferrite carbon paste modified electrodes taken. Considering the best response of CZF-CME over other ferrite based sensors it was therefore chosen for the entire work.

The effect of modifier on the oxidation of 5.00 × 10⁻⁵ M CIP and 1.00 × 10⁻⁶ M of PA has been shown in Fig. 2 (A) and (B), respectively at CPE and CZF-CME using cyclic voltammetry. The cyclic voltammograms of CIP shows an irreversible peak, whereas PA shows a well-defined quasi-reversible redox peaks at CPE and CZF-CME. It was observed from these figures that the modification of the CPE with CZF nanoparticles enlarged the peak current considerably by about 2.6 times for CIP and that for PA by 1.2 times with a decline in peak potential from 1.24 V to 1.16 V for CIP and from 0.61 V to 0.52 V for PA as compared to CPE. This indicates that the surface of the modified electrode has been significantly changed. CZF-CME provided an efficient interface and micro-environment for the electrochemical oxidation reaction of CIP and PA by increasing the electro-active surface area of the electrode. The influence on the amount of CZF nanoparticles (Table S1) added to CPE was studied for CIP. The peak current increased with increase in the percentage weight of nanoparticles till the ratio of composition (w/w) for graphite[thin space (1/6-em)]:[thin space (1/6-em)]CZF nanoparticles[thin space (1/6-em)]:[thin space (1/6-em)]mineral oil was 60[thin space (1/6-em)]:[thin space (1/6-em)]10[thin space (1/6-em)]:[thin space (1/6-em)]30. There was a gradual decrease in peak current beyond this composition. This can be due to the increase in resistance of the CZF nanoparticles at the electrode to electron transfer. The surface area of CPE and CZF-CME having same nominal bore size were found to be 0.0212 cm2 and 0.0434 cm2, respectively using the cyclic voltammogram of ferri/ferrocyanide system and Randles–Sevcik equation.51


image file: c5ra19861e-f2.tif
Fig. 2 Cyclic voltammograms for oxidation of (A) of 5.00 × 10⁻⁵ M CIP at; (a) CPE (image file: c5ra19861e-u1.tif) (b) CZF-CME (image file: c5ra19861e-u2.tif) vs. Ag/AgCl (B) of 1.00 × 10⁻⁶ M PA at (a) CPE (image file: c5ra19861e-u3.tif) (b) CZF-CME (image file: c5ra19861e-u4.tif) vs. Ag/AgCl; in 0.05 M KHP–HCl (pH 3); scan rate 100 mV s−1 at 25 °C.

3.4. Electrochemical impedance spectroscopy (EIS)

Electrochemical impedance spectroscopy was performed for 5.00 × 10⁻⁵ M CIP and 1.00 × 10⁻⁶ M PA in 0.05 M of KHP–HCl (pH 3) to understand the electrochemical performance of CZF-CME over CPE. In the impedance measurement, the dc applied potential was held at an open circuit potential and a 5 mV amplitude ac potential was applied. 100 points per decade were acquired for the study. The voltage frequencies used for EIS measurements ranged from 100 kHz to 100 MHz. A suitable equivalent circuit known as Randles equivalent circuit is produced by the software to reflect the real electrochemical process and to enable a fit producing accurate value. This equivalent circuit is used to find out resistors and capacitors that pass current with same amplitude (inset in Fig. 3) where ‘Rs’ is electrolyte resistance, ‘Rct’ the charge transfer resistance, ‘Cdl’ the double layer capacitance and ‘W’ the Warburg impedance, in which charge-transfer resistance is in parallel with double layer capacitance.
image file: c5ra19861e-f3.tif
Fig. 3 Nyquist plots for the EIS measurements for (A) 5.00 × 10⁻⁵ M CIP at (a) CPE (image file: c5ra19861e-u5.tif) (b) CZF-CME (image file: c5ra19861e-u6.tif) (B) for 1.00 × 10⁻⁶ M PA at (a) CPE (image file: c5ra19861e-u7.tif) (b) CZF-CME (image file: c5ra19861e-u8.tif) in the frequency range from 10−1 to 105 Hz, the inset shows an equivalent circuit was used for data fitting.

The Nyquist plots for CIP and PA are shown in Fig. 3(A) and (B) respectively at the CPE and CZF-CME. It has two parts, a semicircular part and linear part. The semicircle represents the parallel combination of the Rct and Cdl. It corresponds to the electron transfer limited process, and its diameter is equal to the electron transfer resistance. The greater the size of the semicircle greater the electron transfer resistance.52 The Rct values obtained from Nyquist plots for 5.00 × 10⁻⁵ M CIP at CPE and CZF-CME from the EIS measurements was 645.58 Ω and 268.44 Ω respectively. Similarly, the charge transfer resistance value for 1.00 × 10⁻⁶ M PA at CPE and CZF-CME was found to be 367.23 Ω and 247.67 Ω. It is seen that CZF-CME electrode showed a smaller diameter when compared to that of the CPE for both the molecules. The measured data quality is of crucial importance for a reliable interpretation of impedance curves. Kramers–Kronig (K–K) relations are used to evaluate data quality which is true for EIS data to assess consistency and quality of measured impedance spectra. The K–K relations are integral equations which constrain the real and imaginary components of the impedance for systems that satisfy the conditions of causality linearity and stability. It has proven useful for confirming the self-consistency of electrochemical impedance data. The χ2 provides the best fit for all experimental data points which satisfies the K–K relations. The test implied that the impedance data were validated with respect to impedances over a wide frequency range.53 The K–K transformation gave a χ2 for CIP and PA at CZF-CME as 1.292 × 10⁻² and 1.6205 × 10⁻⁴ respectively and at CPE 1.443 × 10⁻¹ and 6.33 × 10⁻² respectively satisfying all the conditions for a good impedance data.

3.5. Cyclic voltammetry

The effect of scan rate were studied for 5.00 × 10⁻⁵ M CIP and 1.00 × 10⁻⁶ M PA for the purpose of investigating their reaction mechanism which are shown in Fig. 4(A) and (B), respectively. The influence of scan rate was studied from 50 to 1000 mV s−1 for both the molecules at CZF-CME in 0.05 M KHP–HCl (pH 3). The peak current varied linearly with increase in the scan rate for CIP (Fig. S4(A)) with a regression equation
 
Ip = 0.007ν + 1.785 [R2 = 0.992; Ip: μA, ν: (mV s−1)] (1)
validating a typical adsorption-controlled process. The peak potential shifted to more positive values with the increase of scan rate, which confirmed the irreversibility of the oxidation process (Fig. S4(B)).

image file: c5ra19861e-f4.tif
Fig. 4 Cyclic voltammograms for the oxidation (A) of 5.00 × 10⁻⁵ M CIP (B) of 1.00 × 10⁻⁶ M PA for scan rate (a) 50; (b) 100; (c) 200; (d) 300; (e) 500; (f) 600; (g) 700; (h) 800; (i) 900 mV s−1 in 0.05 M KHP–HCl (pH 3) at CZF-CME vs. Ag/AgCl at 25 °C.

The effect of scan rate on the anodic and cathodic peak current of PA on CZF-CME shows a linear increase as the square root of scan rate increases (Fig. S5(A)) indicating a diffusion controlled process with their respective linear regression equation as,

 
Ipa = 0.660ν1/2 − 0.662 [R2 = 0.997Ipa: μA, ν1/2: (mV s−1)1/2] (2)
 
Ipc = −0.279ν1/2 − 0.181 [R2 = 0.995Ipc: μA, ν1/2: (mV s−1)1/2] (3)

The oxidation peak potential is positively shifted and the reduction peak potential is negatively shifted (Fig. S5(B)). Also, plot of log(anodic peak current) versus log(scan rate), gave a straight line having a slope of 0.532 which is comparable with the theoretical slope of 0.5 for a diffusion controlled process and fulfilling the equation,

 
log[thin space (1/6-em)]Ipa = 0.532[thin space (1/6-em)]log[thin space (1/6-em)]ν − 0.291 [R2 = 0.997Ipa: μA, ν: mV s−1] (4)

For a quasi-reversible or irreversible reaction the number of electrons (n) involved in the oxidation reaction was calculated from the following equation:54

 
EpEp/2 = 47.7/ [mV at 25 °C] (5)

EpEp/2 value for CIP and PA was found to be 50 mV and 40 mV respectively. On substitution in the above equation, assuming α as 0.5, ‘n’ was calculated to be 1.91 for CIP and 2.3 for PA which indicated that two electrons were involved in the oxidation process of CIP and PA on the modified electrode. Since the oxidation occurred by transfer of the same number of electrons and protons for both the molecules therefore, two electrons and two protons transfer was involved in the electro-oxidation of CIP and PA at the CZF-CME. Scheme 1(a) and (b) shows the electrochemical reaction process for the oxidation of CIP and PA at the CZF-CME respectively.


image file: c5ra19861e-s1.tif
Scheme 1 (a) Electro-oxidative mechanism of ciprofloxacin, (b) electro-oxidative mechanism of paracetamol.

Scheme 1(a) and (b) show the electrochemical reaction process for the oxidation of CIP and PA at the CZF-CME respectively. Both CIP and PA have a secondary amine group presenting a basic centre with the availability of non bonding electron as donor. Therefore, we presume that the first oxidation step takes place at –NH group for both the molecules. For ciprofloxacin due to loss of two protons and two electrons the –NH–CH2– group is oxidized to –N[double bond, length as m-dash]CH– group. In case of paracetamol the radical cation formed at the –NH– group undergoes delocalization to give the product N-acetyl-p-quinone imine.55

3.6. Effect of accumulation parameters by differential pulse voltammetry

3.6.1. Effect of accumulation potential and accumulation time. The dependence of differential pulse anodic stripping peak current for 5.00 × 10⁻⁵ M CIP on the accumulation potential from 0.5 V to 1.3 V were examined (Fig. S6(A)). It was found that the maximum response was at 1.0 V and was an ideal choice for optimal sensitivity. The effect of accumulation time on the efficiency of drug onto the working electrode surface was evaluated over the time range from 0 second to 240 seconds. The resulting peak current accumulation time profile can be seen from the Fig. S6(B). A steady enhancement in the peak current was observed over the range from 0 to 160 seconds and thereafter, the peak intensity gradually tended to a plateau. This could be probably indicating that the adsorption of CIP on CZF-CME surface has reached saturation. For practical purposes, the accumulation time was used as 160 seconds with an optimal stirring rate during the accumulation step which was found to be 800 rpm. The anodic and cathodic peak current were independent with variation in potential (0.0 V to 1.4 V) and time (0 second to 240 seconds) for 1.00 × 10⁻⁶ M PA reconfirming that the process of PA reaching the CZF-CME surface was purely by diffusion.
3.6.2. Effect of potential sweep parameters. Study was done on the effect of excitation pulse amplitude from 0.01 V to 0.10 V on the peak current for 5.00 × 10⁻⁵ M CIP. It was observed that the current increased as the pulse amplitude increased and the best peak shape was obtained at 60 mV pulse amplitude. After 60 mV, the shape of the peak was distorted. Therefore 60 mV pulse amplitude was the ideal choice for this operational parameter. The effect of scan rate on the peak current was studied over the range of 5–150 mV s−1. As the scan rate was increased the peak current increased. Faster scan rates resulted in higher peak currents but background currents also increased. By taking peak current and background current into consideration the scan rate chosen was 100 mV s−1.

3.7. Chronocoulometry (CC)

Double-potential step chronocoulometry was performed after point-by-point background subtraction for CIP and PA to evaluate the surface coverage of the electrode and the diffusion coefficient for both the molecules. According to the following equation54
 
Qt = (2nFD1/2CAt1/2)/π1/2 + nFAΓ0 + Qdl (6)
where, Qt is the total charge in Coulombs, Qdl is the double layer charging in Coulombs, n is the number of electrons, F is the Faradays constant (96[thin space (1/6-em)]485 C mol−1), C is the concentration in mol cm−3, A is the area of the electrode (cm2), t is time in seconds, Γ0 is surface coverage in mol cm−2 and D is the diffusion coefficient in cm2 s−1. The Anson plot of Qt vs. t1/2 showed a linear relationship for 5.00 × 10⁻⁵ M CIP and 1.00 × 10⁻⁶ M PA. From the slope of Anson plot, the diffusion coefficients (D) for CIP and PA can be estimated and from intercept the surface coverage (Γ0) of the electrode is determined. Table 1 gives the calculated parameters. Increase in the value of charge due to adsorption at CZF-CME indicates greater accumulation of CIP and PA on its surface rather than on CPE. The surface coverage of CIP and PA at CZF-CME is greater than for CPE indicating better response towards the modified electrode.
Table 1 Chronocoulometry of 5.00 × 10⁻⁵ M CIP and 1.00 × 10⁻⁶ M PA
Molecule Electrode Slope (μCs−1/2) Intercept Qads (μC) Surface coverage (10−9 mol cm−2) Diffusion coefficient (cm2 s−1)
CIP CPE 8.42 ± 1.44 18.17 ± 1.19 4.44 3.32 × 10⁻¹⁰
CZF-CME 35.01 ± 0.98 50.00 ± 0.92 5.97 13.71 × 10⁻¹⁰
PA CPE 12.94 ± 2.55 28.64 ± 1.84 7.00 7.85 × 10⁻⁸
CZF-CME 17.45 ± 3.15 82.56 ± 2.68 9.85 15.69 × 10⁻⁸


3.8. Determination of CIP and PA by adsorptive stripping differential pulse voltammetry (AdSDPV)

CIP and PA were determined by AdSDPV technique (Table S2) individually and simultaneously. The linear working range (LWR), empirical limits of detection (LOD) (S/N = 3), linear regression equation (LRE) and correlation coefficient (r) were determined and are shown in Table 2. Fig. 5(A) and (B) represents the voltammograms for separate determination of CIP and PA respectively.
Table 2 Analytical parameters for electrochemical determination of CIP and/or PA in 0.05 M KHP–HCl (pH 3) by AdSDPV
Molecule LOD % RSD LWR LRE r
Statistical data for individual molecule
CIP 1.38 × 10⁻⁹ M 2.94 3.15 × 10⁻⁸ M to 6.00 × 10⁻³ M Ip (μA) = 0.105 (μM) + 2.255 0.996
PA 7.87 × 10⁻⁹ M 1.46 4.76 × 10⁻⁸ M to 2.63 × 10⁻⁴ M Ip (μA) = 0.178 (10 μM) + 3.016 0.993
[thin space (1/6-em)]
Statistical data when CIP concentration increases and PA concentration (1.00 × 10⁻⁶ M) remains constant
CIP 3.41 × 10⁻⁹ M 3.74 9.42 × 10⁻⁷ M to 3.98 × 10⁻³ M Ip (μA) = 1.265 (μM) + 3.513 0.984
[thin space (1/6-em)]
Statistical data when PA concentration increases and CIP concentration (5.00 × 10⁻⁵ M) remains constant
PA 2.57 × 10⁻⁸ M 2.69 1.66 × 10⁻⁷ M to 4.76 × 10⁻⁴ M Ip (μA) = 0.242 (10 μM) + 1.393 0.991
[thin space (1/6-em)]
CIP and PA increases in concentration simultaneously
CIP 2.58 × 10⁻⁹ M 1.87 9.09 × 10⁻⁷ M to 4.70 × 10⁻³ M Ip (μA) = 0.657 (μM) + 3.446 0.982
PA 8.85 × 10⁻⁸ M 1.76 1.85 × 10⁻⁷ M to 4.76 × 10⁻⁴ M Ip (μA) = 0.248 (10 μM) + 1.118 0.989


image file: c5ra19861e-f5.tif
Fig. 5 AdSDPV curves obtained at CZF-CME for (A) CIP at different concentrations (a) 0.02; (b) 0.04; (c) 0.4; (d) 0.8; (e) 4.0; (f) 6.0; (g) 8.0; (h) 20.0; (i) 40.0; (j) 60.0 μM (B) PA at different concentrations (a) 0.2; (b) 0.4; (c) 0.6; (d) 0.8; (e) 2.0; (f) 4.0; (g) 6.0; (h) 8.0; (i) 20.0; (j) 40.0 μM: scan rate 100 mV s−1 in 0.05 M KHP–HCl (pH 3.0): pulse amplitude 60 mV. Inset shows the linearity graph of CIP and PA.

There is no report on the simultaneous determination of CIP and PA by electrochemical technique. Therefore, the main objective of this study was to determine CIP and PA simultaneously using our proposed method. This was performed by simultaneously changing the concentrations of CIP and PA and recording their DPVs. To study their behavior, two separate sets of experiments were carried out. In the first instance, concentration CIP was increased in the presence of fixed concentrations of other (PA) and their voltammograms are given in Fig. 6(A) and vice versa as given in Fig. 6(B). For the second instance, both CIP and PA were determined by simultaneously increasing their concentrations as given in Fig. 6(C). From Table 2, it is observed that the LWR and LOD determined for CIP and PA simultaneously are in good agreement with when both were individually determined. Table 3 shows the comparison of the proposed sensor with the reported electrochemical sensors for the determination of CIP and PA individually. The comparative performance of the proposed sensor has lower detection limit and relatively large linear working range. Also, since it is a carbon paste electrode sensor the preparation of the electrode was easier and had good sensitivity as compared to other reported electrodes.


image file: c5ra19861e-f6.tif
Fig. 6 AdSDPV curves obtained at CZF-CME for (A) PA at different concentrations (a) 0.4; (b) 0.8; (c) 2.0; (d) 4.0; (e) 6.0; (f) 8.0; (g) 20.0; (h) 40.0 μM in the presence of 5.00 × 10⁻⁵ M CIP. (B) CIP at different concentrations (a) 0.02; (b) 0.04; (c) 0.4; (d) 4.0; (e) 6.0; (f) 8.0; (g) 40.0; (h) 60.0 μM in the presence of 1.00 × 10⁻⁶ M PA in 0.05 M KHP–HCl (pH 3.0) scan rate 100 mV s−1: pulse amplitude 60 mV. (C) Simultaneous determination of PA and CIP at different concentrations (a) 0.2 & 0.02; (b) 0.4 & 0.04; (c) 0.8 & 0.06; (d) 1.0 & 0.8; (e) 1.0 & 2.0; (f) 4.0 & 6.0; (g) 6.0 & 8.0; (h) 8.0 & 20.0; (i) 10.0 & 50.0 μM of PA and CIP respectively in 0.05 M KHP–HCl (pH 3.0): scan rate 100 mV s−1: pulse amplitude 60 mV.
Table 3 Comparison of the performances of electrochemical sensors for CIP and PA at CZF-CME in 0.05 M KHP–HCl (pH 3.0) by AdSDPV
Molecule Modified electrode Detection limit (M) Linear range (M) References
Ciprofloxacin Poly(alizarin red)/graphene composite film 1.00 × 10⁻⁸ 4 × 10⁻⁸ to 1.2 × 10⁻⁴ 56
Multi-walled nanotube composite film 6.00 × 10⁻⁶ 4 × 10⁻⁵ to 1.0 × 10⁻³ 57
MgFe2O4–MWCNTs 1.00 × 10⁻⁸ 1.00 × 10⁻⁷ to 1.00 × 10³ 58
CZF-CME 1.38 × 10⁻⁹ 3.15 × 10⁻⁸ to 6.00 × 10⁻³ This work
Paracetamol Boron-doped diamond electrode/Nafion and lead films 1.70 × 10⁻⁷ 5.00 × 10⁻⁷ to 2.00 × 10⁻⁴ 59
Micro-crystalline natural graphite–polystyrene composite film 3.40 × 10⁻⁸ 2.00 × 10⁻⁸ to 1.00 × 10⁻⁶ 60
Multiwalled carbon nanotube modified basal plane pyrolytic graphite 4.50 × 10⁻⁸ 1.00 × 10⁻⁸ to 2.0 × 10⁻⁶ & 2.0 × 10⁻⁶ to 2.0 × 10⁻⁵ 61
CZF-CME 7.87 × 10⁻⁹ 4.76 × 10⁻⁸ to 2.63 × 10⁻⁴ This work


3.9. Validation studies, interference studies and analytical applications

Five replicate measurements for 1.00 × 10⁻⁴ M CIP and 1.00 × 10⁻⁵ M PA over intra-day assay (single day, n = 5) and inter-day assay (for a period of 1 week) was performed for validation of the proposed method. Parameters such as repeatability, reproducibility, precision and accuracy of the analysis were obtained. Satisfactory bias and relative standard deviations (% RSD) were obtained and are presented in Table 4. The recoveries obtained confirmed high accuracy and the % RSD showed good precision of the proposed method.
Table 4 Precision and bias of assay for standard CIP and PA solution by AdSDPV (n = 5)
Molecule   Concentration taken (mol L−1) Mean concentration found (mol L−1) Bias% Precision % RSD
CIP Intra day 1.00 × 10⁻⁴ 1.02 × 10⁻⁴ 2.00 1.59
Inter day 1.00 × 10⁻⁴ 0.995 × 10⁻⁴ −0.50 1.23
PA Intra day 1.00 × 10⁻⁵ 0.986 × 10⁻⁵ −1.40 2.05
Inter day 1.00 × 10⁻⁵ 1.05 × 10⁻⁵ 5.00 1.81


Matrix effect on CIP and PA was determined by AdSDPV. The influences of peak current on interferents for both the molecules that are commonly present in biological media were investigated. Under optimized experimental conditions described above, the effects of some foreign species on the determination of CIP and PA at CZF-CME were evaluated. The peak current of 1.00 × 10⁻⁴ M CIP and 1.00 × 10⁻⁵ M PA showed no significant change even after the addition of 200-fold of Na+, K+, Mg2+, Ca2+, Cl, SO42−, 150-fold of glucose, uric acid and thiamine hydrochloride, 60 fold of caffeine, 10 fold of citric acid, 50 fold of 4-aminophenol, 30 fold of aspirin, 30-fold concentration of lysine and 100 fold vitamin C showing that the present modified electrode was highly selective towards the determination of CIP and PA in the presence of common physiological interferents.

The validity of the CZF-CME was verified for the determination of CIP and PA in various pharmaceutical preparations by standard addition method. Amount of CIP and/or PA present in tablets are given in Table 5. The recovery of CIP and PA on the spiked samples (blood and urine) were determined and shown in Table S3 which ranged between 97.2% and 104.6% for CIP and 98.3% and 104.7% for PA indicating high reproducibility and reliability of the modified electrode.

Table 5 Assay of CIP and/or PA in pharmaceutical preparations (n = 5)
Ciprofloxacin Paracetamol
Tablet Amount of drug in the sample (mg) Amount of drug obtained in the proposed method (mg) ± RSD Tablet Amount of drug in the sample (mg) Amount of drug obtained in the proposed method (mg) ± RSD
Alcipro 500.0 507.7 ± 1.03 Calpol 500.0 506.1 ± 1.83
Cebran 250.0 251.0 ± 2.33 Crocin 500.0 498.7 ± 1.06
Zoxan 250.0 249.3 ± 1.49
Dolo 650.0 651.1 ± 3.14


4. Conclusion

Interference free, rapid and simple operation of the proposed method using copper zinc ferrite modified carbon paste electrode makes it suitable for the analysis of ciprofloxacin and paracetamol simultaneously. The modified electrode has been used for determination of CIP and PA in tablets, urine and blood demonstrating the applicability of the method for real sample analysis. This sensor can be used for voltammetric determination of these analytes as low as 2.58 nM for CIP and 88.5 nM for PA with good reproducibility, sensitivity and reliability. The proposed method for the simultaneous determination of CIP and PA will offer a good alternative, both economically and environmentally, for quality control of pharmaceutical formulations in future.

Acknowledgements

One of the authors (MPK) is grateful to the University Grants Commission, New Delhi, India for providing financial assistance under Faculty Improvement Programme for this work.

References

  1. C. M. Oliphant and G. M. Green, Am. Fam. Physician, 2002, 65, 455–464 Search PubMed.
  2. D. M. Campoli-Richards, J. P. Monk, A. Price, P. Benfield, P. A. Todd and A. Ward, Drugs, 1988, 35, 373–447 CrossRef CAS PubMed.
  3. K. Marika, T. Kimiko, K. Tsutomu, N. Koichi and N. Shigeyuki, Clin. Chem., 1998, 44, 1251–1255 Search PubMed.
  4. Z. Vybíralová, M. Nobilis, J. Zoulova, J. Květina and P. Petr, J. Pharm. Biomed. Anal., 2005, 37, 851–858 CrossRef PubMed.
  5. N. M. Simon, T. Nahashon, K. Japhet, M. Alex, O. K. Gilbert and M. Kathryn, J. Chromatogr. B: Biomed. Sci. Appl., 2011, 879, 146–152 CrossRef PubMed.
  6. L. V. José, A. Lilia, P. Avismelsi and N. Alberto, Anal. Chim. Acta, 2004, 516, 135–140 CrossRef.
  7. C. Edith, C. Laignier, R. Hérida and S. Nunes, J. Pharm. Anal., 2013, 3, 382–386 CrossRef.
  8. F. Lorena and E. E. S. Schapoval, Int. J. Pharm., 1996, 127, 279–328 CrossRef.
  9. S. N. Rajia, J. M. Yeakuty and B. S. Kumar, J. Pharm. Sci., 2011, 4, 84–90 Search PubMed.
  10. M. I. Pascual-Reguera, P. G Perez and M. D. Antonio, Microchem. J., 2004, 77, 79–84 CrossRef CAS.
  11. M. S. Attiaa, A. E. Amr and A. O. Youssef, J. Photochem. Photobiol., A, 2012, 236, 26–34 CrossRef.
  12. N. Alberto, B. Oscar, B. Rosario and L. V. José, Talanta, 2000, 52, 845–852 CrossRef.
  13. M. Katarzyna, P. Genowefa and T. Stefan, J. Chromatogr. A, 2004, 1051, 267–272 CrossRef.
  14. Z. Xiaoming, D. Xing, D. Zhu, Y. Tang and L. Jia, Talanta, 2008, 75, 1300–1306 CrossRef PubMed.
  15. A. A. J. Torriero, J. J. J. Ruiz-Díaz, E. Salinos, E. J. Marchevsky, M. I. Sanz and J. Raba, Talanta, 2006, 69, 691–699 CrossRef CAS PubMed.
  16. M. A. Abdalla, M. S. Salah, M. A. Al-Olyan and S. M. Al-Ghannam, Talanta, 2003, 61, 239–244 CrossRef.
  17. Y. Ni, Y. Wang and S. Kokot, Talanta, 2006, 69, 216–225 CrossRef CAS PubMed.
  18. F. Lida and A. Mahnaz, Colloids Surf., B, 2010, 81, 110–114 CrossRef PubMed.
  19. S. Zhang and S. Wei, Bull. Korean Chem. Soc., 2007, 28, 543–546 CrossRef CAS.
  20. A. Bertolini, A. Ferrari, A. Ottani, S. Guerzoni, R. Tacchi and S. Leone, CNS Drug Rev., 2006, 12, 250–275 CrossRef CAS PubMed.
  21. F. F. S. Daly, J. S. Fountain, L. Murray, A. Graudins and N. A. Buckley, Med. J. Aust., 2008, 188, 296–302 Search PubMed.
  22. W. Ruengsitagoon, S. Liawruangrath and A. Townshend, Talanta, 2006, 69, 976–983 CrossRef CAS PubMed.
  23. N. M. Mostafa, J. Saudi Chem. Soc., 2010, 14, 341–344 CrossRef CAS.
  24. M. Attimarad, J. Pharmacol. Methods, 2011, 2, 61–66 CrossRef PubMed.
  25. S. L. Borisagar, U. P. Jayswal, H. U. Patel and C. N. Patel, J. Pharmacol. Methods, 2011, 2, 83–87 CrossRef PubMed.
  26. F. Bohnenstengel, H. K. Kroemer and B. Sperker, J. Chromatogr. B: Biomed. Sci. Appl., 1999, 721, 295–299 CrossRef CAS.
  27. Sirajuddin, A. R. Khaskheli, A. Shah, M. I. Bhanger, A. Niaz and S. Mahesar, Spectrochim. Acta, Part A, 2007, 68, 747–751 CrossRef CAS PubMed.
  28. R. N. Goyal and S. P. Singh, Electrochim. Acta, 2006, 51, 3008–3012 CrossRef CAS.
  29. B. J. Sanghavi and A. K. Srivastava, Electrochim. Acta, 2010, 55, 8638–8648 CrossRef CAS.
  30. A. R. Khaskheli, J. Fischer, J. Barek, V. Vyskocil, Sirajuddin and M. I. Bhanger, Electrochim. Acta, 2013, 101, 238–242 CrossRef CAS.
  31. A. T. E. Vilian, M. Rajkumar and S. M. Chen, Colloids Surf., B, 2014, 115, 295–301 CrossRef PubMed.
  32. B. J. Sanghavi and K. Ashwini, Anal. Chim. Acta, 2011, 706, 246–254 CrossRef CAS PubMed.
  33. G. Pasăre, V. Pasăre, N. Eftimescu and M. Ivan, Zentralbl Bakteriol Naturwiss., 1979, 134, 640–647 Search PubMed.
  34. K. Akilandeswari, K. Ruckmani and S. Abirami, Int. J. Pharm. Pharm. Sci., 2013, 5, 627–630 CAS.
  35. M. A. Toama, E. H. M. Fatatry and B. E. Falaha, J. Pharm. Sci., 1978, 67, 23–26 CrossRef CAS PubMed.
  36. A. R. Solangi, S. Q. Memon, A. Mallah, N. Memon, M. Y. Khuhawar and M. I. Bhanger, Pak. J. Pharm. Sci., 2011, 24, 539–544 CAS.
  37. A. Espinosa-Mansilla, A. M. de la Peña, F. Cañada-Cañada and D. G. Gómez, Anal. Biochem., 2005, 347, 275–286 CrossRef CAS PubMed.
  38. N. Sultana, M. S. Arayne and S. N. Ali, Am. J. Anal. Chem., 2013, 4, 24–33 CrossRef CAS.
  39. A. K. Srivastava and R. R. Gaichore, Anal. Lett., 2010, 43, 1933–1950 CrossRef CAS.
  40. N. S. Gadhari, B. J. Sanghavi and A. K. Srivastava, Anal. Chim. Acta, 2011, 703, 31–40 CrossRef CAS PubMed.
  41. B. J. Sanghavi, S. M. Mobin, P. Mathur, G. K. Lahiri and A. K. Srivastava, Biosens. Bioelectron., 2013, 39, 124–132 CrossRef CAS PubMed.
  42. N. F. Atta, A. Galal, F. M. Abu-Attia and S. M. Azab, J. Mater. Chem., 2011, 21, 13015 RSC.
  43. S. Ghosh, M. Narjinary, A. Sen, R. Bandyopadhyay and S. Roy, Sens. Actuators, B, 2014, 203, 490–496 CrossRef CAS.
  44. S. H. Wang, T. C. Chou and C. C. Liu, Sens. Actuators, B, 2003, 94, 343–351 CrossRef CAS.
  45. M. Muti, A. Erdem, A. Caliskan, A. Sınag and T. Yumak, Colloids Surf., B, 2011, 86, 154–157 CrossRef CAS PubMed.
  46. L. Jiang, S. Gu, Y. Ding, F. Jiang and Z. Zhang, Nanoscale, 2014, 6, 207 RSC.
  47. M. P. Kingsley, P. B. Desai and A. K. Srivastava, J. Electroanal. Chem., 2015, 741, 71–79 CrossRef CAS.
  48. A. A. Ensafi, A. R. Allafchian, B. Rezaei and R. Mohammadzadeh, Mater. Sci. Eng., C, 2013, 33, 202–208 CrossRef CAS PubMed.
  49. N. S. E. Osman, N. Thapliyal, W. S. Alwan, R. Karpoormath and T. Moyo, J. Mater. Sci.: Mater. Electron., 2015, 26, 5097–5105 CrossRef CAS.
  50. S. Ivan and K. Schachl, Chem. Listy, 1999, 93, 490–499 Search PubMed.
  51. J. Wang, Analytical Electro Chemistry, Wiley-VCH, New York, 2nd edn, 2001 Search PubMed.
  52. L. Yu, et al., Food Chem., 2015, 176, 22–26 CrossRef CAS PubMed.
  53. Impedance Spectroscopy; Theory, Experiment, and Applications, ed. E. Barsoukov and J. R. Macdonald, Wiley Interscience Publications, 2nd edn, 2005 Search PubMed.
  54. A. J. Bard and L. R. Faulkner, Electrochemical Methods Fundamentals and Applications, 2nd edn, John Wiley & Sons, New York, 2001 Search PubMed.
  55. P. K. Kalambate, B. J. Sanghavi, S. P. Karna and A. K. Srivastava, Sens. Actuators, B, 2015, 213, 285–294 CrossRef CAS.
  56. X. Zhang, Y. Wei and Y. Ding, Anal. Chim. Acta, 2014, 835, 29–36 CrossRef CAS PubMed.
  57. L. Fotouhi and M. Alahyari, Colloids Surf., B, 2010, 81, 110–114 CrossRef CAS PubMed.
  58. A. A. Ensafi, R. A. Allafchian and R. Mohammadzadeh, Anal. Sci., 2012, 28, 705–710 CrossRef CAS PubMed.
  59. K. Tyszczuk-Rotko, I. Bęczkowska, M. Wójciak-Kosior and I. Sowa, Talanta, 2014, 129, 384–391 CrossRef CAS PubMed.
  60. A. R. Khaskheli, J. Fischer, J. Barek, V. Vyskocil, Sirajuddin and M. I. Bhanger, Electrochim. Acta, 2013, 101, 238–242 CrossRef CAS.
  61. R. T. Kachoosangi, G. G. Wildgoose and R. G. Compton, Anal. Chim. Acta, 2008, 618, 54–60 CrossRef CAS PubMed.

Footnote

Electronic supplementary information (ESI) available. See DOI: 10.1039/c5ra19861e

This journal is © The Royal Society of Chemistry 2016