
 Open Access Article
 This Open Access Article is licensed under a Creative Commons Attribution-Non Commercial 3.0 Unported Licence
Structural stability of DNA origami nanostructures in the presence of chaotropic agents†
Saminathan
Ramakrishnan‡
a,
Georg
Krainer‡
bc,
Guido
Grundmeier
a,
Michael
Schlierf
*b and
Adrian
Keller
*a
aTechnical and Macromolecular Chemistry, University of Paderborn, Warburger Str. 100, 33098 Paderborn, Germany. E-mail: adrian.keller@uni-paderborn.de
bB CUBE - Center for Molecular Bioengineering, Technische Universität Dresden, Arnoldstr. 18, 01307 Dresden, Germany. E-mail: schlierf@bcube-dresden.de
cMolecular Biophysics, University of Kaiserslautern, Erwin-Schrödinger-Str. 13, 67663 Kaiserslautern, Germany
First published on 21st April 2016
Abstract
DNA origami represent powerful platforms for single-molecule investigations of biomolecular processes. The required structural integrity of the DNA origami may, however, pose significant limitations regarding their applicability, for instance in protein folding studies that require strongly denaturing conditions. Here, we therefore report a detailed study on the stability of 2D DNA origami triangles in the presence of the strong chaotropic denaturing agents urea and guanidinium chloride (GdmCl) and its dependence on concentration and temperature. At room temperature, the DNA origami triangles are stable up to at least 24 h in both denaturants at concentrations as high as 6 M. At elevated temperatures, however, structural stability is governed by variations in the melting temperature of the individual staple strands. Therefore, the global melting temperature of the DNA origami does not represent an accurate measure of their structural stability. Although GdmCl has a stronger effect on the global melting temperature, its attack results in less structural damage than observed for urea under equivalent conditions. This enhanced structural stability most likely originates from the ionic nature of GdmCl. By rational design of the arrangement and lengths of the individual staple strands used for the folding of a particular shape, however, the structural stability of DNA origami may be enhanced even further to meet individual experimental requirements. Overall, their high stability renders DNA origami promising platforms for biomolecular studies in the presence of chaotropic agents, including single-molecule protein folding or structural switching.
Introduction
DNA origami1 is an emerging tool with great potential for applications in nanotechnology, biophysics, and structural biology. For DNA origami assembly, a long, single-stranded DNA scaffold is folded into a desired 2D or 3D nanoscale object using base pair complementarity and segmental crossovers of a large number of short oligonucleotides, so-called staple strands. The resulting DNA origami nanostructures may serve as spatially addressable molecular breadboards that enable the controlled arrangement of functional entities with nanometer precision. In particular, the possibility to modify selected staple strands with metallic,2 semiconducting,3 and biological nanoparticles,4 fluorophores,5 proteins,6 and DNA strands of desired sequence7 and topology8 renders DNA origami nanostructures powerful platforms for single-molecule studies.9,10However, maintaining the structural integrity of the DNA origami may pose significant limitations regarding their applicability in biophysical and biochemical studies. Typically, DNA origami are assembled in TAE buffer supplemented with moderate concentrations of Mg2+ ions in order to screen the electrostatic repulsion between neighboring double helices. Deviations from these buffering conditions can have devastating effects on the DNA origami, ranging from aggregation to shape distortions to total structural collapse.11–13 Thus, a number of recent studies have investigated the stability of different DNA origami nanostructures under various application-relevant conditions.12,14–16 While DNA origami showed surprising stability under harsh conditions such as high temperatures and pH values,14 they were found extremely sensitive toward other conditions as exemplified by their almost instant degradation when exposed to 0.1% serum.15 Hence, to fully exploit the potential of DNA origami in single-molecule studies, profound knowledge of the effect of the respective environmental conditions on their structural as well as functional integrity is required.
Among many potential applications of DNA origami as nanoscale platforms,2–5,17,18 they are particularly attractive to monitor conformational changes19,20 in single biomolecules.21–23 One very prominent example of such conformational changes is protein folding studies using single-molecule Förster Resonance Energy Transfer (smFRET).20,24–26 Protein immobilization on DNA origami would allow for the investigation of protein subpopulations and conformational dynamics of complex and heterogeneous protein folding scenarios such as folding networks as well as the study of distance dependent protein-folding effects; folding scenarios that are otherwise extremely hard if not impossible to address.
A critical factor to consider when conducting such studies on DNA origami substrates is the exposure of the protein-decorated DNA origami to chaotropic denaturants. The application of chaotropic agents such as urea and guanidinium chloride (GdmCl) is a frequently used approach to trigger conformational changes in proteins for studying the folding stability and dynamics.20 However, urea and GdmCl may also interfere with DNA in a similar way as with proteins by disrupting native hydrogen bonding or hydration shells, of which both are crucial for double-stranded (ds) DNA formation.27 Consequently, exposure of dsDNA to urea or GdmCl may induce denaturation of the duplex. Indeed, it was shown that the melting temperature (Tm) of genomic dsDNA decreases linearly by 2.25 °C per molar increasing urea concentration.28 Nevertheless, the effect of urea and GdmCl on the stability of more complex DNA structures like DNA origami has to date not been investigated and the question boils down to whether DNA origami maintain their structural integrity as molecular breadboards in the presence of high concentrations of chemical denaturants.
Therefore, we have exposed 2D DNA origami triangles as designed by Rothemund1 to buffers containing different concentrations of urea or GdmCl and monitored their structural integrity in dependence of temperature. These triangular DNA origami are structurally more rigid than many other 2D DNA origami designs and feature only a few exposed base pairs which reduces their tendency to aggregate.1 The DNA origami triangles thus represent well-suited platforms for single-molecule experiments.7,29–34 Melting curves of the DNA origami were recorded by fluorimetry to report on global melting of DNA origami while atomic force microscopy (AFM) was employed to visualize nanoscale alterations in the DNA origami superstructure. We find that the DNA origami are stable at room temperature in both denaturants at concentrations as high as 6 M. At elevated temperatures, however, DNA origami degradation is observed with the bridging staples that connect the trapezoidal domains being most susceptible toward a denaturant attack. Importantly, our results reveal that the structural integrity of DNA origami depends crucially on variations in the melting temperature of the individual staple strands. Therefore, the global melting temperature of the DNA origami as measured by bulk fluorimetry does not represent an accurate measure of DNA origami stability. By rational design of the arrangement and lengths of the individual staple strands used for the folding of a particular shape, however, the structural stability of DNA origami may be tailored toward specific applications. Taking into account their stability at room temperature, the triangular DNA origami can be readily employed as platforms in the study of biomolecular processes that rely on the presence of chaotropic denaturants, e.g. single-molecule protein folding studies using urea or GdmCl as denaturing agents.
Results and discussion
In the first set of experiments, we probed the stability of DNA origami in the presence of the chemical denaturants urea and GdmCl using thermal melting analysis. To this end, we set out real-time fluorimetric monitoring using SYBR green as a reporter dye whose fluorescence intensity is increased by 1000-fold when bound to dsDNA. This assay reports on dsDNA dissociation as a function of temperature and thus serves as a global probe of DNA origami duplex integrity. Fig. 1 depicts melting profiles of DNA origami triangles in 1× TAE buffer supplemented with 10 mM MgCl2 and varying concentrations of urea (Fig. 1a) and GdmCl (Fig. 1c). An increasing denaturant concentration leads to a decrease in the global melting temperature (Tm) (Fig. 1b and d). In particular, urea lowers Tm from 73 °C at 0 M to 56 °C at 6 M urea. For GdmCl, we observe an even stronger shift down to 37 °C at 6 M GdmCl. Plots of melting temperatures as a function of denaturant concentration reveal a linear decrease in Tm with the denaturant (Fig. 1b and d). Increasing concentrations of urea lower Tm by 2.76 °C M−1, in very good agreement with the reported value of 2.25 °C M−1 observed for genomic dsDNA melting in the absence of Mg2+ ions. Interestingly, GdmCl impacts the global Tm by a decrease of 5.84 °C M−1. From protein unfolding studies, GdmCl is known to be approximately 2–3 times more effective than urea in denaturing proteins depending on the polarity of buried polypeptide residues.35 Such relative effectiveness in global melting apparently also holds true for DNA origami melting by urea and GdmCl. More importantly, our results indicate that DNA origami when exposed to 6 M of either denaturant exhibit substantial stability at moderate temperatures (e.g. room temperature), suggesting that DNA origami maintain their integrity also in the presence of a high denaturant concentration.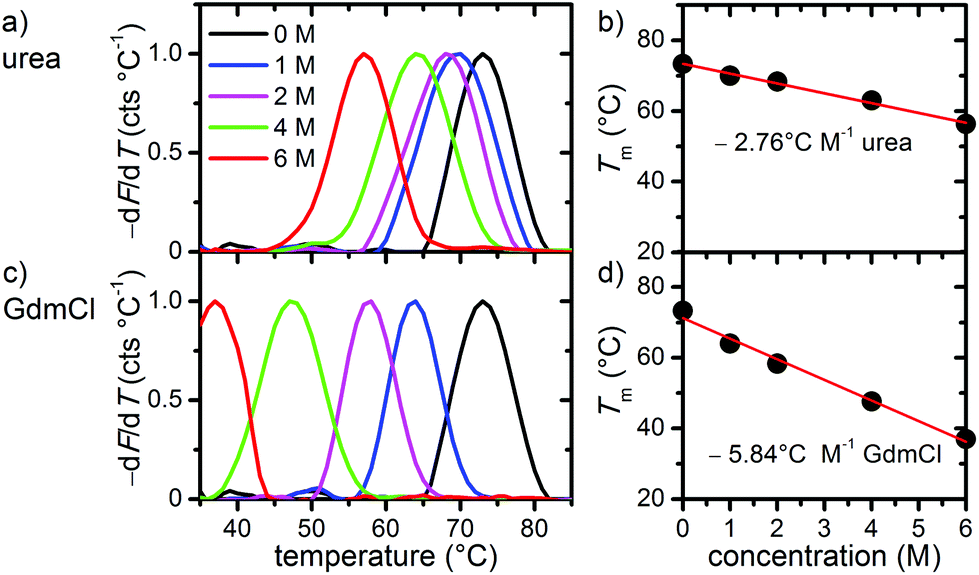 | ||
| Fig. 1 Melting curves (a, c) and extracted melting temperatures Tm (b, d) of triangular DNA origami in different concentrations of urea (a, b) and GdmCl (c, d). The solid lines in (b) and (d) are linear fits to the data. | ||
To investigate the effects of the denaturants on the structural integrity of the DNA origami at a single-molecule level, AFM has been employed. Fig. 2 shows AFM images of the DNA origami triangles after 1 h incubation in solution at different concentrations of urea and at different temperatures. At 23 °C, structurally intact triangles are observed for all urea concentrations ranging from 1 M to 6 M. At 30 °C incubation temperature, intact DNA origami triangles are observed up to a urea concentration of 4 M. For 6 M urea, however, some of the DNA origami are noticeably damaged. Although the original triangular shape can still be recognized, most of the triangles have been disrupted at the corners (see zoomed images in the right column). At 37 °C and in 6 M urea, the overall shape of the DNA origami is completely destroyed and adopts a somewhat molten topology that in few cases still resembles a (strongly distorted) triangular shape. Increasing the incubation temperature to 42 °C leads to further degradation of the DNA origami in 6 M urea. Under these conditions, the formerly triangular structures appear crumpled without any similarity to the original shape. Note that the observed structures are still composed of dsDNA since single strands cannot be resolved by AFM. At lower urea concentrations, however, the DNA origami are still intact at 42 °C.
 | ||
| Fig. 2 AFM images of DNA origami triangles after 1 h incubation in urea at different concentrations and temperatures. Overview images and zooms have a size of 1 × 1 and 0.2 × 0.2 μm2, respectively. Height scales are 2.3 nm. | ||
In the case of GdmCl (Fig. 3), we observe similar trends as for urea, i.e., the DNA origami are stable in 1 M and 2 M GdmCl up to at least 42 °C. At 4 M GdmCl, the first partially degraded DNA origami are observed at 37 °C. Although the damaged DNA origami still have their triangular shape after exposure to GdmCl, the connections between the three trapezoids that comprise the triangle are broken. At 42 °C, some of the DNA origami cannot maintain their triangular shape and collapse.
 | ||
| Fig. 3 AFM images of DNA origami triangles after 1 h incubation in GdmCl at different concentrations and temperatures. Overview images and zooms have a size of 1 × 1 and 0.2 × 0.2 μm2, respectively. Height scales are 2.3 nm. | ||
Interestingly, most of the collapsed structures still consist of three intact trapezoids that are still connected to each other, similar to the type of damage observed in 6 M urea at 30 °C. For a concentration of 6 M GdmCl, DNA origami degradation already starts at 30 °C, however DNA origami are still structurally intact at 23 °C. At 37 °C, all the triangles are completely disintegrated with the trapezoids having lost their structural integrity and the DNA origami appear shredded. At 42 °C, the DNA origami shrink into irregular structures and appear to have lost a significant amount of material.
The melting curve for 6 M urea shown in Fig. 1a yields a mean melting temperature of 56 °C with the low-temperature slope extending down to about 45 °C. Hence, one would not expect any pronounced effect on the DNA origami structure at incubation temperatures below 40 °C. In contrast, however, the AFM images reveal significant structural degradation already at 30 °C, although the DNA origami tend to maintain their original shape (Fig. 2). Most likely, this discrepancy originates from local variations in the melting temperatures of the individual staple strands in the DNA origami, which have been reported to exhibit a broad distribution of melting temperatures.36,37 A significant fraction of the staple strands with the lowest melting temperatures will therefore dehybridize from the scaffold already well below the global melting temperature of the DNA origami (note the definition of the melting temperature as the temperature at which 50% of the duplexes have dehybridized and exist as single strands). The other strands remain largely in place but are unable to preserve the overall shape of the DNA origami. With increasing temperature, more staple strands dehybridize from the scaffold until the entire structure collapses.
In this context, it is particularly interesting that both denaturants seem to preferentially attack the corners of the triangles and induce the breakage of the connections between the individual trapezoids (cf. Fig. 2 and 3). From a structural point of view, these corners have some peculiar features1 (see inset in Fig. 4) that may be responsible for this effect. First, each trapezoid is composed of nine parallel double helices. Therefore, the corners of the triangle are the only sites that exhibit exposed base pairs. Second, each trapezoid is connected to the other two via one scaffold crossover and four bridging staple strands. Due to residual twist strain, each trapezoid will adopt a curved shape in solution, so that these bridges may experience significant mechanical stress. Third, in order to account for the different gaps between the helices of neighboring trapezoids, three of the bridging staples feature up to three unpaired thymines. Furthermore, a closer inspection of the bridging staples reveals that those are the shortest staples in the entire DNA origami triangle with a (hybridized) length of 22 nucleotides (nt). Thus, these staples can be expected to have rather low melting temperatures.
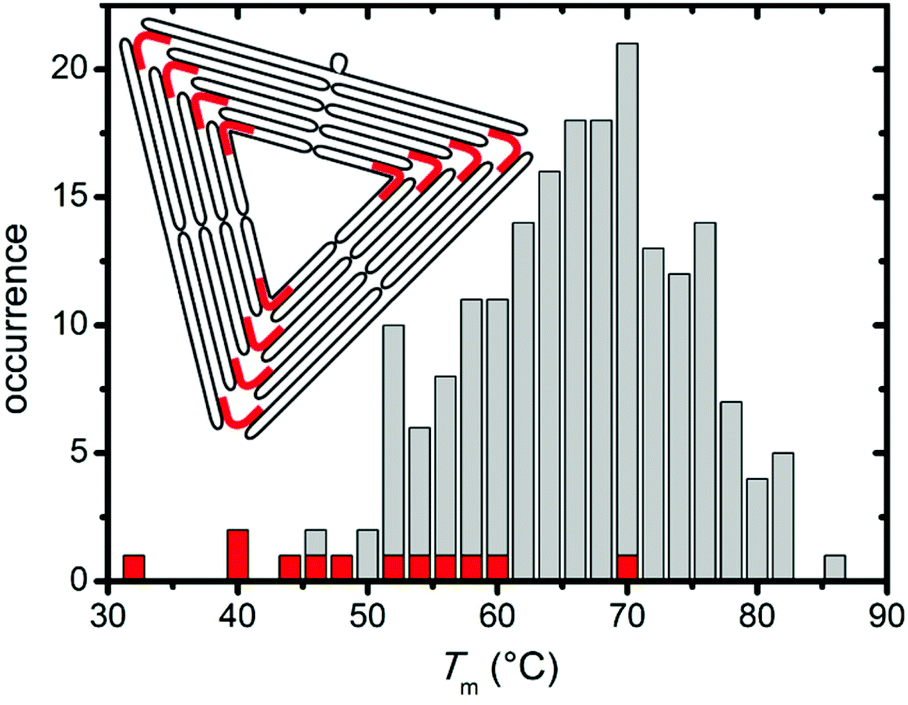 | ||
| Fig. 4 Melting temperature distributions of trapezoids (grey) and bridging staples (red), respectively. The inset schematically shows the folded scaffold (black) in the triangular DNA origami and highlights the positions of the 12 bridging staples (red). | ||
In order to further elucidate the role of the bridging staples, we have calculated the melting temperatures of all staple strands in the DNA origami triangle using the DINAMelt web server38 in the absence of denaturants. For simplicity, each staple strand has been treated as a single continuous hybridization domain in these calculations. In the assembled DNA origami, however, each staple strand consists of at least two independent segments that hybridize with spatially separated complementary sequences of the scaffold. The resulting Tm distribution in Fig. 4, therefore, represents only a coarse approximation which agrees surprisingly well with the fluorimetric melting curve in Fig. 1. Indeed, Fig. 4 reveals that while virtually all trapezoid staples have calculated melting temperatures between 45 °C and 85 °C, four of the twelve bridging staples have melting temperatures below 45 °C with the lowest melting temperature being only 32.6 °C (see Table S1 in the ESI†). These calculations support our observation that the denaturants first compromise the stability of the corners of the triangles before degrading the trapezoids.
In comparison with the distribution in Fig. 4, narrower Tm distributions were previously reported for a rectangular DNA origami design.36,37 In particular, no staple strands with melting temperatures below 50 °C were identified in the rectangular DNA origami. Therefore, we speculate that these rectangular DNA origami exhibit a sharper denaturation transition at higher temperatures than the triangles. On the other hand, our results suggest that the stability of the DNA origami triangles in the presence of urea and GdmCl can be further enhanced by rational redesign of the bridging staples.
Statistical analysis of the AFM images allows further quantification of the denaturant effects. Fig. 5 and 6 show the relative occurrence of intact, structurally compromised, and heavily damaged DNA origami after incubation with urea and GdmCl, respectively. In this context, intact refers to DNA origami with an evidently uncompromised triangular shape. Structurally compromised refers to DNA origami nanostructures which still have a clear triangular shape that is, however, visibly compromised, e.g., in the form of partially disconnected trapezoids. Heavily damaged, on the other hand, refers to DNA origami that have lost their original triangular shape as observed for instance in Fig. 2 and 3 at 6 M concentration and temperatures of 37 °C and 42 °C. This category also includes DNA origami fragments that are sometimes observed even in the absence of denaturing agents. Below 6 M urea, we observe that the vast majority, i.e., 80–100%, of the DNA origami are intact, even at 42 °C (Fig. 5). At 6 M urea, DNA origami remain intact at 23 °C while at higher temperatures, a significant fraction of structurally compromised and damaged DNA origami is found. At 30 °C, the fractions of structurally compromised and heavily damaged DNA origami both increase to approximately 25% each. At 37 °C and 42 °C, all DNA origami nanostructures are heavily damaged without any intact or even compromised structures present.
 | ||
| Fig. 5 Relative fractions of intact, structurally compromised, and heavily damaged DNA origami after 1 h incubation with urea at different concentrations and temperatures. | ||
 | ||
| Fig. 6 Relative fractions of intact, structurally compromised, and heavily damaged DNA origami after 1 h incubation with GdmCl at different concentrations and temperatures. | ||
The statistical analysis in Fig. 6 reveals that DNA origami remain stable at 23 °C up to 6 M GdmCl. Nevertheless, at elevated temperatures, GdmCl damages the DNA origami at much lower concentrations than urea. Already at 1 M GdmCl and 42 °C, about 25% of the DNA origami are structurally compromised or heavily damaged. This tendency is further substantiated in 2 M GdmCl, and in the presence of 4 M GdmCl almost 50% of the DNA origami are structurally compromised at 37 °C. At 42 °C, we find almost equal fractions of intact, structurally compromised, and heavily damaged DNA origami. The harshest conditions of 6 M GdmCl result in a fraction of structurally compromised DNA origami peaking at 30 °C, while at 37 °C and 42 °C, only heavily damaged DNA origami are observed. The shift of visible DNA origami degradation to lower concentrations in comparison with urea denaturation agrees qualitatively with the stronger decrease of the melting temperature per molar GdmCl observed in Fig. 1.
Comparing the ensemble melting curves for the two different denaturants in Fig. 1, we can identify a similar melting temperature Tm ≈ 57 °C for DNA origami in 6 M urea or 2 M GdmCl. Hence, one would expect that the DNA origami exhibit also a similar degree of structural degradation under these conditions. However, both, the corresponding AFM images in Fig. 2 and 3 and the statistical evaluations in Fig. 5 and 6, reveal striking differences which indicate different mechanisms of action. In the case of 6 M urea, incubation at 37 °C results in the complete destruction of all DNA origami nanostructures in the sample (cf. Fig. 5). For 2 M GdmCl at the same temperature, however, more than 70% of intact origami are observed (cf. Fig. 6). The reason for this enhanced structural stability in the stronger denaturant may originate from the ionic nature of GdmCl which, at such high concentrations, could stabilize the superstructure of the DNA origami.
In the above experiments, the DNA origami remained largely intact even at denaturant concentrations of 6 M at 23 °C temperature. In order to evaluate their long-term stability under these conditions, we have extended the incubation times up to 24 h (see ESI Fig. S2†). In the case of 6 M urea, the relative fractions of intact, structurally compromised, and heavily damaged DNA origami remain constant also at longer incubation times, with the fraction of intact DNA origami fluctuating around 85% (Fig. 7). For incubation with 6 M GdmCl, however, the fraction of intact DNA origami decreases from 97% after 1 h incubation to 78% after 6 h. Longer incubation times result in a saturation of the fraction of intact DNA origami at about 73% (Fig. 7). Although these results show that the GdmCl attack occurs on a rather long time scale, the vast majority of DNA origami nanostructures remain intact also for extended periods of time, thereby enabling long-term experiments with DNA origami substrates under strongly denaturing conditions.
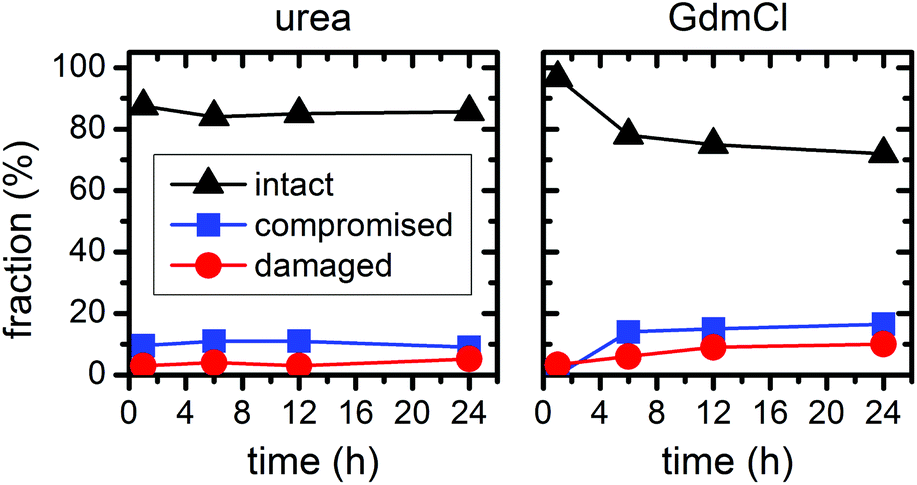 | ||
| Fig. 7 Relative fractions of intact, structurally compromised, and heavily damaged DNA origami after incubation with 6 M urea and GdmCl, respectively, at 23 °C and increasing incubation times. | ||
Conclusions
In summary, we have investigated the stability of the triangular DNA origami design by Rothemund1 in the presence of two chaotropic denaturants by fluorimetry and AFM. Exposure to both, urea and GdmCl, leads to a reduction of the melting temperature of the DNA origami. For urea, we observed in ensemble experiments a reduction by 2.76 °C M−1, while GdmCl leads to a reduction by 5.84 °C M−1. Strikingly, a comparison of the fluorimetry and single-molecule AFM data showed that the global melting temperature is not an adequate measure of the DNA origami's structural integrity. The latter strongly depends on the distribution of the melting temperatures of the individual staple strands. For the DNA origami triangle, we found that the bridging staples connecting the trapezoids have comparatively low melting temperatures and thus are particularly sensitive toward denaturant attacks. The dehybridization of these bridging staples leads to the collapse of the triangular shape with the trapezoids remaining largely intact. Thus, pure ensemble melting curve measurements tend to overestimate the stability of the DNA origami nanostructures.At a given temperature, different degrees of structural damage were observed for urea and GdmCl concentrations that result in almost identical melting curves. Although GdmCl has a stronger effect on the global melting temperature, its attack results in less structural damage than observed for urea, indicating a structural stabilization due to its ionic nature.
At concentrations up to 6 M, the triangular DNA origami are stable for at least 24 h in both denaturants at room temperature. At 4 M concentrations, the window of stability extends to temperatures between 30 °C and 37 °C, while at 2 M concentrations, the DNA origami remain largely intact up to temperatures of 42 °C. DNA origami stability may, however, be further enhanced, for instance by photo-cross-linking39 or by rational redesign of the bridging staples toward higher melting temperatures. Hence, the compatibility of DNA origami nanostructures with high concentrations of denaturing agents qualifies them for numerous applications including single-molecule protein folding studies.
Materials and methods
DNA origami synthesis
The triangular DNA origami were synthesized as previously described.30 Briefly, the 7249 bp long M13mp18 genome (Tilibit) was folded by thermal annealing into the triangular shape using 208 staple strands (Metabion and Biomers) with lengths ranging from 22 to 43 nt in 1× TAE buffer (Calbiochem) containing 10 mM MgCl2 (Sigma-Aldrich). After assembly, origami were purified by centrifugal filtration (Amicon Ultra, 100K, Millipore) and washing with 1× TAE/Mg2+ to remove excess staple strands.Fluorimetric melting curve analysis
Melting profiles of DNA origami in urea (Roth) and GdmCl (Thermo Fisher) were obtained in a SYBR green fluorimetric assay adapted from reported procedures.40 Series of 1× TAE/Mg2+-buffered solutions with increasing denaturant concentrations (0 M, 1 M, 2 M, 4 M, 6 M) containing DNA origami at a final concentration of 1 nM were supplemented with 1 μM SYBR green I (Lonza). Reaction mixtures were subjected to temperature ramping from 35 °C to 90 °C at a rate of 0.2 °C min−1 (1 °C every 5 min) while simultaneously monitoring SYBR green fluorescence using a real-time PCR system (PikoReal, Thermo Fisher). Melting curves displaying peaks corresponding to the melting temperature Tm were generated by plotting the negative first derivative of the change in the fluorescence signal (−dF/dT) as a function of temperature T. Differentiation was performed in Origin (OriginLab) with a Savitzky–Golay smoothing function using second order polynomial regression and a moving window size of ten data points.41 Melting curves were amplitude-normalized and slope-corrected for signal changes unrelated to DNA melting by a baseline-correction routine in Origin (see also ESI Fig. S1†).AFM imaging
Urea and GdmCl stock solutions with four different concentrations (1 M, 2 M, 4 M, and 6 M) were prepared with 1× TAE/Mg2+. DNA origami triangles (5 nM) were incubated in these stock solutions for 1–24 h at four different temperatures (23 °C, 30 °C, 37 °C, 42 °C) using a thermocycler Primus 25 advanced (PEQLAB). After incubation, 5 μL of DNA origami sample were mixed with 50 (1 M and 2 M denaturant concentrations) or 100 μl (4 M and 6 M denaturant concentrations) of 1× TAE/Mg2+ buffer and adsorbed on freshly cleaved mica for 15 minutes. Due to the viscosity of the denaturing agents at high concentrations, the samples were diluted stronger for 4 M and 6 M concentrations and the adsorption time on mica was extended to 30 minutes. The immobilized DNA origami were washed carefully with plenty of ultrapure water and dried in a stream of ultrapure air for AFM imaging. The images were obtained in intermittent contact mode with an Agilent 5100 AFM and HQ:NSC18/Al BS cantilevers (MikroMasch). For the statistical analyses, up to 496 individual DNA origami have been evaluated for each experimental condition.Acknowledgements
We thank C. Kielar, S. Song, Y. Yang and K. Hunold for assistance. This work was supported by the Deutsche Forschungsgemeinschaft DFG under grant numbers KE 1944/2-1 (to A. K.) and SCHL 1896/3-1 (to M. S.), the German Federal Ministry of Education and Research BMBF 03Z2EN11 and 03Z2ES1 (to M. S.) and a scholarship by the Stipendienstiftung Rheinland-Pfalz (to G. K.).References
- P. W. K. Rothemund, Nature, 2006, 440(7082), 297 CrossRef CAS PubMed.
- A. Kuzyk, R. Schreiber, Z. Fan, G. Pardatscher, E.-M. Roller, A. Högele, F. C. Simmel, A. O. Govorov and T. Liedl, Nature, 2012, 483(7389), 311 CrossRef CAS PubMed.
- A. Samanta, Z. Deng and Y. Liu, Nanoscale, 2014, 6(9), 4486 RSC.
- D. Wang, S. L. Capehart, S. Pal, M. Liu, L. Zhang, P. J. Schuck, Y. Liu, H. Yan, M. B. Francis and J. J. de Yoreo, ACS Nano, 2014, 8(8), 7896 CrossRef CAS PubMed.
- C. Steinhauer, R. Jungmann, T. L. Sobey, F. C. Simmel and P. Tinnefeld, Angew. Chem., Int. Ed., 2009, 48(47), 8870 CrossRef CAS PubMed.
- T. Yamazaki, J. G. Heddle, A. Kuzuya and M. Komiyama, Nanoscale, 2014, 6(15), 9122 RSC.
- A. Keller, J. Rackwitz, E. Cauët, J. Liévin, T. Körzdörfer, A. Rotaru, K. V. Gothelf, F. Besenbacher and I. Bald, Sci. Rep., 2014, 4, 7391 CrossRef CAS PubMed.
- A. Rajendran, M. Endo, K. Hidaka and H. Sugiyama, Angew. Chem., Int. Ed., 2014, 53(16), 4107 CrossRef CAS PubMed.
- I. Bald and A. Keller, Molecules, 2014, 19(9), 13803 CrossRef PubMed.
- A. Rajendran, M. Endo and H. Sugiyama, Angew. Chem., Int. Ed., 2012, 51(4), 874 CrossRef CAS PubMed.
- S. Woo and P. W. K. Rothemund, Nat. Commun., 2014, 5, 4889 CrossRef CAS PubMed.
- J. Hahn, S. F. J. Wickham, W. M. Shih and S. D. Perrault, ACS Nano, 2014, 8(9), 8765 CrossRef CAS PubMed.
- T. Gerling, K. F. Wagenbauer, A. M. Neuner and H. Dietz, Science, 2015, 347(6229), 1446 CrossRef CAS PubMed.
- H. Kim, S. P. Surwade, A. Powell, C. O'Donnell and H. Liu, Chem. Mater., 2014, 26(18), 5265 CrossRef CAS.
- Z. Jiang, S. Zhang, C. Yang, J. Kjems, Y. Huang, F. Besenbacher and M. Dong, Nano Res., 2015, 8(7), 2170 CrossRef CAS.
- D. Wang, Z. Da, B. Zhang, M. A. Isbell, Y. Dong, X. Zhou, H. Liu, J. Y. Y. Heng and Z. Yang, RSC Adv., 2015, 5(72), 58734 RSC.
- J. B. Knudsen, L. Liu, A. L. Bank Kodal, M. Madsen, Q. Li, J. Song, J. B. Woehrstein, S. F. J. Wickham, M. T. Strauss, F. Schueder, J. Vinther, A. Krissanaprasit, D. Gudnason, A. A. A. Smith, R. Ogaki, A. N. Zelikin, F. Besenbacher, V. Birkedal, P. Yin, W. M. Shih, R. Jungmann, M. Dong and K. V. Gothelf, Nat. Nanotechnol., 2015, 10(10), 892 CrossRef CAS PubMed.
- M. Liber, T. E. Tomov, R. Tsukanov, Y. Berger and E. Nir, Small, 2015, 11(5), 568 CrossRef CAS PubMed.
- H. Tateishi-Karimata and N. Sugimoto, Nucleic Acids Res., 2014, 42(14), 8831 CrossRef PubMed.
- B. Schuler and H. Hofmann, Curr. Opin. Struct. Biol., 2013, 23(1), 36 CrossRef CAS PubMed.
- A. Gietl, P. Holzmeister, D. Grohmann and P. Tinnefeld, Nucleic Acids Res., 2012, 40(14), e110–e110 CrossRef CAS PubMed.
- R. Tsukanov, T. E. Tomov, Y. Berger, M. Liber and E. Nir, J. Phys. Chem. B, 2013, 117(50), 16105 CrossRef CAS PubMed.
- R. Tsukanov, T. E. Tomov, R. Masoud, H. Drory, N. Plavner, M. Liber and E. Nir, J. Phys. Chem. B, 2013, 117(40), 11932 CrossRef CAS PubMed.
- G. Krainer, A. Hartmann and M. Schlierf, Nano Lett., 2015, 15(9), 5826 CrossRef CAS PubMed.
- A. Borgia, P. M. Williams and J. Clarke, Annu. Rev. Biochem., 2008, 77, 101 CrossRef CAS PubMed.
- A. Hartmann, G. Krainer, S. Keller and M. Schlierf, Anal. Chem., 2015, 87(22), 11224 CrossRef CAS PubMed.
- L. J. Nordstrom, C. A. Clark, B. Andersen, S. M. Champlin and J. J. Schwinefus, Biochemistry, 2006, 45(31), 9604 CrossRef CAS PubMed.
- J. R. Hutton, Nucleic Acids Res., 1977, 4(10), 3537 CrossRef CAS PubMed.
- J. Chao, P. Zhang, Q. Wang, N. Wu, F. Zhang, J. Hu, C. H. Fan and B. Li, Nanoscale, 2016, 8(11), 5842 RSC.
- A. Keller, I. Bald, A. Rotaru, E. Cauët, K. V. Gothelf and F. Besenbacher, ACS Nano, 2012, 6(5), 4392 CrossRef CAS PubMed.
- A. Keller, J. Kopyra, K. V. Gothelf and I. Bald, New J. Phys., 2013, 15(8), 83045 CrossRef.
- J. Prinz, C. Heck, L. Ellerik, V. Merk and I. Bald, Nanoscale, 2016, 8(10), 5612 RSC.
- J. Prinz, B. Schreiber, L. Olejko, J. Oertel, J. Rackwitz, A. Keller and I. Bald, J. Phys. Chem. Lett., 2013, 4(23), 4140 CrossRef CAS.
- S. Vogel, J. Rackwitz, R. Schürman, J. Prinz, A. R. Milosavljević, M. Réfrégiers, A. Giuliani and I. Bald, J. Phys. Chem. Lett., 2015, 6(22), 4589 CrossRef CAS PubMed.
- R. F. Greene and C. N. Pace, J. Biol. Chem., 1974, 249(17), 5388 CAS.
- A. Kopielski, A. Schneider, A. Csáki and W. Fritzsche, Nanoscale, 2015, 7(5), 2102 RSC.
- J. Song, J.-M. Arbona, Z. Zhang, L. Liu, E. Xie, J. Elezgaray, J.-P. Aime, K. V. Gothelf, F. Besenbacher and M. Dong, J. Am. Chem. Soc., 2012, 134(24), 9844 CrossRef CAS PubMed.
- N. R. Markham and M. Zuker, Nucleic Acids Res., 2005, 33(Web Server issue), W577–W581 CrossRef CAS PubMed.
- A. Rajendran, M. Endo, Y. Katsuda, K. Hidaka and H. Sugiyama, J. Am. Chem. Soc., 2011, 133(37), 14488 CrossRef CAS PubMed.
- C. E. Castro, F. Kilchherr, D.-N. Kim, E. L. Shiao, T. Wauer, P. Wortmann, M. Bathe and H. Dietz, Nat. Methods, 2011, 8(3), 221 CrossRef CAS PubMed.
- A. Savitzky and M. J. E. Golay, Anal. Chem., 1964, 36(8), 1627 CrossRef CAS.
Footnotes |
| † Electronic supplementary information (ESI) available: Melting curves without baseline subtraction, AFM images of DNA origami after 24 h incubation, calculated melting temperatures of all staple strands. See DOI: 10.1039/c6nr00835f |
| ‡ These authors contributed equally to this work. |
| This journal is © The Royal Society of Chemistry 2016 |