Effect of different morphologies on slow crack growth of high-density polyethylene
Yuxi Pan,
Xueqin Gao*,
Zhongwu Wang,
Jun Lei,
ZhongMing Li and
KaiZhi Shen
Department of Polymer Science and Materials, State Key Laboratory of Polymer Materials Engineering, Sichuan University, Chengdu 610065, China. E-mail: gxqsnow@163.com
First published on 26th February 2015
Abstract
With the wide application of polymer pipes in the world, people pay more attention to the longevity of the pipes. Slow crack growth is one of the most important factors that influence the longevity of materials, especially PE pipes. Thus, the study of slow crack growth has become deep and concrete. In this paper, slow crack growth in specimens with different morphologies was studied. A self-designed oscillatory shear injection molding (OSIM) device was utilized to prepare pure HDPE 5000s specimens with different morphologies. The process of slow crack growth in OSIM specimens was compared with that in specimens prepared by conventional injection molding (CIM); so it was possible to study the influence of the different morphologies in specimens on the process of slow crack growth under the same external conditions. Different morphologies have great influences on the ability of materials to resist slow crack growth. The time taken for the slow crack growth to fracture in the OSIM specimens is considerably longer than that in the conventional ones. Under the same conditions of 80 °C and 9.0 MPa, the time of complete fracture is 650 min in OSIM specimens, in contrast to 60 min in conventional specimens. Moreover, in the OSIM specimens, the initial stress of the brittle–ductile transition is increased. At 80 °C, the brittle–ductile transition takes place at 4.7 MPa for conventional specimens, whereas for OSIM specimens, it occurs at 5.6 MPa. Furthermore, the mechanisms of their slow crack growth processes are different. The SCG process in conventional specimens is that stress concentration initiates craze, which grows rapidly and becomes a crack. However, the process in OSIM specimens is a cyclic process, in which stress concentration initiates craze, the crack grows, a new craze appears, and the new crack grows until the specimens fracture.
Introduction
In contrast to metal pipes, polymer pipes have a combination of useful properties such as lightness, low density, corrosion resistance, good longevity, and they are easy to transport;1 thus, polymer pipes have nearly replaced metal pipes under certain critical working pressure. The brittle failure of polymer pipes due to slow crack growth (SCG) under low stress has gradually attracted public attention.2,3The present research into the fracture mechanics of SCG has shown that the process has two phases. The first phase is the induction period, when stress concentrates in a defect in the material or at the tip of a crack or craze. A material with a large amount of voids and a fibrillar structure is formed in this phase. The second phase is crack growth, during which the microfiber formed in the polymer is snapped and it appears as a crack.4
Huang and Brown discovered that the tie molecules (molecules joining two or over lamellae) make the disentanglement of a polymer difficult, and enhance the resistivity of polymer to SCG.5 The other properties of a polymer that can enhance the resistivity to disentanglement of tie molecules or increase the number of tie molecules include molecular weight, crystalline perfection and the space between the lamellae. All these properties have an impact on the resistivity of a polymer to SCG. Perfect crystallization and a small distance between the lamellae can enhance the resistivity of polymer to SCG.6,7 A high molecular weight and a narrow molecular weight distribution endows polymer with a good resistivity to SCG. Lu Xici8 found that 1.5 × 10⁵ is the critical value for estimating whether a polymer has resistivity to SCG. Huang and Brown also found that the number of tie molecules increase with the increase of the distributions of short-chain branches.9,10 Ludwig et al.11 found that a new bimodal PE-HD material with a broad bimodal molecular-weight distribution and a favorable short-chain branch distribution has superior mechanical properties and ESCR. While explaining the bimodal PE-HD, an entangled tie molecule density can be taken into account when the calculated tie-molecule densities fail. Moreover, Men et al.12 found that the craze fibril length is the determining factor for the PE pipe lifetime, and the mobility of the amorphous phase can control the amount of materials that are sucked into the craze fibrils.
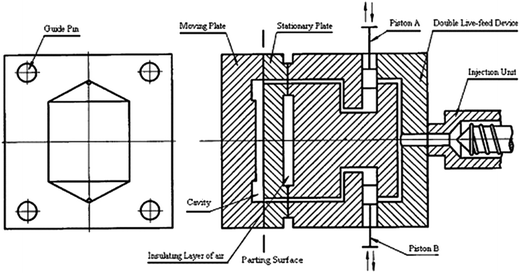
In this paper, we utilized the technology of oscillatory shear injection molding, exploited by improving the multiple gating devices formed by Prof. Shen Kaizhi.13,14 The key of the technology is that two vibratory plungers, driven by a hydraulic cylinder, are installed into a hot runner manifold of the mold. We can accurately control the temperature of the melt and give the melt better plastication using this technology. Test experiments indicated that using this device, the tensile strength and the modulus of HDPE had greatly improved (from 23 MPa to 93 MPa and 1 GPa to 5 GPa, respectively). Analysis experiments indicated that the samples prepared by this technology have a shish-kebab structure with more perfect crystallization and obvious molecular orientation along the flow direction. We also found microfibers during morphological research. For better investigation of the influence of the morphology on the resistivity of HDPE to SCG, we employed HDPE 5000s, which has few short-chain branches.
In this paper, we hope to enhance the resistivity of HDPE to SCG through the method of preparing special morphology samples by OSIM, increase the longevity of polymers and find the rules of slow crack growth.
Experimental section
Materials
High density polyethylene (HDPE), 5000s of density 0.951 g cm−3 with MFR (GB3682-89) of 0.8–1.2/10 min was obtained from Chinese Lanzhou petrochemical company. TX-10, as the surfactant, was used to expedite the slow crack growth process.Facilities
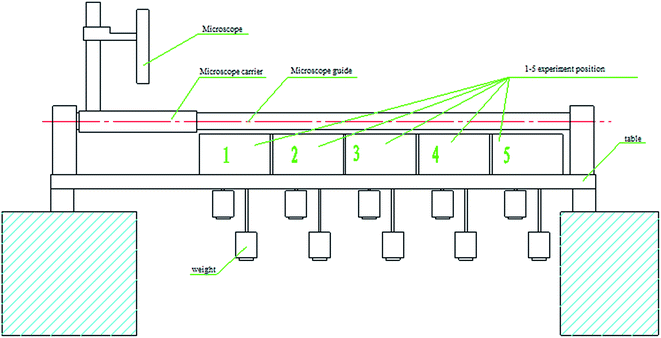
A plastic injection molding machine was obtained from Haitian Rubber Ltd., Ningbo. A scanning electron microscope (SEM), S-450 was obtained from Hitachi, Japan. A differential scanning calorimeter (DSC), Q20 was obtained from TA, America. X'Pert Pro diffractometer was obtained from Philips, Netherlands to study X-ray diffraction (XRD). A tensile machine, Instron 5567, was obtained from Instron, America. A self-designed slow crack growth device and oscillatory shear injection molding are shown in Fig. 1 and 2. The minimum weight applied to the specimens was 0.2 kg, and leverage was used to amplify the tensile stress.Preparation of samples
Pure HDPE was dried in an oven for 6 hours, and then the dried HDPE granules were injected into the plastic injection molding machine. We divided the sample into conventional injection molding (CIM) samples and oscillatory shear injection molding (OSIM) samples. The difference between the two types of samples is that the OSIM samples experienced a reciprocating shearing action in the hot runner during the cooling and packing of the samples. This makes the samples permanently sheared, and then the morphology in the interior of the OSIM samples can be changed. For CIM samples, there is no oscillatory shear during the cooling or packing stage. Other parameters of the process are uniform. All the parameters are shown in Table 1.| Injection pressure (MPa) | Temperature of the melt (°C) | Temperature of the mold (°C) | Vibration interval (s) | Packing pressure (MPa) | Packing time (s) | Vibration pressure (bar) |
|---|---|---|---|---|---|---|
Section 1![[thin space (1/6-em)]](https://www.rsc.org/images/entities/char_2009.gif) : :![[thin space (1/6-em)]](https://www.rsc.org/images/entities/char_2009.gif) 10 10 |
60 | |||||
| 60 | 200 | 45 | 0 | 0 | ||
Section 2![[thin space (1/6-em)]](https://www.rsc.org/images/entities/char_2009.gif) : :![[thin space (1/6-em)]](https://www.rsc.org/images/entities/char_2009.gif) 20 20 |
60 | |||||
| 60 | 200 | 45 | 2.0 | 85 | ||
Section 3![[thin space (1/6-em)]](https://www.rsc.org/images/entities/char_2009.gif) : :![[thin space (1/6-em)]](https://www.rsc.org/images/entities/char_2009.gif) 30 30 |
60 |
After injection, we made a 1.5–1.6 mm notch in the samples, which were 6 mm wide and 4 mm thick (shown in Fig. 3) to make a factitious defect to produce stress concentration.
Experiment
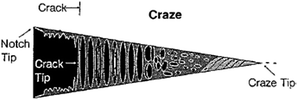
We began the slow crack growth experiment with the samples referred above. The temperature was maintained at 80 °C and 10% TX-10 was added as the surfactant to expedite the slow crack growth process. The initial stress F of the samples in the experiment was different for CIM samples and OSIM samples. We used spring scale to correct the real initial stress loading on the samples. Due to the addition of TX-10, the induction period for the crack was considerably shorter than it would have been under normal conditions, but the process of SCG was the same as under normal conditions. Fig. 4 shows the method that we used to observe and monitor the crack. A–A plane represents the opening of the notch tip, and B–B and C–C planes represent the opening of the craze tip and crack tip, respectively. Fig. 5 presents a schematic of the craze.15 For the accuracy of the experiment, three specimens were tested to study the slow crack growth process for each condition. If experimental data was inconsistent, two specimens were tested to obtain more accurate experimental results.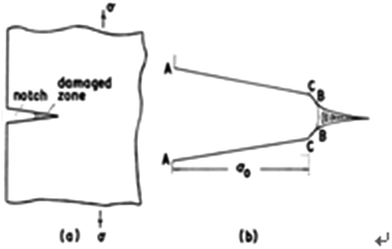 | ||
| Fig. 4 The illustration of the observation process in the experiment and the schematic of the craze. | ||
Results and analysis
Analysis of patterns of crack growth under multifold initial stress
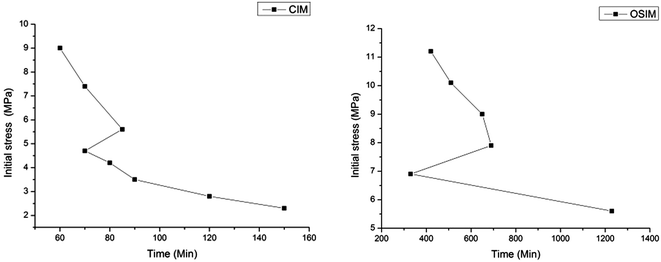
To discover the differences between CIM and OSIM specimens in the SCG process and determine suitable experimental initial stress, we tested the CIM and OSIM specimens under multifold initial stresses. Fig. 6 shows the patterns of crack growth in CIM specimens at 80 °C and multifold initial stresses. It can be discovered that at 80 °C, only the specimens with small initial stress (2.3–3.5 MPa) appear with intact crack growth. With the increase of the initial stress (4.2–4.7 MPa), the fracture manner of the crack transforms from brittle fracture to ductile fracture. With further increase of the initial stress (over 5.6 MPa), the fracture manner of the specimens becomes elastic tensile fracture, which even appears to be plastic tensile deformation.Fig. 7 shows the patterns of the crack growth in OSIM specimens under multifold initial stress for 300 min at 80 °C. We observe that the initial stress can be larger compared with the CIM specimens. Moreover, we can observe intact crack growth even under high initial stress, which indicates that the OSIM specimens have better resistivity to the process of SCG. Under the same conditions of 80 °C and 9.0 MPa as the initial stress, the CIM specimens exhibit complete elastic tensile deformation in 60 min; however, the crack just extends to the middle of the OSIM specimen and the pattern of the crack growth is regular. Obviously, the resistivity of the OSIM specimens to the SCG process is better than that of the CIM specimens, and the practical applications of the OSIM polymer are wide. We analyzed the patterns of crack growth under multifold initial stresses and different test times; we then found that there was a brittle–ductile transition of the fracture manner with the increase of the initial stress, and we obtained the range of the initial stress required to produce the transition. At 80 °C, the range for the CIM HDPE specimens is 4.2–4.7 MPa compared with 6.9–7.9 MPa for the OSIM HDPE specimens. However, after the brittle–ductile transition, partial ductile fracture appears only in the OSIM specimens during the process of SCG, rather than the direct plastic tensile deformation that appears in the CIM specimens. The complete failure time of specimens is shown in Fig. 8; the transition also can be seen on the relationship curve of initial stress and failure time. Under the same initial stresses of 5.6 MPa and 9.0 MPa, the complete failure times are 85 min and 60 min for CIM specimens, whereas for OSIM specimens, the failure times are 1230 min and 650 min. The complete failure time of OSIM specimens far exceeds that of CIM specimens.
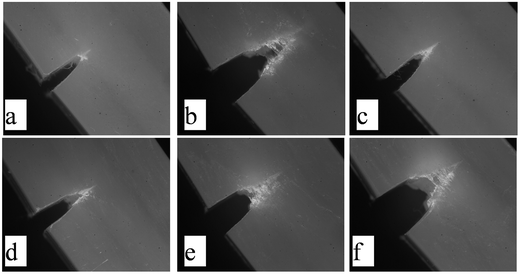 | ||
| Fig. 7 The patterns of the crack growth in OSIM specimens under multifold initial stresses for 300 min at 80 °C ((a) 5.6 MPa; (b) 6.9 MPa; (c) 7.9 MPa; (d) 9.0 MPa; (e) 10.1 MPa; (f) 11.2 MPa). | ||
Analysis of the initial notch and the process of SCG
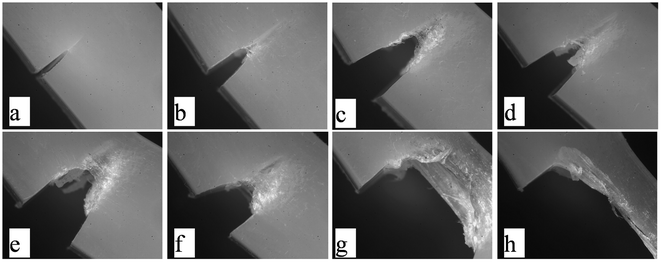
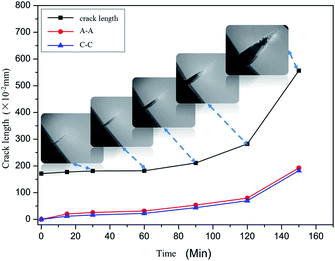
The resistivity of the material to the initial stress decreases as the temperature is increased. Moreover, each section of the SCG becomes more obvious as the initial stress decreases. These obvious sections prove that the crack growth occurs through the SCG process. The experimental initial stress we chose for the CIM specimens was 2.3 MPa because intact slow crack growth occurs under the initial stress of 2.3 MPa, and then we tested the SCG process and observed the variation in the notch.Fig. 9 shows that the process of SCG at 80 °C in CIM HDPE specimens is rapid. We found that each section of the growth of the crack could be seen easily due to the stress concentration in the earlier stage; craze and stress whitening appeared at the end of the notch but the crack length was not changed. On account of the sustained stress in the middle stage, the craze extended to the middle and posterior of the specimens and a crack appeared at the end of the notch, but the crack length was still short. In the later stage, the crack extended rapidly along the direction of the silver lines formed in the middle stage, and the specimens finally failed. When we analysed the pattern of the development of the notch, we found that the values of A–A and C–C increased as the crack extended, and the tendency of the change to the values of A–A and C–C increased in proportion to the development of the crack. (A–A represents the width of the opening of the notch tip and C–C represents the width of the opening of the crack tip). From the form that the crack takes in Fig. 6, we can see that the tip and the end of the crack are nearly in a straight line, indicating that the difference between the value of A–A and C–C is not changed. The process of SCG differs significantly between the high test temperature and the low test temperature. This difference is observed because under high temperature, the motion of molecular chains becomes violent, thus the molecular chains easily disentangle from each other, leading to a decrease in the resistivity of the specimens to the process of SCG.
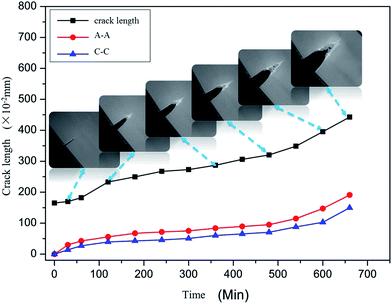
Compared with the CIM specimens, the initial stress that we chose for the OSIM specimens is 7.9 MPa, under which slow crack growth can still occur after the brittle–ductile transition because of the special morphology of OSIM specimens. There is a big difference in the yield strengths of CIM and OSIM specimens (31.01 MPa for CIM specimens and 74.70 MPa for OSIM specimens); therefore, we chose different initial stresses for the two specimens. SCG process would not be valid if we choose 7.9 MPa as the initial stress for the CIM specimens; moreover, if we chose 2.3 MPa as the initial stress for the OSIM specimens, it would take a much longer time for the experiment to be completed. The purpose of our experiment is that the result should be used as a reference to choose and enhance materials by increasing the temperature and initial stress of the test, making a notch and adding surfactant. Fig. 10 shows the transformation of the SCG process and the notch at 80 °C using 7.9 MPa as the initial stress. It can be observed that the mechanisms of the SCG process for the two specimens are different. First, the speed of the crack growth is different. The speed of the crack growth in the OSIM specimens is constant until the failure of the specimens during the whole SCG process, and the crack length is shorter than that in the CIM specimens. Second, in the earlier stage of the crack formation, we did not find a long craze through the middle and posterior of the specimens. A circular process occurs, in which the stress concentration initiates a craze, a crack grows, a new craze appears, a new crack grows, until the cracks compose a macroscopical crack. Finally, the transformation of the notch is different. The flare angle in the CIM specimens is nearly constant, but the angle has a little increase in the earlier stage and an observable increase in the later stage of the SCG process in OSIM specimens. These phenomena indicate that the OSIM specimens have better resistivity to the SCG process.
Although the tests and analyses of the SCG process and the notches in CIM and OSIM specimens take place under different initial stresses, we can find the differences in the functions of fracture in the SCG process in the CIM and OSIM specimens.
Analysis of fracture morphology
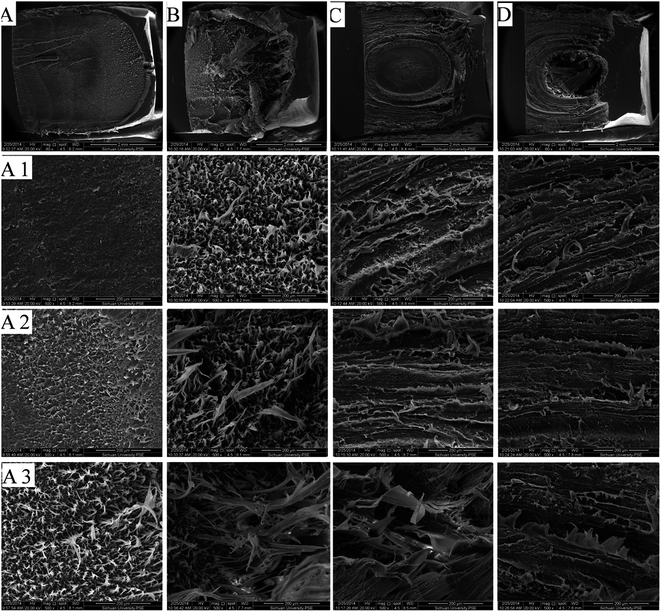
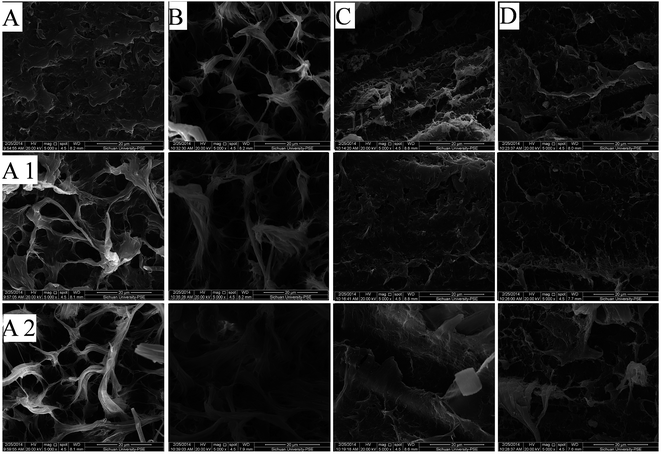
Schemes A and B, presented in Fig. 11, represent the whole fracture morphology in the CIM specimens. Scheme A shows all the sections of CIM specimen fracture under low initial stress (2.3 MPa); it is obvious that it has a long smooth section in the forepart, and each section represents fracture formation in a different time frame. Moreover, the initial stress is higher in Scheme B (5.6 MPa), and the fracture morphology is coarse. The section of brittle fracture at the forepart is very short; plastic tensile deformation appears in the middle section of the crack growth, and it turns to plastic failure in the posterior section.Under the same initial stress of 5.6 MPa, the whole fracture morphology of the OSIM specimen is smooth. The morphology of the fracture is different for specimens with different morphologies. The fractures in the surface and middle layers of the specimen represent laminar fracture, and in the interior of the specimen, a smooth surface appears. Scheme D shows the fracture morphology in the OSIM specimen with the initial stress further increasing to 9.0 MPa. It can be seen that the fracture manner of OSIM specimens shows almost no change with the increasing initial stress, especially the fracture manner in the surface and middle layer. However, plastic failure occurs in the interior of the specimen under high initial stress; this might be attributed to the difference in morphology between the interior and the surface of specimens obtained by the OSIM device. In addition, the crack length of OSIM specimens is different from that of CIM specimens, as shown in Fig. 11. Molecules in the OSIM specimens become highly orientated in the later stage of crack growth and the resistivity to plastic tensile stress is poorer than in the CIM specimens. Thus, the specimens fail directly when the area of thrust surface decreases in proportion to the increase of the stress.
There are different morphologies in Schemes C and D because of the fact that the morphology of the cross profiles of the OSIM specimens are different. Previous researches discovered that a slightly oriented structure formed at the surface of the mold could be maintained due to the quick cooling of the surface of the specimen during the process of OSIM. On account of the opportune speed of cooling and shear with the cooling, a perfectly oriented structure appears in the middle layer of the OSIM specimens. However, in the core of the specimens, most of the specimen is solidified, leading to shear blocking and weak orientation. Different morphologies in the interior molecules will indeed generate a different manner and morphology of crack fracture.
To observe the fracture manner more clearly, we enlarged the images shown in Fig. 11. Fig. 12A shows that the fracture manner in the CIM specimen under low initial stress is a laminar fracture in the earlier stage, toughness tensile deformation in the middle stage of the SCG process and plastic failure as the main fracture manner in the end. A complete plastic failure under high initial stress is shown in Scheme B. For Scheme C, under the same initial stress as Scheme B, the whole crack fracture manner is laminar brittle fracture. Moreover, when we tested specimen D by further increasing the initial stress, it was observed that the fracture manner was not changed, although the initial stress was increased. This is why OSIM specimens can resist higher initial stress under high temperature. In addition, we have discussed the reason why the CIM specimens show such a different performance compared with the OSIM specimens under the same experimental conditions in the following section.
Discussion
To understand the difference in the SCG process between CIM specimens and OSIM specimens, we analyze the cause of crack surface (1.6 mm) and the crack propagation surface (3.0 mm) of the two specimens and discuss the relationship between different morphologies and the process of SCG in different surfaces.Differential scanning calorimetry
The morphology of the injected specimens can be evidenced by thermal analysis. We can obtain information such as the behavior of crystallization and crystalline liquation and the change of micromorphology by subjecting the HDPE specimens to different injection conditions. We tested different surfaces in the injection specimens with DSC in this part, and the degree of crystallinity can be estimated using eqn (1).
 | (1) |
| Specimen (thickness) | Melting peak temperature (°C) | Enthalpy of fusion (J g−1) | Degree of crystallinity (%) |
|---|---|---|---|
| C-1/(1.6 mm) | 132.39 | 155.9 | 53.21% |
| O-1/(1.6 mm) | 132.49, 134.5 | 170.9 | 58.33% |
| C-2/(3.0 mm) | 132.93 | 160.3 | 54.71% |
| O-2/(3.0 mm) | 133.73, 136 | 172.6 | 58.91% |
Two surfaces of CIM specimens are at a single peak in Fig. 13 and the melting point has a little increase from the surface of the specimen with a thickness of 1.6 mm to the specimen with a thickness of 3.0 mm. Because the temperature of the melt during the injection molding is very high and the cooling is slow, the crystal grows perfectly. The melt point of specimens increase after OSIM indicates that the lamella thickness increases or the crystal is more perfect after oscillatory shear. Furthermore, the melting curve shows that OSIM HDPE specimens have two melting peaks in both the surfaces; a different melting peak represents a different structure in the crystal. The melting peak of about 133 °C represents the melting of the PE lamellas, and the melting peak of about 136 °C represents the melting of some oriented structures or the shish-kebab structure. Thus, it can be seen that the oriented structures or the shish-kebab structure are formed in some part of the PE under the condition of the process of oscillatory shear, and the shish-kebab structure has a better heat stability compared with homologous lamellae. These results correspond to the results reported in the literature.
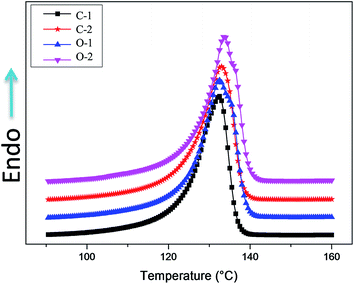 | ||
| Fig. 13 DSC curves of different surfaces (C-CIM specimen, O-OSIM specimen; 1-surface of 1.6 mm, 2-surface of 3.0 mm). | ||
We can determine the degree of crystallinity of the specimens injected under different shearing conditions. The degree of crystallinity of the OSIM specimens is different in different surfaces, but it is much higher than the degree of crystallinity in the CIM specimens.
Discussion on the morphology of the internal structure
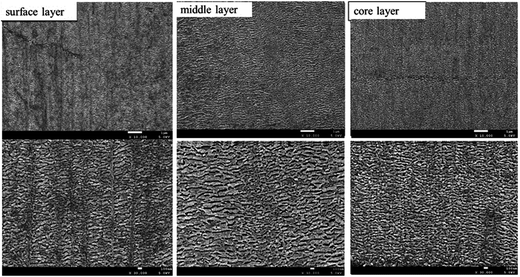
For CIM specimens (Fig. 14), due to temperature gradient and shear gradient generated by friction between the material and the die wall in the molding process, when the plastic melt is injected into the cavity, the surface layer in contact with cavity wall cools quickly, and then a surface layer, which is generally very thin and has little effect on the material, is formed, followed by the retainment of a partially orientated structure induced by shear. Moreover, the melt that is away from the surface layer consequently tends to form a spherulite structure due to the low shear and small temperature gradient, especially under the condition of absence of shear and low temperature near the center of the specimen. As shown in Fig. 15, crystal plates are arranged vertically to the direction of the flow due to the freezing molecular chain, which resulted from the rapid cooling of high temperature polymer melt against the low temperature mold wall. The crystallization of the molecular chain in the core strongly depends on the melting temperature; sufficient relaxation time of molecular chains in the core layer and the ultimate formation of spherulites may attribute to small differences in temperature, low shear gradient and slow melting solidification. Eventually, the morphology of the spherulites formed by the abovementioned process can be depicted as follows: crystal plates spread from a center point to all around it and the spherulite size is enlarged. What affects the mechanical properties of materials are the defects within the materials; the amorphous region between the spherulites is the weakest part in semi-crystalline polymers; moreover, the mechanical properties of the spherulites are also affected by factors such as their shape. For general CIM specimens, the main reason why they present relatively poor mechanical properties may be ascribed to the random entanglement within the amorphous region, despite the high degree of crystallinity.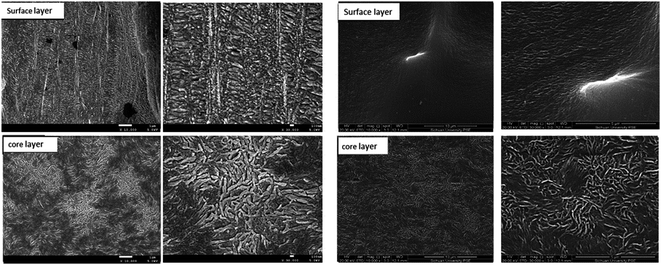 | ||
Fig. 14 SEM images of static specimens (×10![[thin space (1/6-em)]](https://www.rsc.org/images/entities/char_2009.gif) 000; ×30 000; ×30![[thin space (1/6-em)]](https://www.rsc.org/images/entities/char_2009.gif) 000) crack cause surface (1.6 mm, left), and crack growth surface (3.0 mm, right). 000) crack cause surface (1.6 mm, left), and crack growth surface (3.0 mm, right). | ||
The spherulite structure within the specimens is deemed to be the main factor that influences crack initiation speed and crack growth speed during the process of SCG. Generally speaking, slow crack growth is regarded as a process in which terminal chain molecules, branched molecules and tie molecules disentangle from the crystalline region or half crystalline region; the restriction on molecular mobility due to random entanglement between the spherulites is limited.
In the frozen process of OSIM, the melt away from the surface layer cooled under shearing, thus, the orientated and crystallized structures are retained. In the ideal case, oriented structures are obtained from the surface layer to the core layer; thus, the products remain in a vibrational state until the vibrational neutron loses the ability of movement. Nonetheless, in the practical processing of specimens, the plastic melting usually produces a partially orientated and crystallized structure, or a spherulite structure; therefore, the obvious difference between the core layer and the shear layer can be observed immediately from the crack failure section of a dynamic specimen.
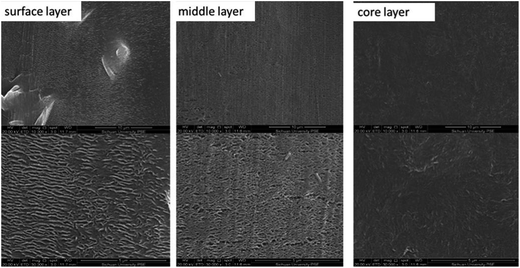
SEM images are carried out to characterize the morphology of cracks caused at the surface of OSIM specimens, as shown in Fig. 15. Because the depth of crack growth surface is 1.6 mm, at this instance, the central part of the surface does not reach to the core layer of the specimen, instead the middle layer appears on the shear layer of the specimen; therefore, the whole orientation structure is nearly integrated. In addition, it is noteworthy for the OSIM specimen that grain refinement on the surface layer and the denser arrangement of crystal plates are precisely induced by the shear action (as shown in Fig. 15).
Hsiao and Han16–19 et al. considered that a portion of chain segments will be out of shape, and a shish-type structure is subsequently formed due to orientation along the flow direction, which is used as a nucleation site to cause the crystallization of the kebab-like structure. Therefore, in the middle layer of the OSIM specimen, the crystal is mainly formed by shish-kebab-like structures. As shown in Fig. 16, the SEM images of the crack growth surface of OSIM specimens are used to investigate the difference between crack cause surfaces and crack growth surfaces. Fig. 16 indicates that the biggest difference can be described as follows: the shear action of the crack growth surface decreases because of the cooling of the surface layer during processing, which induces a smaller shear orientation along the shear direction; thus, the differences in core layer fracture manner on the crack fracture surfaces can be clearly observed. As a result, we can draw a conclusion that differences in the orientation of a structure have a significant effect on crack growth mode. The surface layer and the core layer of the crack growth surface are slightly different from the crack cause surface.
So how does the orientation or the shish-kebab structure affect the crack growth process? In the previous section, we explained that the actual crack growth process can be described as a disentanglement process of terminal chain molecules, branched molecules and tie molecules. The more perfect the crystal structure is, the greater the molecular chain force is; simultaneously, the forming orientation of shish-kebab molecular chains and interlocked structures will significantly increase the amount of tie molecules, which would efficiently prevent tie molecules from slippage, and thus inhibit the disentanglement process. The abovementioned description is the main reason why the crack cause and crack growth processes are very slow for OSIM specimens (Fig. 17).
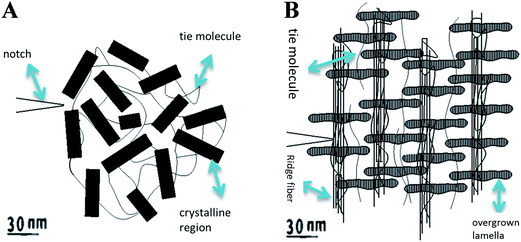 | ||
| Fig. 17 Schematic showing the morphology of internal structure ((A) CIM specimens, (B) OSIM specimens). | ||
Discussion on X-ray diffraction
XRD experiments were conducted with a Philips 3KW X-diffractometer (Netherlands) to characterize the crystalline structure. A graphite curved crystal monochromator and Co Kα1 radiation were used. The tube voltage and current were 45 kV and 40 mA, respectively, with a scanning rate of 0.03° min−1. The scattered intensities were registered in a range of scattering angles 2θ from 15° to 30°. To further investigate the relationship between the inner structure (crystal size and orientation degree of the specimens) inside the specimens under different processing conditions and SCG process, we used XRD to test the crack cause surfaces and crack growth surfaces of CIM specimens and OSIM specimens, respectively.Fig. 18 shows the XRD curves of CIM and OSIM HDPE specimens. Table 3 shows the XRD results of the specimens obtained by XRD analysis software (X'Pert Highscore Plus). Generally, HDPE has four crystal faces, namely, (110), (200), (210), (020), and the angles of the crystal diffraction peaks are 21.55°, 23.89°, 30.01°, and 36.20°,20,21 respectively. On account of the diffracted intensity of crystal faces (210) and (020) being weak, we just analyze the strong diffraction peaks of crystal faces, namely, (110) and (200), in the discussion. We discovered that the diffracted intensity of the (110) direction was considerably stronger than that of the (200). This indicated that the formation of microcrystals in the (110) direction is easier. Diffracted intensity depends on the microcrystal size in the three directions of the crystal and on the number of microcrystals22 based on the theory of XRD intensity. The orientation and the direction of the crystal can be preliminary judged through the ratio of the diffracted intensity of the crystal faces.23 Compared with CIM specimens, for the crack growth surface of OSIM specimens, the diffracted intensity and the ratio of peak height (the ratio of the peak height of 200 and the peak height of 110) of the crystal face are higher. This indicates that the degree of the orientation of crystal faces (110) and (200) of OSIM HDPE specimens changes and the degree of orientation is bigger than that of CIM specimens. For the crystal face (110), the reason why the diffracted intensity of 1.6 mm is bigger than that of 3.0 mm is that shear action is maintained with quick cooling in the surface layer during the injection molding. From the aforementioned SEM image, the better orientation in the crack growth surface of OSIM specimens also can be seen. In addition, for the crack growth surface, the peak widths at half height for OSIM specimens decrease for the crystal faces (110) and (200) compared with those of CIM ones. According to Scherrer equation,24 it can be concluded that crystallite size at the crack growth surfaces of OSIM specimens become greater than that of CIM ones. This might be due to the perfect crystallinity caused by oscillatory shear.
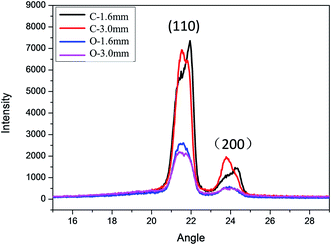 | ||
| Fig. 18 XRD curves of different specimens; (C-CIM specimens, O-OSIM specimens; 1.6 mm is the crack cause surface, 3.0 mm is the crack growth surface). | ||
| Specimen | Crystal face (110) | Crystal face (200) | Peak height ratio | ||||
|---|---|---|---|---|---|---|---|
| 2θ | dhkl | B | 2θ | dhkl | B | ||
| a 2θ-scattering angle; dhkl-interplanar spacing; B-peak width at half height. | |||||||
| C-1.6 mm | 21.5 | 4.1281 | 0.88 | 23.9 | 3.7257 | 0.94 | 0.18 |
| C-3.0 mm | 21.5 | 4.1261 | 0.95 | 23.9 | 3.7211 | 1.18 | 0.17 |
| O-1.6 mm | 21.6 | 4.1132 | 0.88 | 24.0 | 3.7090 | 0.99 | 0.18 |
| O-3.0 mm | 21.5 | 4.1218 | 0.76 | 23.8 | 3.7327 | 0.82 | 0.24 |
Discussion on mechanical properties
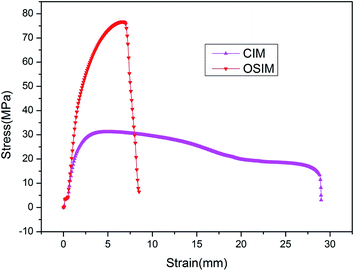
Fig. 19 shows the stress–strain curves of the CIM and the OSIM specimens. The yield strength of the OSIM specimen is considerably higher than that of CIM specimen (31.19 MPa for the CIM specimen and 76.71 MPa for the OSIM specimen), and the modulus of OSIM specimen is also higher (713 MPa for the CIM specimen and 1116 MPa for the OSIM specimen). The reason for this phenomenon is that the yield strength and modulus are increased greatly through orientation and formation of a shish-kebab-like interlocked structure obtained by oscillatory shear during the cooling and packing of the process of OSIM. However, the elongation at the break point of the OSIM specimen decreased a lot because of the high orientation of molecular chains caused by strong oscillatory shear. The low elongation break could cause the easy fracture of products or specimens when the applied stress exceeds the tensile strength. However, under the smaller initial stress, the special morphology obtained via the process of OSIM in the specimens has a great resistivity to the disentanglement of tie molecules in the process of SCG. Moreover, the factors such as perfect crystallization and increased of degree of crystallinity in the OSIM specimens influence the resistivity of the material for SCG process. The process of OSIM not only increases the mechanical strength of the material but also improves the resistivity to the SCG process, and this will further amplify the application range of the materials.Conclusions
(1) The resistivity of OSIM specimens to SCG process is better than that of CIM specimens at a higher temperature (80 °C). Under the same condition of 9.0 MPa initial stress, the time of failure is 650 min for the OSIM specimen compared with 60 min for the CIM specimen.(2) The mechanism of their slow crack growth process is different. The SCG process of CIM specimens involves the initiation of a craze by stress concentration, fast growth of the craze and growth of a crack. However, the process in OSIM specimens is a cyclic process, in which stress concentration initiates a craze, a crack grows, a new craze appears and anew crack grows until the specimens fracture.
(3) The fracture manner of both the CIM and OSIM specimens transforms from brittle fracture to ductile fracture. The initial stress of the transformation can be increased by the OSIM process. In the experiment, the transformation initial stress is 5.6 MPa for the CIM specimens, and it is 7.9 MPa for the OSIM specimens. This will greatly amplify the application range of the materials. After the transformation, CIM specimens will fail quickly but the crack growth will continue for some time in the OSIM specimens.
(4) Special morphology obtained from the technology of oscillatory shear injection molding in the OSIM specimens is the reason why a lot of differences appear in many aspects during the SCG process in CIM and OSIM specimens. For OSIM specimens, a shish-kebab structure and an interlocked crystal structure are formed under the action of the continuous oscillatory shear. The special morphology makes the disentanglement of tie molecules and the slippage of molecular chain difficult, thus improving the resistivity of the material to the SCG process. This is helpful with respect to the practical application of materials.
Acknowledgements
We would like to express our great thanks to the National Natural Science Foundation of China (51033004 and 51121001) for financial support.References
- X. L. Dong, The mechanical fracture of plastics pressure pipe from the perspective of application, New Building Materials, 1999, 10, 11–13.
- X. Sun, Polyethylene Pipe, Chemical Industry Press, 2002, pp. 303–318 Search PubMed.
- Y. Tang, L. J. Bi and Y. L. Li, The influence factors of PE pipes in slow crack propagation, China Synth. Resin Plast., 2003, 20(3), 52–54 CAS.
- X. Sun, Polyethylene Pipe, Chemical Industry Press, 2002, pp. 304–306 Search PubMed.
- X. Lu, R. Qian, A. R. McGhie and N. Brown, The effect of annealing on slow crack growth in an ethylene–hexene copolymer, J. Polym. Sci., Part B: Polym. Phys., 1992, 30(8), 899–906 CrossRef CAS.
- Q. S. Liang and K. Y. Chen, The influence factors and countermeasures of PE pipes in slow crack propagation, Guangdong Chem. Ind., 2009, 11(36), 78–80 Search PubMed.
- Y. L. Huang and N. Brown, Dependence of slow crack growth in polyethylene on butyl branch density: morphology and theory, J. Polym. Sci., Part B: Polym. Phys., 1991, 29(1), 129–137 CrossRef CAS.
- X. Lu, N. Ishikawa and N. Brown, The critical molecular weight for resisting slow crack growth in a polyethylene, J. Polym. Sci., Part B: Polym. Phys., 1996, 34(10), 1809–1813 CrossRef CAS.
- C. J. Plummer, A. Goldberg and A. Ghanem, Micromechanisms of slow crack growth in polyethylene under constant tensile loading, Polymer, 2001, 42(23), 9551–9564 CrossRef CAS.
- G. K. El'yashevich, Structure and long-term mechanical properties of oriented polyethylene, Phys. Solid State, 2005, 47(6), 1020–1027 CrossRef.
- L. L. Bohm, H. F. Enderle and M. Fleifßner, High-density polyethylene pipe resins, Adv. Mater., 1992, 4(3), 234–238 CrossRef.
- Y. F. Men, J. Rieger, H. F. Enderle and D. Lilge, The mobility of the amorphous phase in polyethylene as a determining factor for slow crack growth, Eur. Phys. J. E: Soft Matter Biol. Phys., 2004, 15(4), 421–425 CrossRef CAS PubMed.
- C. M. Wong, C. H. Chen and A. I. Isayev, Flow of thermoplastics in an annular die under parallel oscillations, Polymer Eng. Sci., 1990, 30(24), 1574–1584 CrossRef CAS.
- A. I. Isayev, C. M. Wong and X. Zeng, Flow of thermoplastics in an annular die under orthogonal oscillations, J. Non-Newtonian Fluid Mech., 1990, 34(3), 375–397 CrossRef CAS.
- J. M. Lagarón, G. Capaccio, L. J. Rose and B. J. Kip, Craze morphology and molecular orientation in the slow crack growth failure of polyethylene, J. Appl. Polym. Sci., 2000, 77(2), 283–296 CrossRef.
- C. Zhang, H. Hu, X. Wang, Y. Yao, X. Dong, D. Wang and C. C. Han, Formation of cylindrite structures in shear-induced crystallization of isotactic polypropylene at low shear rate, Polymer, 2007, 48(4), 1105–1115 CrossRef CAS PubMed.
- G. Kalay and M. J. Bevis, Processing and physical property relationships in injection-molded isotactic polypropylene. 2. Morphology and crystallinity, J. Polym. Sci., Part B: Polym. Phys., 1997, 35(2), 265–291 CrossRef CAS.
- F. Zuo, J. K. Keum, L. Yang, R. H. Somani and B. S. Hsiao, Thermal stability of shear-induced shish-kebab precursor structure from high molecular weight polyethylene chains, Macromolecules, 2006, 39(6), 2209–2218 CrossRef CAS.
- D. Y. Hong, The principle, process and technology of PP, China Petrochemical Press, 2002, p. 9 Search PubMed.
- M. Yasuniwa, R. Enoshita and T. Takemura, X-ray studies of polyethylene under high pressure, Jpn. J. Appl. Phys., 1976, 15(8), 1421 CrossRef CAS.
- Y. Maeda, H. Kanetsuna, K. Nagata, K. Matsushige and T. Takemura, Direct observation of phase transitions of polyethylene under high pressure by a PSPC X-ray system, J. Polym. Sci., Polym. Phys. Ed., 1981, 19(9), 1313–1324 CrossRef CAS.
- M. Kakudo and N. Kasal, X-Ray Diffraction by Polymers, Ko-dansha, Tokyo, 1972, p. 46 Search PubMed.
- X. R. Zeng, K. C. Gong, W. H. Gan and K. N. Wen, WAXD and FT-IR studies of HDPE handled under high temperature and ultrahigh pressure, Polym. Mater. Sci. Eng., 1996, 12, 131–134 CAS.
- R. J. Wu, The application of modern analysis technology in polymer, Shanghai science and Technology Press, 1986 Search PubMed.
| This journal is © The Royal Society of Chemistry 2015 |

