
 Open Access Article
 This Open Access Article is licensed under a
 Creative Commons Attribution 3.0 Unported Licence
Exploring the conformational preferences of 20-residue peptides in isolation: Ac-Ala19-Lys + H+vs. Ac-Lys-Ala19 + H+ and the current reach of DFT†
Franziska
Schubert
*a,
Mariana
Rossi
ab,
Carsten
Baldauf
*a,
Kevin
Pagel
ac,
Stephan
Warnke
a,
Gert
von Helden
a,
Frank
Filsinger
a,
Peter
Kupser
a,
Gerard
Meijer
ad,
Mario
Salwiczek‡
 c,
Beate
Koksch
c,
Matthias
Scheffler
a and
Volker
Blum
*ae
c,
Beate
Koksch
c,
Matthias
Scheffler
a and
Volker
Blum
*ae
aFritz-Haber-Institut der Max-Planck-Gesellschaft, D-14195 Berlin, Germany. E-mail: schubert@fhi-berlin.mpg.de; baldauf@fhi-berlin.mpg.de
bPhysical and Theoretical Chemistry Laboratory, University of Oxford, OX1 3QZ Oxford, UK
cInstitut für Chemie und Biochemie - Organische Chemie, Freie Universität Berlin, D-14195 Berlin, Germany
dRadboud University Nijmegen, 65000 HC Nijmegen, The Netherlands
eDepartment Mechanical Engineering and Material Science and Center for Materials Genomics, Duke University, Durham, NC 27708, USA. E-mail: volker.blum@duke.edu
First published on 12th February 2015
Abstract
Reliable, quantitative predictions of the structure of peptides based on their amino-acid sequence information are an ongoing challenge. We here explore the energy landscapes of two unsolvated 20-residue peptides that result from a shift of the position of one amino acid in otherwise the same sequence. Our main goal is to assess the performance of current state-of-the-art density-functional theory for predicting the structure of such large and complex systems, where weak interactions such as dispersion or hydrogen bonds play a crucial role. For validation of the theoretical results, we employ experimental gas-phase ion mobility-mass spectrometry and IR spectroscopy. While unsolvated Ac-Ala19-Lys + H+ will be shown to be a clear helix seeker, the structure space of Ac-Lys-Ala19 + H+ is more complicated. Our first-principles structure-screening strategy using the dispersion-corrected PBE functional (PBE + vdWTS) identifies six distinctly different structure types competing in the low-energy regime (≈16 kJ mol−1). For these structure types, we analyze the influence of the PBE and the hybrid PBE0 functional coupled with either a pairwise dispersion correction (PBE + vdWTS, PBE0 + vdWTS) or a many-body dispersion correction (PBE + MBD*, PBE0 + MBD*). We also take harmonic vibrational and rotational free energy into account. Including this, the PBE0 + MBD* functional predicts only one unique conformer to be present at 300 K. We show that this scenario is consistent with both experiments.
1 Introduction
Weak interactions such as van der Waals dispersion or hydrogen bonds are ubiquitously important in fields as diverse as liquids, catalysis, gels, polymers, and biology. The description of systems whose properties are determined by a sensitive balance of such subtle interactions presents a challenge to theory. For peptides, this challenge is moreover paired with a high flexibility of the peptide backbone leading to a conformational space that grows exponentially with the peptide length. Much effort is currently devoted to pushing the capabilities of first-principles approaches towards larger (bio)molecular systems and more accurate methods,1–22e.g., documented for the sampling of the conformational space of peptides (up to ∼100 atoms14,17,18,23). We here focus on a particular problem from peptide science to address the reach of current methods, namely the conformational landscape of two protonated 20-residue peptides Ac-Ala19-Lys + H+ and Ac-Lys-Ala19 + H+. The conformational preferences of these peptides were part of a landmark series of experimental studies by Jarrold and co-workers based on ion mobility-mass spectrometry,24–26 showing how different conformational preferences of peptide chains can be rationalized by experiments in vacuo. Both peptides are therefore excellent and influential model systems to study the reach and current limits of experiment and theory for peptide conformations, which is why we focus on them in this work. Importantly, both peptides are large enough to include secondary and partially even tertiary structure. As shown below, two different structure-sensitive experimental methods, ion mobility-mass spectrometry and vibrational spectroscopy, yield seemingly contradictory results for Ac-Lys-Ala19 + H+ (globular vs. helical structure prototypes). If correct, this mismatch would indicate a serious problem in at least one of these widely employed experimental approaches. Our exhaustive theoretical structure search resolves this conflict by identifying a lowest-energy conformer that matches both experimental results – but only by applying a rather high level of theory that is not yet standard for large peptide chains today.1.1 Energy landscapes and systematic errors
From a theoretical point of view, it would be desirable to be able to quantitatively predict the energy landscape of a given peptide sequence. However, all theoretical methods that can practically be used to address this problem present approximations to reality. Small errors in the description of the energy landscape will particularly affect the case of energetically close conformers. Here, relatively small, conformer-dependent misrepresentations of the potential-energy surface (PES) will directly affect the balance of the different conformations. Thus, an accurate representation of the underlying PES is needed. This is one of the challenges that is consistently emphasized in reviews such as ref. 27–29.In the field of protein simulation and structure prediction, much work is based on empirical parametrized models of the PES, so called “force fields”. Their range of validity is restricted by the chosen functional form on the one hand and the (necessarily) limited size of the training data set used in the fitting process of the parameters on the other hand. Given the high-accuracy requirements needed for the quantitative description of protein or peptide structure, it would be desirable to describe the PES in a first-principles picture based on the solution of the many-body Schrödinger equation. Due to the explicit quantum-mechanical description, such approaches have a wider range of validity than force fields. However, depending on the level of approximation, they come at a much higher computational cost and are thus restricted to smaller system sizes. Methods such as CCSD(T), often viewed as the gold standard of quantum chemistry, are practically infeasible for systems larger than a few amino acids. Due to its good compromise between efficiency and accuracy, density-functional theory (DFT) is increasingly used in the field of protein research.30–32 While DFT is an exact theory in principle, the exchange–correlation functional has to be approximated though, and different approximations exist. This is critical for the study of peptide structure as conformers may eventually differ by only a few meV per residue or even less, so that small errors of the method can lead to different predictions for the most stable structures.17,33–35
1.2 Scope of this work
In this work, we address the conformational landscapes of the unsolvated 20-residue peptides Ac-Ala19-Lys + H+ and Ac-Lys-Ala19 + H+. For peptides of this size (220 atoms), the only currently feasible benchmark for approximate theoretical methods is clean experimental data. In order to critically assess our theoretical results, we build on experimental gas-phase data from mid-range infrared multiple photon dissociation (IRMPD) spectroscopy and ion mobility-mass spectrometry (IM-MS). The measurements are compared to calculated infrared (IR) spectra from ab initio molecular dynamics (aiMD) and calculated collision cross sections (CCSs) for the lowest-energy structures. We here assess different levels of theory and show that only the highest level of theory considered predicts a scenario, namely a conformer that shows a helix-turn-helix motif, which is in agreement with both experiments.In the literature, there are (at least) two flavors of DFT functionals: flavors involving explicit empirical parametrization, and those where free parameters are determined from certain exact physical constants. Our preference in this paper is to assess the most successful generalized gradient approximation (GGA) and hybrid functional from the latter series, namely the PBE36 and the PBE037 functionals. Taking more functionals into account would add more data points to the picture, but would not fundamentally change the result, especially since we obtain a result consistent with both experiments as shown below.
To include the long-range tail of dispersion interactions, we couple each of the functionals with a dispersion correction. For this purpose, we use a state-of-the-art pairwise correction38 (PBE + vdWTS, PBE0 + vdWTS) and a many-body dispersion correction scheme4,39 (PBE + MBD*, PBE0 + MBD*), both depending on the self-consistent electron density. In contrast to the pairwise method, the MBD* approach is not a simple sum over pairwise potentials. The method presents a higher level of theory from a fundamental point of view by capturing all orders of many-body interactions in the dipole approximation. It has been shown that taking many-body dispersion interactions into account becomes increasingly important for large system sizes.3 We describe the method in more detail in the Methodology Section. To account for the fact that the experiments are conducted at room temperature, we further include harmonic vibrational and rotational contributions to the free energy.
In this work, we find only α-helical conformations for Ac-Ala19-Lys + H+ in the low-energy ensemble, as previously suggested by a series of landmark experiments by Jarrold and co-workers.24–26 The most favorable protonation site is the sidechain amino group of lysine.25 In an ideal α-helix, the four backbone carbonyl oxygens closest to the C-terminus are not involved in backbone hydrogen bonds. Force-field based modelling by Jarrold and co-workers24–26 suggests that in the Ac-Ala19-Lys + H+ helix three of the free backbone carbonyl oxygens are capped by hydrogen bonds with the protonated lysine amino group, thus stabilizing a helical conformation. In an α-helix the peptide groups C(![[double bond, length as m-dash]](https://www.rsc.org/images/entities/char_e001.gif) O)–N(H) are aligned along the helical axis. This results in a helix dipole pointing from the C- to the N-terminus. Thus, the positive charge at the C-terminal lysine residue is close to the negative end of the helix dipole, leading to an electrostatically favorable interaction (cf. right side of Fig. 1). Consequently, when displacing the protonated lysine residue Lys(H+) to the N-terminus, the helix-stabilizing factors are missing and a helical conformation is destabilized. In the same series of studies by Jarrold and co-workers mentioned above,24–26 the preferred conformations of Ac-Lys-Alan + H+ were characterized as “globular”, still retaining some helical parts. However, the specific low-energy conformation or conformational ensemble was not unambiguously identified. In this work, we explore to what extent the conformation(s) can be assessed on a quantitative level. Including harmonic vibrational and rotational contributions to the free energy, for n = 19, we here show that the PBE + vdWTS functional predicts a scenario of specific competing conformers – a scenario already observed previously in gas-phase experiments for molecules such as Bradykinin.40,41 The PBE0 + MBD* functional with its higher accuracy produces a subtly changed picture, indicating that only a unique single conformer with well-defined secondary structure may be dominant. We show that the latter scenario would be in agreement with our experimental data.
O)–N(H) are aligned along the helical axis. This results in a helix dipole pointing from the C- to the N-terminus. Thus, the positive charge at the C-terminal lysine residue is close to the negative end of the helix dipole, leading to an electrostatically favorable interaction (cf. right side of Fig. 1). Consequently, when displacing the protonated lysine residue Lys(H+) to the N-terminus, the helix-stabilizing factors are missing and a helical conformation is destabilized. In the same series of studies by Jarrold and co-workers mentioned above,24–26 the preferred conformations of Ac-Lys-Alan + H+ were characterized as “globular”, still retaining some helical parts. However, the specific low-energy conformation or conformational ensemble was not unambiguously identified. In this work, we explore to what extent the conformation(s) can be assessed on a quantitative level. Including harmonic vibrational and rotational contributions to the free energy, for n = 19, we here show that the PBE + vdWTS functional predicts a scenario of specific competing conformers – a scenario already observed previously in gas-phase experiments for molecules such as Bradykinin.40,41 The PBE0 + MBD* functional with its higher accuracy produces a subtly changed picture, indicating that only a unique single conformer with well-defined secondary structure may be dominant. We show that the latter scenario would be in agreement with our experimental data.
 | ||
| Fig. 1 Summary of experimental results for Ac-Ala19-Lys + H+vs. Ac-Lys-Ala19 + H+/Na+. The left panel shows ion mobility-mass spectrometry (IM-MS) drift time distributions for helical Ac-Lys-Ala19 + Na+19,26versus Ac-Lys-Ala19 + H+ and the right side depicts infrared multiple photon dissociation (IRMPD) spectra for helical Ac-Ala19-Lys + H+versus Ac-Lys-Ala19 + H+ resulting in the “conformational puzzle” for Ac-Lys-Ala19 + H+: IM-MS interpreted by molecular modelling26 suggests compact globules for Ac-Lys-Ala19 + H+, while the similarity of the IR spectra of Ac-Lys-Ala19 + H+ to the spectrum of the helical Ac-Ala19-Lys + H+ points to helical motifs. | ||
2 Methodology
This section summarizes the central methodological aspects of our study. We also refer to the ESI† for more information on the experiments (peptide synthesis, IM-MS, and IRMPD) and calculations (structure searches, IR spectra).In order to sample the conformational space of the peptides under study, we perform a combined force field/DFT approach based on replica-exchange molecular dynamics (REMD),42–45 zooming into the relevant parts of the structure space with increasing level of theory. All preliminary, force-field based REMD calculations were carried out using the GROMACS program package46 and the OPLS-AA force field.47 All DFT calculations were performed using the all-electron program package FHI-aims based on numeric atom-centered orbital basis sets.48,49,76 In FHI-aims, there are different preconstructed computational defaults, categorised as “light”, “tight”, and “really tight” settings with increasing accuracy. For the chemical elements relevant to this work, “light” settings include so-called “tier1” basis sets, while “tight” settings include the larger “tier2” basis sets. Furthermore, the accuracy of the multipole expansion of the Hartree potential and the integration grids is increased. This is summarized in more detail in Table 1. Most importantly, “light” settings are usually used for prerelaxations, while “tight” settings ensure that energy differences are converged to the meV-level also for large structures.16,48 We verified this explicitly for this work by recomputing the conformational energy hierarchy of the most important conformers identified by us, called C1 to C6 below, with the largest available “really tight” settings and the largest available predefined basis sets (“tier 4”48), yielding differences of less than 0.005 kJ mol−1 per atom. While local sampling with ab initio REMD was performed with “light” computational settings, all results (IR spectra and CCS geometries) that we compare to experiment as well as potential and free energies discussed in the manuscript are based on “tight” computational settings.
| Element, settings | H, “light” | H, “tight” | CNO, “light” | CNO, “tight” |
| Basis set (radial functions) | [1s] + sp | [1s] + sp + spsd | [1s,2s,2p] + pds | [1s,2s,2p] + pds + fpsgd |
| Outermost radial function radius (Å) | 5 | 6 | 5 | 6 |
| l-hartree | 4 | 6 | 4 | 6 |
The addition of vdW long-range interactions to DFT functionals has been shown to dramatically and systematically improve their performance on the description of molecular systems (including polyalanine).5,50 As mentioned above, we here employ two different vdW correction schemes. The first one,38 denoted as “vdWTS” in the functional description, is an atom-pairwise approach, where the effective C6 dispersion coefficients depend on the self-consistent electron density. In this way, hybridization effects are successfully taken into account. Still, the method is computationally cheap compared to approaches using non-local correlation functionals. The second approach is a many-body scheme, which is called MBD@rsSCS or MBD* for short.4,39 In this method, the atoms of the molecule are modelled as spherical quantum harmonic oscillators, which are coupled through dipole–dipole interactions. In a first step, one obtains self-consistently screened (SCS) polarizabilities and oscillator frequencies by using the self-consistent screening equation of classical electrodynamics. In order to avoid double-counting effects, the dipole-interaction tensor used to describe the interaction between the oscillators is range-separated (rs) and only the short range is taken into account in the screening equation. Hence, the name MBD@rsSCS, which we abbreviate here by MBD*. In a second step, the long-range dispersion energy is evaluated by diagonalizing the many-body Hamiltonian using the screened polarizabilities and frequencies obtained in the first step (for further details see ref. 39). As mentioned above, this takes all orders of many-body interactions within the dipole approximation into account. The approach is equivalent to the random-phase approximation (RPA) for the correlation energy for the chosen model system.51 In contrast, the pairwise approach corresponds to the second-order term of the RPA expression.
Both the vdWTS and the MBD* schemes are coupled with the PBE36 as well as the PBE037 functional. In the PBE0 functional, a fraction of exact exchange is added in the Hartree–Fock spirit to decrease the self-interaction error. In total we assess four different functionals: PBE + vdWTS, PBE + MBD*, PBE0 + vdWTS, and PBE0 + MBD*. As described above, from a fundamental point of view, PBE0 represents a higher level of theory than PBE, and MBD* represents a higher level of theory than vdWTS. For this reason, PBE0 + MBD* is thus expected to yield the most reliable results. It was recently shown by Rossi et al.14 that PBE0 + MBD* (in combination with zero-point corrections) yields excellent results for Ac-Phe-Ala5-LysH+, a peptide similar to the systems studied in this work. There, the PBE0 + MBD* functional including zero-point corrections comes closest to explaining the previously experimentally established conformers and their relative abundances,23,52 even when compared to a study that involved 19 other DFT functionals, as well as Hartree–Fock and second-order Møller–Plesset (MP2) theory.18
Free energies were calculated using the harmonic oscillator–rigid rotor approximation. The vibrational frequencies are obtained using a finite-difference approach and the PBE + vdWTS functional.
IR spectra were derived from aiMD trajectories by calculating the Fourier transform of the autocorrelation function of the dipole time derivative.15,20,53 In this way, they account for anharmonicities of the PES within the classical-nuclei approximation. The aiMD runs were 25 ps long and were performed using the microcanonical ensemble with a time step of 1 fs after thermalizing at 300 K for at least 4–5 ps using the Bussi–Donadio–Parrinello thermostat.54
The IRMPD spectra were recorded for ions at room temperature using the free-electron laser FELIX55 in combination with the Fourier transform ion cyclotron (FT-ICR)56 mass spectrometer. The IM-MS data shown in Fig. 1 were collected using a Synapt G2-S travelling-wave IM-MS instrument. The absolute CCSs given in Table 3 were determined with an in-house built drift tube (DT) IM-MS apparatus (cf. Fig. S1 in ESI†).
In order to connect to the experimentally determined CCSs we calculated CCSs for our structure models (PBE + vdWTS geometries). For this, we employed the trajectory method (TJM)57,58 as implemented in the Mobcal program.59 In the TJM approach, the collision integral of the molecule and the colliding helium atom is explicitly evaluated. For this, the scattering angle of the helium atom is obtained by calculating trajectories of the helium atom in an effective He-peptide potential, where each atom in the peptide is represented by a (12,6,4)-potential (Lennard-Jones term plus ion-induced dipole interactions). We used 500![[thin space (1/6-em)]](https://www.rsc.org/images/entities/char_2009.gif) 000 TJM trajectories per single conformer and the Hirshfeld60 charges of the PBE density.
000 TJM trajectories per single conformer and the Hirshfeld60 charges of the PBE density.
3 Results
3.1 Experimental data
We begin with the experimental data collected in this work. The left side of Fig. 1 shows measured room-temperature ion mobility drift times for Ac-Lys-Ala19 + Na+ (top) and Ac-Lys-Ala19 + H+ (bottom). Na+ terminated polyalanine has been shown before to be consistent with helical structure in the gas phase by Kohtani et al.61 as well as in a recent, joint experiment–theory study.19 Thus, the large peak for Ac-Lys-Ala19 + Na+ in IM-MS can be identified with the drift time of a helix. In contrast, the dominant peak for Ac-Lys-Ala19 + H+ appears at a much shorter drift time, corresponding to a smaller overall cross section, and is here labelled as a “globule”. This situation is analogous to that described by Jarrold26 for Ac-Lys-Ala15 + H+versus Ac-Ala15-Lys + H+. Accordingly, we associate the small peaks flanking the main peak for Ac-Lys-Ala19 + H+ with C-terminal protonated helices and helical dimers just like in Jarrold's case.26The right side of Fig. 1 shows measured room-temperature IRMPD spectra probing the vibrational frequencies of the unsolvated peptides Ac-Ala19-Lys + H+ and Ac-Lys-Ala19 + H+ in the region between 1000 and 1750 cm−1. For very different structures (helix vs. globule), one would normally expect these spectra to also reveal distinct differences (e.g., ref. 20, 23, 53 and 62–65 and references therein). Most importantly, the amide II region (1400–1600 cm−1) probes collective N–H bendings and the amide I band (1600–1700 cm−1) is related to collective CO stretching. The positions of these bands are sensitive to the types of H-bonds that are formed,20,66,67 in that the amide I/II modes will shift to lower/higher frequencies upon bond making.
Despite subtle differences such as a shift of the amide II peak by 10 wavenumbers, the IR spectrum of Ac-Lys-Ala19 + H+ is surprisingly similar to that of Ac-Ala19-Lys + H+, although very different conformers are expected (compact vs. helix). In fact, the amide I peaks are almost identical. Similar observations were made by Hu et al. on surfaces for n = 15.68 To summarize Fig. 1 in brief: while the similarity of the IR spectra points to helical motifs for Ac-Lys-Ala19 + H+, the IM-MS data suggests mainly compact globules. In order to assess this mismatch, we perform an extensive conformational search for both peptides in the following.
3.2 Conformational search by first-principles theory
Apart from an accurate description of the PES, a reliable theoretical prediction of the conformational space of both peptides requires a search method that efficiently samples the large conformational space. The conformational search strategy employed here is independent of and, thus, complementary to the experimental evidence shown in Fig. 1 and in the literature.15,24,26We here employ a four-step approach to sample the conformational space of both Ac-Ala19-Lys + H+ and Ac-Lys-Ala19 + H+, zooming into the relevant conformational space with increasing computational refinement:
(Step 1) A full sweep of conformational space is still beyond the reach of first-principles based methods. Thus, in order to obtain a broad overview of the conformational space, we start with force-field (OPLS-AA47) based REMD. REMD42–45 enhances conformational sampling relative to single-trajectory MD simulations by multitempering and temperature switching. We used an overall sampling time of 8 μs per system with 16 replicas in the temperature range between 300 K and 915 K.
(Step 2) In order to identify the most important structure types, we extracted snapshots (each 2 ps) of the 300 K REMD trajectory and sorted them into families according to their root-mean square deviation (RMSD).69 For this, we took the backbone atoms and the nitrogen and carbon atoms of the lysine side chain into account and used a cut-off of 0.5 Å. For each cluster, we identified the midpoint structure, which is the structure with the lowest average RMSD to all other structures in the cluster. Subsequently, we optimized the cluster midpoint structures using the force field. For Ac-Lys-Ala19 + H+, we obtained 9620 structures and for Ac-Ala19-Lys + H+ 464 structures. For Ac-Lys-Ala19 + H+, we performed the same procedure also for the REMD trajectories at about 600 K and 900 K.
(Step 3) We then followed up with a DFT-PBE + vdWTS based relaxation of the force-field low-energy conformational regions. For Ac-Lys-Ala19 + H+, we optimized 1026 of the force field low-energy structures obtained from the processing of the 300 K REMD trajectory, and 1000 for the pool of structures obtained from the 600 K and 900 K REMD trajectories, respectively (3026 structures in total). The energy hierarchies of the OPLSAA force field and the PBE + vdWTS functional differ quite significantly (shown in Fig. S2 in the ESI†). For Ac-Ala19-Lys + H+, 464, i.e., all midpoint structures were relaxed using DFT-PBE + vdWTS.
(Step 4) To further ensure that the lowest-energy conformers are identified, we performed final, fully DFT-PBE + vdWTS based REMD runs for the four lowest-energy structure types of Ac-Lys-Ala19 + H+ from Step 3 (16 replicas in the temperature range between 300 K and 623 K, i.e., a total of 320 ps simulation time per conformer) and for the lowest-energy Ac-Ala19-Lys + H+ conformer (total REMD simulation time 208 ps). After each ps of REMD simulation time, we relaxed all replicas with PBE + vdWTS. As shown in Fig. S3 of the ESI,† we are able to find structures that are lower in energy than the ones proposed by the force field, thus further eliminating a force-field bias.
The results of this four-step cascade search approach will be addressed in the following sections. Furthermore, in Section 4.2, we discuss the influence of higher-level exchange–correlation functionals (PBE + MBD*, PBE0 + vdWTS, PBE0 + MBD*).
3.3 Energy surfaces
The lowest-energy structure for Ac-Ala19-Lys + H+ is α-helical (see Fig. 2(a) left side). For all local minima of the PBE + vdWTS PES that were found in our structure search, we plot the RMSD against the lowest-energy structure versus the relative energy. All of them are essentially α-helical with only the termini deviating from the ideal conformation (we illustrate this for six exemplary conformations). Thus, Ac-Ala19-Lys + H+ is a structure seeker with the energy of the conformers rising with increasing RMSD with respect to the lowest-energy structure. | ||
| Fig. 2 RMSD (heavy atoms) versus relative PBE + vdWTS energy of all local minima of the PBE + vdWTS PES found for Ac-Ala19-Lys + H+ and Ac-Lys-Ala19 + H+. (a) Ac-Ala19-Lys + H+: all local minima found in the search are depicted by a black dot. The lowest energy conformer is sketched at the left side of the plot. On the right side the backbone ribbon representations of 6 structures are illustrated labelled 1 to 6 with 1 being the lowest-energy structure. The backbone atoms of residues Ac to Ala14 are fitted onto structure 1. (b) Ac-Lys-Ala19 + H+: all local minima found in the structure search (>4000) are depicted by a grey dot. C1 to C6 stand for the lowest energy structure motifs and are depicted by square symbols. Structures with an RMSD of <1.6 Å w.r.t. C1 to C6 are highlighted in the corresponding color. On the left side the backbone ribbon of C1 and the low-energy structures a and b is shown. The backbone atoms of residues Ala6 to Ala11 (α-helical part) are aligned on top of each other. (c) Visualization of the lowest energy structure types for the Ac-Lys-Ala19 + H+ monomers. The ribbon color highlights the α-helical (red) and 310-helical (blue) parts. The “+”-sign symbolizes the positive charge of the lysine NH3+ group. The energy differences of the different conformers are given in Table 2. | ||
On the other hand, for Ac-Lys-Ala19 + H+ we do not find only a single structure type. Interestingly, the peptide chain is long enough so that the structures consist of more than one secondary-structure element. In order to classify the structures, we focus on these elements, with special focus on helical hydrogen bonds (α-helical or 310-helical hydrogen bonds, or otherwise). We identify six structural prototypes within the lowest 16.4 kJ mol−1. The lowest-energy representatives are depicted in Fig. 2(c), where their total-energy and free-energy differences at 300 K are given in Table 2. The α- and 310-helical segments are color coded in red and blue, respectively. The structure types are labelled C1 to C6 with increasing energy. C1 contains an α-helical segment roughly in the middle of the chain, where the two ends are antiparallely aligned. Three different exemplary structures of the C1 type are shown in Fig. 2(b). C2 consists of an α- and a 310-helical segment, which are connected by a turn. At the N-terminus, C3 has a small loop, which connects to an α-helical part. In the C4 type, the peptide chain forms a complete loop comprising an α-helical segment with a small 310-helical fraction at its end. C5 consists of an α-helical part that is connected by a turn to a 310-helical twist that connects to a 27-helical strand. C6 is similar, but consists of two α-helical segments. All structures share a common stabilizing structural motif, namely that the positively charged lysine NH3+ group is twisted around to the electrostatically negative end of the largest α-helical section.25
| C1 | C2 | C3 | C4 | C5 | C6 | ||
|---|---|---|---|---|---|---|---|
| PBE + MBD* | ΔE | 0.0 | −7.2 | 7.3 | 1.4 | 13.5 | 10.5 |
| ΔF | 0.0 | −9.2 | 4.9 | 3.2 | 7.4 | 6.3 | |
| PBE + vdWTS | ΔE | 0.0 | 8.9 | 12.1 | 13.2 | 15.3 | 16.4 |
| ΔF | 0.0 | 6.8 | 9.8 | 15.0 | 9.2 | 12.2 | |
| PBE0 + vdWTS | ΔE | 0.0 | 0.4 | 9.0 | 7.6 | 14.2 | 11.2 |
| ΔF | 0.0 | −1.6 | 6.7 | 9.5 | 8.2 | 7.0 | |
| PBE0 + MBD* | ΔE | 0.0 | −15.4 | 5.2 | −3.9 | 12.9 | 5.8 |
| ΔF | 0.0 | −17.4 | 2.8 | −2.0 | 6.8 | 1.6 | |
The plot in Fig. 2(b) shows how close in energy the lowest-energy structures C1 to C6 are, while being very distant in three-dimensional structure. For instance, a large gap in conformational space (based on RMSD) may indicate an energy barrier separating C1 from the alternative basins.
3.4 Ac-Lys-Ala19 + H+: helical models
As discussed above, apart from the main peak assigned to compact conformers in the IM-MS measurements of Ac-Lys-Ala19 + H+ in Fig. 1, there are also two other small peaks. Those peaks originate most likely from small amounts of helical dimers and helical monomers.26 For this reason, we performed two individual structure searches for these conformational types.For helical dimers, the structure search is analogous to the one described above for the Ac-Lys-Ala19 + H+ monomers. Specifically, for the OPLS-AA-based REMD run, we used 22 replicas in the temperature range between 300 K and 904 K (total simulation time: 4.4 μs). We clustered the snapshots (each 2 ps) of the 300 K trajectory in an analogous fashion as described for the monomers. After relaxing the midpoint structures of all clusters with OPLS-AA, we found 2180 dimer geometries, of which we fully relaxed the 96 lowest-energy ones with PBE + vdWTS. The Ac-Lys-Ala19 + H+ dimers differ in the geometries of the terminations, alternative twist angles of the helical axes, and shift between the helices. For the two lowest-energy PBE + vdWTS structures we followed up with PBE + vdWTS REMD runs with analogous settings as described above (total simulation time: 2 × 160 ps). The two lowest-energy structures are depicted in Fig. 3. Notably, these are more stable than the monomer C1 with a free-energy difference of −76.1 and −78.0 kJ mol−1 per monomer, respectively. However, the process of dimer formation depends on the partial pressure of the monomers, which is very low in the gas phase. This makes dimer formation rather improbable explaining the rather small amount of helical dimers observed in the IM-MS experiments.
 | ||
| Fig. 3 Ac-Lys-Ala19 + H+: visualization of the lowest-energy conformations for the dimers and the helical models with the proton located at the N-terminal lysine and close to the C-terminus, respectively. The ribbon color highlights the helical parts. For all structures PBE + vdWTS energy differences (per monomer) ΔE and free energy differences (ΔF at 300 K) are given with respect to C1. The latter incorporates harmonic vibrational and rigid rotor rotational contributions. | ||
As discussed above, the small peak flanking the main peak in the IM-MS drift-time distribution for Ac-Lys-Ala19 + H+ at the right side is consistent with helical monomers (see Fig. 1). For this reason, we also performed structure searches to find typical conformations of α-helical model peptides for Ac-Lys-Ala19 + H+. We consider the two cases that the proton is either located at the N-terminal lysine or close to the C-terminus as suggested by Jarrold and co-workers.25,26 As especially in the latter case, the proton needs to be free to hop between the C-terminal carbonyl oxygens, we employ a pure first-principles (PBE + vdWTS) search using REMD as most force fields do not allow for bond breaking. The lowest-energy conformers for both types are depicted in Fig. 3. More details about the search can be found in the ESI.† Both structure models are significantly higher in energy than the lowest-energy monomer C1. This applies especially to the model with the proton at the N-terminal lysine (ΔF = 234.0 kJ mol−1) consistent with the unfavorable electrostatic interaction of the helix dipole with the positively charged lysine. The model structure with the proton close to the C-terminus is about 44.7 kJ mol−1 higher in free energy than C1, suggesting that it should not be populated in experiment. However, there is a small fraction of helices observed in the IM-MS measurements. We will return to this issue further below.
4 Discussion
4.1 Structure assignment
It is established from previous experimental and theoretical work,15,17,24,26 and fully by our simulations, that Ac-Ala19-Lys + H+ forms α-helices in the gas phase. However, for Ac-Lys-Ala19 + H+ the situation is more complicated with several structural types that are competing in the low-energy PBE + vdWTS regime. For a truly predictive picture, we have to resolve structural energy differences of significantly less than 0.1 kJ mol−1 per atom. This is challenging for the employed PBE + vdWTS functional and to any applicable approximate electronic-structure method. Based on previous benchmark studies,5,14,50 we expect an average error for the PBE + vdWTS functional itself (PES) to be as high as 11 kJ mol−1 for a 20-residue peptide. For relatively similar structures, the situation should be less severe, though. Even if this error seems high, it is already less than half the error expected for the standard functionals (no long-range vdW effects), and between 2 to 5 times lower than what is predicted for standard force fields (polarizable or not). In order to assess to what extent we are able to describe a peptide system of this size, we connect to the experimental data by calculating CCSs and IR spectra for the PBE + vdWTS structure models.The calculated CCSs for the C1 to C6 monomers and for the dimers and the helical models are given in Table 3 together with the experimental CCSs obtained with a home-built drift-tube instrument. To begin with, the calculated CCSs are in qualitative agreement with the experimental measurements. Considering the width of the IM-MS peak assigned to Ac-Lys-Ala19 + H+ globules in Fig. 1, we see that it is similar (if not even smaller) to the width of the peak for Ac-Lys-Ala19 + Na+, which is expected to be only one dominant helical conformer. Such a narrow peak width for the Ac-Lys-Ala19 + H+ globules can arise for different reasons: (i) there is indeed only one dominant conformer present in experiment, (ii) there are several conformers with essentially the same CCS present, (iii) or there is a rapid interconversion of different conformers so that each conformer travels through the drift tube with the same time-averaged CCS. In order to assess the latter possibility, we need to determine barriers, which is even more difficult than to determine energy differences on which we concentrate here. However, any possible scenario of rapid interconversion of conformers C1 and C6 could explain the relatively narrow, single peak observed in experiment. A coexistence picture can be ruled out: having a closer look at the different calculated CCSs for the compact monomers, we see that C1 and C3 (group A) have very similar CCSs and C2, C4, C5, and C6 (group B) have very similar CCSs. A co-existence of conformers from group A and B would result in two different peaks, which is obviously not the case (see Fig. 1). We thus conclude that there should be either only conformers from group A or group B present to a measurable extent. Furthermore, the measured values point to group B rather than to group A since, in absolute terms, the calculated CCSs for group B are in better agreement with the measured ones.
| Helical dimers | Compact monomers | Helical models | ||||||||
|---|---|---|---|---|---|---|---|---|---|---|
| D1 | D2 | C1 | C2 | C3 | C4 | C5 | C6 | H+ near C-term. | Lys(H+) | |
| a There is a shallow peak seen in the arrival time distribution. It could correspond to dimers, but the intensity is too low for a reliable assignment. | ||||||||||
| CCS (Å2), theory (this work) | 571 | 561 | 308 | 325 | 307 | 326 | 323 | 326 | 367 | 373 |
| CCS (Å2), expt. (this work) | —a | 324 | 371 | |||||||
However, the PBE + vdWTS functional in combination with free energies at 300 K predicts C1 (from group A) to be the dominant conformer. C2 is also predicted to be present to a measurable extent, namely by about 6% of the amount of C1, according to Boltzmann populations. Thus, the scenario predicted by PBE + vdWTS plus free-energy corrections is not in line with the IM-MS measurements.
The second piece of experimental evidence is the IRMPD spectrum. To relate to the IRMPD experiment in Fig. 1, we derived IR spectra from aiMD simulations performed using the PBE + vdWTS functional. In this way, they include finite T anharmonic effects within the classical-nuclei approximation. For reasons of computational cost, we only calculated those spectra for selected conformers, where we chose the four lowest-energy structure types C1, C2, C3, and C4 and the lowest-energy fully helical conformer with the proton located close to the C-terminus. The spectra in Fig. 4 do reflect a considerable variation of their detailed peak positions and shapes in the wavenumber range between 1100 and 1750 cm−1.
 | ||
| Fig. 4 Ac-Lys-Ala19 + H+: comparison of experimental (black lines) and calculated vibrational spectra for C1 to C4 and the helical model with the proton close to the C-terminus. Insets: zoom of the low-intensity region between 1130 and 1450 cm−1. Each graph gives the R-factor and the corresponding rigid shift Δx between experimental and calculated spectra in the wavenumber range between 1130 and 1736 cm−1. | ||
IRMPD experiments rely on the absorption of several photons, which can affect the relative band intensities.70 For a comparison between experimental and calculated spectra it would thus be favorable to attribute more weight to the peak positions rather than to intensity. As this is not easy to be accomplished by a purely visual comparison, we employ the Pendry reliability factor RP,71 as an unbiased, numerical criterion for a theory–experiment comparison. Instead of comparing the intensities I1 and I2 themselves, RP achieves greater sensitivity to the peak positions by comparing the renormalized logarithmic derivatives with Yi(![[small nu, Greek, macron]](https://www.rsc.org/images/entities/i_char_e0ce.gif) ) = Li−1/(Li−2 + V02), Li() = Ii′/Ii and V0 being the approximate half width of the peaks (here taken to be 10 cm−1). The Pendry reliability factor is then evaluated by RP = [∫d (Y1 −Y2)2]/[∫d (Y12 + Y22)]. Most importantly, a perfect agreement between two spectra yields RP = 0, while RP = 1 means no correlation. We calculate RP including a rigid shift Δx of the theoretical spectrum with respect to experiment.15 Such shifts have been described before15,20,53,65,72 and most likely reflect a systematic mode softening due to the chosen exchange correlation functional and missing nuclear quantum effects. As the R-factor is sensitive to small kinks in the signal, the experimental data were smoothed before comparing to the theoretical spectra. This is described in detail in the supporting information. To account for broadening effects in experiment, the theoretical spectra were convoluted with a Gaussian function with a variable width of 0.5% of the wavenumber. Different widths do not show qualitative differences in the resulting R-factors.
) = Li−1/(Li−2 + V02), Li() = Ii′/Ii and V0 being the approximate half width of the peaks (here taken to be 10 cm−1). The Pendry reliability factor is then evaluated by RP = [∫d (Y1 −Y2)2]/[∫d (Y12 + Y22)]. Most importantly, a perfect agreement between two spectra yields RP = 0, while RP = 1 means no correlation. We calculate RP including a rigid shift Δx of the theoretical spectrum with respect to experiment.15 Such shifts have been described before15,20,53,65,72 and most likely reflect a systematic mode softening due to the chosen exchange correlation functional and missing nuclear quantum effects. As the R-factor is sensitive to small kinks in the signal, the experimental data were smoothed before comparing to the theoretical spectra. This is described in detail in the supporting information. To account for broadening effects in experiment, the theoretical spectra were convoluted with a Gaussian function with a variable width of 0.5% of the wavenumber. Different widths do not show qualitative differences in the resulting R-factors.
Both the completely helical and the C2, C3, and C4 conformers match the experiment much more closely (RP = 0.29, 0.31, 0.33, and 0.34, respectively) than the conformer C1 (RP = 0.44). While in low-energy electron diffraction crystallography a variance for RP can be defined, mingling of systematic and statistical errors and a limited data base makes it difficult to transfer this concept to vibrational spectroscopy. However, as a benchmark, we found RP ≈ 0.32 for a similar peptide where the correct structure is known.15 Based on this, the Pendry R-factor value of 0.31 obtained for conformer C2 (Fig. 4) reflects good agreement, but not clearly statistically better than C3 or C4. The calculated spectrum for C1, on the other hand, shows worse visual agreement with experiment, and the Pendry R-factor (0.44) captures this difference quantitatively. Accordingly, we would suggest C2, C3, and C4 to be possible candidates, while C1 is rather not the dominant conformer. This in line with the IM-MS results, but in disagreement with the PBE + vdWTS prediction. However, on the other hand, we also see that a good agreement of the theoretical and the experimental spectrum does not necessarily imply that the corresponding structure is actually present in experiment. As shown above, large contributions to the experimental spectra from completely α-helical conformations can be ruled out by the experimental IM-MS results, although the agreement of the spectrum with experiment is good. Moreover, C2 and C3 yield a very similar agreement with the experimental spectrum although they should not be coexisting based on the IM-MS results. The similarity of the IRMPD spectra for Ac-Lys-Ala19 + H+ and Ac-Ala19-Lys + H+ might thus be a problem of structure sensitivity of the method in this wavenumber region.
In order to encourage future experiments, we also show the IR range between 2500 and 3700 cm−1, which is more conformer sensitive (see Fig. 4, right side). In order to convolute the spectrum in a higher wavenumber region with a similar width as the spectra between 1000 and 1736 cm−1, we used a Gaussian function with a width of 5 cm−1. The predicted IR intensity for C1, C3, and C4 is rather spread out in this range, while it is more concentrated around 3400 cm−1 for the most helical C2 conformer and the helical model. This is similar to what Martens et al.19 experimentally observed for compact versus helical sodiated polyalanines.
4.2 Advanced exchange–correlation treatment
As discussed above, the structure predictions of the PBE + vdWTS functional (including free-energy corrections) for Ac-Lys-Ala19 + H+ are not in line with the experimental findings. As mentioned above, we performed calculations with more refined exchange-correlation functionals: the PBE functional coupled with a many-body dispersion correction (PBE + MBD*) and the PBE0 functional coupled to the pairwise and the many-body dispersion correction (PBE0 + vdWTS, PBE0 + MBD*), respectively. Compared to the PBE functional and the pairwise correction, the hybrid PBE0 functional and the MBD* dispersion correction are both higher levels of theory from a fundamental point of view. Thus, the PBE0 + MBD* functional is expected to give the most reliable results.For Ac-Ala19-Lys + H+, we recalculated the energy hierarchy of the 16 lowest-energy conformers that we identified in our structure search using the PBE + vdWTS functional as described in Section 3.3. All structures are α-helical with only small deviations close to the termini (cf.Fig. 2). While the energy hierarchies obtained with the different functionals differ in the details (see Fig. 5), all functionals agree on the lowest-energy structure. With all tested functionals the ideal α-helix, where the lysine side chain is bent to form hydrogen bonds with the carbonyl oxygens close to the C-terminus as depicted on the left side of Fig. 2, is predicted to be lowest in energy.
 | ||
| Fig. 5 Comparison of energy hierarchies using the PBE + MBD*, PBE + vdWTS, PBE0 + vdWTS, and the PBE0 + MBD* functionals. All energies (y-axis) are given relative to the lowest-energy structure. Ac-Ala19-Lys + H+: energy hierarchies for the 16 lowest-energy (α-helical) structures obtained from our structure search using the PBE + vdWTS functional. The ideal α-helix depicted on the left side of Fig. 2 is highlighted in red. The x-axis gives the RMSD (heavy atoms) of each conformer with respect to this structure to partially resemble the plots in Fig. 2. Ac-Lys-Ala19 + H+: energy hierarchies for structure types C1 to C6. The RMSD values are given with respect to C1. | ||
For Ac-Lys-Ala19 + H+, we relaxed all 1026 PBE + vdWTS conformers obtained from the 300 K REMD trajectory as discussed in Section 3.2 also with the PBE + MBD* functional. We did not find any structure types other than C1 to C6 within the lowest 19 kJ mol−1. For a further assessment, we thus concentrated on C1 to C6 and also on the helical structure with the proton close to the C-terminus. In order to compare local minima of the respective PES, we relaxed those seven structures with the corresponding functional leading to only marginal changes quantified by RMSDs of less than 0.1 Å. For the PBE-based functionals, we used “tight” computational settings for the relaxation, while for the PBE0-based functionals we employed a slightly smaller basis set (see ESI†) for the relaxation and then followed up with single-point calculations using “tight” settings. The energy differences obtained with the different functionals for C1 to C6 are given in Table 2 and the energy hierarchies are illustrated in Fig. 5. Exchanging the pairwise dispersion correction for the many-body scheme (PBE + MBD*), the C2 conformer becomes the most stable conformer by 7.2 kJ mol−1. Also when exchanging the PBE functional for PBE0 (PBE0 + vdWTS), the C2 conformer becomes more stabilized and is almost isoenergetic to C1 (0.4 kJ mol−1). This means that both the higher-level MBD* method and the higher-level PBE0 functional stabilize C2 with respect to C1. For PBE0 + MBD*, C2 is significantly separated from the other conformers by 11.5 kJ mol−1. In the next step, we include harmonic vibrational and rotational contributions to the free energy at 300 K. The relative free energies of conformers C1 to C6 are given in Table 2. The changes in the energy hierarchy are illustrated in Fig. 6 for both PBE + vdWTS and PBE0 + MBD*, where the vibrational frequencies were obtained using the PBE + vdWTS functional. With respect to C1, the largest change occurs for the helix, which becomes significantly more stabilized. This is because helices have softer vibrational modes than more compact conformers.17,73 Among the rather compact structures C1 to C6 the changes in the energy hierarchies are relatively small. C2 becomes more stabilized, being separated from all other structures by 15.4 kJ mol−1 in PBE0 + MBD* meaning that C2 should be the only observable structure type. This scenario with C2 being the only populated conformer would be in agreement with both the IM-MS data and the IR spectrum. In other words, Ac-Lys-Ala19 + H+ might not yield a conformational ensemble after all, even at T = 300 K.
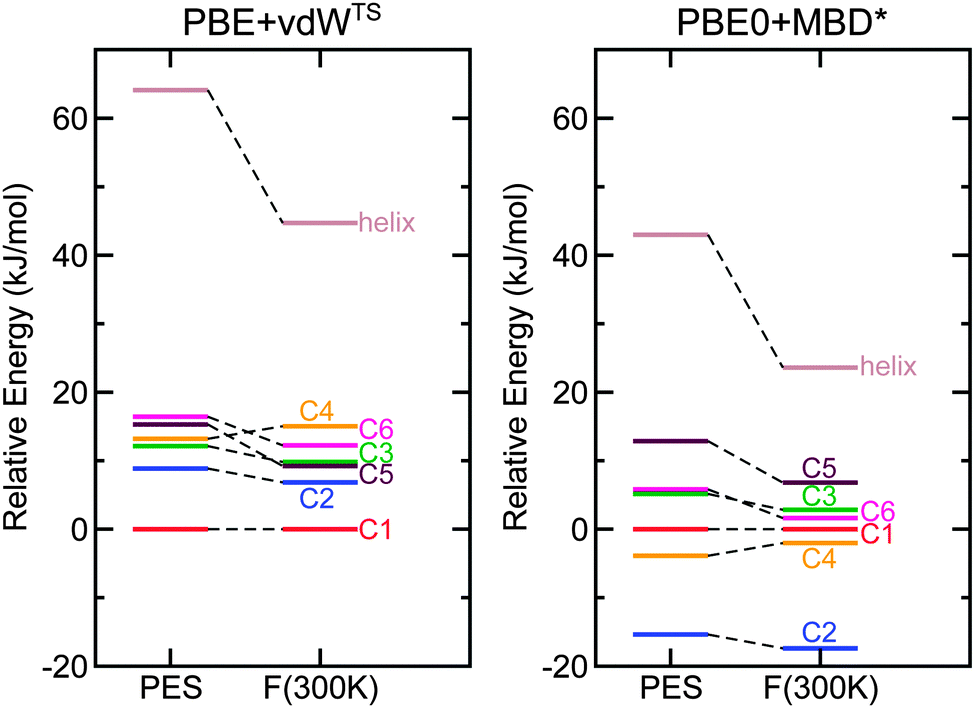 | ||
| Fig. 6 Comparison of total energy differences (PES) and free energy differences at 300 K for the Ac-Lys-Ala19 + H+ conformers using the PBE + vdWTS functional (left) and the PBE0 + MBD* functional (right). C1 is taken as the reference. Free energies were calculated using the harmonic oscillator-rigid rotor approximation at 300 K based on the PBE + vdWTS vibrational frequencies. | ||
In all functionals (also including free-energy corrections at 300 K) the helical model structure (with the proton close to the C-terminus) is significantly higher in energy than all other structure types (shown in Fig. 6 for PBE + vdWTS and PBE0 + MBD*). According to the corresponding Boltzmann factor, it should not be populated to a measurable extent. However, the IM-MS measurements (see Fig. 1) show a small fraction of helical monomers. This discrepancy can arise for different reasons: on the one hand, it might be an inherent error of the functionals – although, given the large predicted energy difference, this possibility seems rather remote. On the other hand, we might not have found the lowest-energy helical model structure during our structure search. The structure looks reasonable with the lysine side chain bent to interact with the acetyl group and the proton located at a position so that it can interact with the C-terminal carbonyl group. However, we also saw that small geometrical rearrangements can already lead to changes in energy of the order of 10 kJ mol−1 (see Fig. S3 of the ESI†). Moreover, Jarrold26 suggests that the helical structures arise from a dissociation of dimers. If there is a high energy barrier, the helices might indeed be trapped in this local minimum.
Force fields are commonly used in the description of the structure and dynamics of proteins. We have already described in Section 3.2 that the conformational energy hierarchies from OPLS-AA and PBE + vdWTS do not agree. In Fig. S2 of the ESI,† we computed the energy hierarchies of the C1 to C6 monomers using a higher-level force field, namely the polarizable force field AmoebaPro1374 (shown in Fig. S4 of the ESI†). For AmoebaPro13, the C3 conformer has the lowest energy, with C4 following very closely. In a scenario of coexisting conformers, this would not be in line with the experimental IM-MS data.
5 Conclusions
We here study the two peptides Ac-Ala19-Lys + H+ and Ac-Lys-Ala19 + H+, where a protonated lysine residue is located at the C- and the N-terminus, respectively. The structure of peptide chains is determined by the competition of several different factors. For the systems studied here particularly relevant contributions are: the self-solvation of charged groups in a vacuum environment, the known strong helix-forming propensity of alanine,75 the interaction of the helix dipole with the positive charge at the lysine residue, stabilizing hydrogen-bond networks at the termini, and the intramolecular van der Waals dispersion contribution. Capturing the subtle balance of these and other terms with quantum-mechanical accuracy for long peptide chains is a challenge, especially in conjunction with a huge conformational space. Yet, for fully quantitative predictions of the exact structural characteristics of peptides and proteins in any environment, as well as more generally for any system, where weak interactions such as dispersion or hydrogen bonds are important, this challenge must be met.For the specific peptides studied in this work, the helix-forming propensity of alanine and the electrostatic interactions of the positive charge at Lys(H+) with the helix dipole are the dominant terms.24–26 For Ac-Ala19-Lys + H+, both terms act together to stabilize the helix. In contrast, there is a conflict for Ac-Lys-Ala19 + H+: the positive Lys(H+) group would be located at the positive end of the dipole of a hypothetical polyalanine helix. This destabilizes a helical conformation and Ac-Lys-Ala19 + H+ forms rather compact structures, which, however, still show helical parts.25,26
In this work, we assess the current reach of DFT to quantitatively describe the conformational space of large peptides based on the specific example of Ac-Lys-Ala19 + H+. For this, we employ the dispersion-corrected functionals PBE + vdWTS, PBE + MBD*, PBE0 + vdWTS, and PBE0 + MBD*. Based on the fundamental level of theory and previous benchmarks for similar peptides,14 we expect PBE0 + MBD* to give the most reliable results. In fact, we find that different functionals yield not only quantitatively, but also qualitatively different scenarios. While PBE + vdWTS predicts an ensemble of energetically close conformers, the more accurate PBE0 + MBD* functional predicts the presence of only one unique conformer. This conformer, labelled as C2, is separated by 11.5 kJ mol−1 from the second-lowest energy conformer. Adding harmonic vibrational and rotational contributions to the free energy at 300 K leads to only small changes, but separates C2 from all other structures even more (15.4 kJ mol−1). Relying on gas-phase IM-MS and IRMPD measurements for validation, the PBE + vdWTS results cannot explain the experiments, while we find that the prediction of the higher-level PBE0 + MBD* functional would be in agreement with the experimental data. This means that PBE0 + MBD* (including free-energy corrections at 300 K) and both experiments could agree on the picture of one outstanding conformer, which consists of an α-helical segment and a 310-helical segment in an antiparallel arrangement. Given the complexity of the structure prediction problem, especially with increasing size of the peptide chain, it is very promising that we are actually able to theoretically predict a structure that is in agreement with both experiments. We can further conclude that the energetic proximity of other conformers and the potential errors of less accurate energy functionals would make it extremely difficult for any less accurate method to arrive at the unique experimental result. For systems of this size and above, predicted structural conclusions from standard force fields and standard density functionals must thus be viewed with caution. It is, however, encouraging that higher-accuracy functionals are becoming increasingly more capable to penetrate this size range.
Acknowledgements
This work was supported by the Distributed European Infrastructure for Supercomputing Applications (DEISA) through projects BioMolQM and BioMolQM2 in the DEISA Extreme Computing Initiative calls DECI-4 and DECI-6. The authors thank Dr. Luca Ghiringhelli (Fritz Haber Institute) for help with his implementation of ab initio REMD.References
- S. Grimme, Wiley Interdiscip. Rev.: Comput. Mol. Sci., 2011, 1, 211 CrossRef CAS.
- J. Klimes, D. R. Bowler and A. Michaelides, J. Phys.: Condens. Matter, 2010, 22, 022201 CrossRef PubMed.
- R. A. DiStasio, O. A. von Lilienfeld and A. Tkatchenko, Proc. Natl. Acad. Sci. U. S. A., 2012, 109, 14791 CrossRef CAS PubMed.
- A. Tkatchenko, R. A. DiStasio, R. Car and M. Scheffler, Phys. Rev. Lett., 2012, 108, 236402 CrossRef PubMed.
- N. Marom, A. Tkatchenko, M. Rossi, V. V. Gobre, O. Hod, M. Scheffler and L. Kronik, J. Chem. Theory Comput., 2011, 7, 3944 CrossRef CAS.
- B. Santra, A. Michaelides and M. Scheffler, J. Chem. Phys., 2007, 127, 184104 CrossRef PubMed.
- B. Santra, J. Klimes, D. Alfè, A. Tkatchenko, B. Slater, A. Michaelides, R. Car and M. Scheffler, Phys. Rev. Lett., 2011, 107, 185701 CrossRef PubMed.
- S. J. Fox, C. Pittock, C. S. Tautermann, T. Fox, C. Christ, N. O. J. Malcolm, J. W. Essex and C.-K. Skylaris, J. Phys. Chem. B, 2013, 117, 9478 CrossRef CAS PubMed.
- D. R. Bowler and T. Miyazaki, Rep. Prog. Phys., 2012, 75, 036503 CrossRef CAS PubMed.
- A. J. Cohen, P. Mori-Sánchez and W. Yang, Chem. Rev., 2012, 112, 289 CrossRef CAS PubMed.
- S. Baroni and P. Giannozzi, Europhys. Lett., 1992, 17, 547 CrossRef CAS.
- C.-K. Skylaris, P. D. Haynes, A. A. Mostofi and M. C. Payne, J. Chem. Phys., 2005, 122, 084119 CrossRef PubMed.
- J. Ireta and M. Scheffler, J. Chem. Phys., 2009, 131, 085104 CrossRef PubMed.
- M. Rossi, S. Chutia, M. Scheffler and V. Blum, J. Phys. Chem. A, 2014, 118, 7349 CrossRef CAS PubMed.
- M. Rossi, V. Blum, P. Kupser, G. von Helden, F. Bierau, K. Pagel, G. Meijer and M. Scheffler, J. Phys. Chem. Lett., 2010, 1, 3465 CrossRef CAS.
- S. Chutia, M. Rossi and V. Blum, J. Phys. Chem. B, 2012, 116, 14788 CrossRef CAS PubMed.
- M. Rossi, M. Scheffler and V. Blum, J. Phys. Chem. B, 2013, 117, 5574 CrossRef CAS PubMed.
- Y. Xie, H. F. Schaefer, R. Silaghi-Dumitrescu, B. Peng, Q.-s. Li, J. A. Stearnsand and T. R. Rizzo, Chem. – Eur. J., 2012, 18, 12941 CrossRef CAS PubMed.
- J. K. Martens, I. Compagnon, E. Nicol, T. B. McMahon, C. Clavaguéra and G. Ohanessian, J. Phys. Chem. Lett., 2012, 3, 3320 CrossRef CAS.
- M.-P. Gaigeot, Phys. Chem. Chem. Phys., 2010, 12, 3336 RSC.
- C. Baldauf and H.-J. Hofmann, Helv. Chim. Acta, 2012, 95, 2348 CrossRef CAS.
- F. Schubert, K. Pagel, M. Rossi, S. Warnke, M. Salwiczek, B. Koksch, G. von Helden, V. Blum, C. Baldauf and M. Scheffler, Phys. Chem. Chem. Phys., 2015, 17, 5376 RSC.
- J. A. Stearns, C. Seaiby, O. V. Boyarkin and T. R. Rizzo, Phys. Chem. Chem. Phys., 2009, 11, 125 RSC.
- R. R. Hudgins, M. A. Ratner and M. F. Jarrold, J. Am. Chem. Soc., 1998, 120, 12974 CrossRef CAS.
- R. R. Hudgins and M. F. Jarrold, J. Am. Chem. Soc., 1999, 121, 3494 CrossRef CAS.
- M. F. Jarrold, Phys. Chem. Chem. Phys., 2007, 9, 1659 RSC.
- P. L. Freddolino, C. B. Harrison, Y. Liu and K. Schulten, Nat. Phys., 2010, 6, 751 CrossRef CAS PubMed.
- K. A. Dill and J. L. MacCallum, Science, 2012, 338, 1042 CrossRef CAS PubMed.
- T. J. Lane, D. Shukla, K. A. Beauchamp and V. S. Pande, Curr. Opin. Struct. Biol., 2013, 23, 58 CrossRef CAS PubMed.
- D. Roy, G. Pohl, J. Ali-Torres, M. Marianski and J. J. Dannenberg, Biochemistry, 2012, 51, 5387 CrossRef CAS PubMed.
- G. Rossetti, A. Magistrato, A. Pastore and P. Carloni, J. Chem. Theory Comput., 2010, 6, 1777 CrossRef CAS.
- S. J. Fox, C. Pittock, T. Fox, C. S. Tautermann, N. Malcolm and C.-K. Skylaris, J. Chem. Phys., 2011, 135, 224107 CrossRef PubMed.
- M. D. Beachy, D. Chasman, R. B. Murphy, T. A. Halgren and R. A. Friesner, J. Am. Chem. Soc., 1997, 119, 5908 CrossRef CAS.
- H. Valdes, V. Spiwok, J. Rezac, D. Reha, A. G. Abo-Riziq, M. S. de Vries and P. Hobza, Chem. – Eur. J., 2008, 14, 4886 CrossRef CAS PubMed.
- H. Valdes, K. Pluhácková, M. Pitonák, J. Rezác and P. Hobza, Phys. Chem. Chem. Phys., 2008, 10, 2747 RSC.
- J. P. Perdew, K. Burke and M. Ernzerhof, Phys. Rev. Lett., 1996, 77, 3865 CrossRef CAS PubMed.
- C. Adamo and V. Barone, J. Chem. Phys., 1999, 110, 6158 CrossRef CAS.
- A. Tkatchenko and M. Scheffler, Phys. Rev. Lett., 2009, 102, 073005 CrossRef PubMed.
- A. Ambrosetti, A. M. Reilly, R. A. DiStasio and A. Tkatchenko, J. Chem. Phys., 2014, 140, 18A508 CrossRef PubMed.
- T. Wyttenbach, G. von Helden and M. T. Bowers, J. Am. Chem. Soc., 1996, 118, 8355 CrossRef CAS.
- N. A. Pierson, L. Chen, S. J. Valentine, D. H. Russell and D. E. Clemmer, J. Am. Chem. Soc., 2011, 133, 13810 CrossRef CAS PubMed.
- K. Hukushima and K. Nemoto, J. Phys. Soc. Jpn., 1996, 65, 1604 CrossRef CAS.
- E. Marinari and G. Parisi, Europhys. Lett., 1992, 19, 451 CrossRef CAS.
- U. H. Hansmann, Chem. Phys. Lett., 1997, 281, 140 CrossRef CAS.
- Y. Sugita and Y. Okamoto, Chem. Phys. Lett., 1999, 314, 141 CrossRef CAS.
- B. Hess, C. Kutzner, D. van der Spoel and E. Lindahl, J. Chem. Theory Comput., 2008, 4, 435 CrossRef CAS.
- G. A. Kaminski, R. A. Friesner, J. Tirado-Rives and W. L. Jorgensen, J. Phys. Chem. B, 2001, 105, 6474 CrossRef CAS.
- V. Blum, R. Gehrke, F. Hanke, P. Havu, V. Havu, X. Ren, K. Reuter and M. Scheffler, Comput. Phys. Commun., 2009, 180, 2175 CrossRef CAS.
- V. Havu, V. Blum, P. Havu and M. Scheffler, J. Comput. Phys., 2009, 228, 8367 CrossRef CAS.
- A. Tkatchenko, M. Rossi, V. Blum, J. Ireta and M. Scheffler, Phys. Rev. Lett., 2011, 106, 118102 CrossRef PubMed.
- A. Tkatchenko, A. Ambrosetti and R. A. DiStasio, J. Chem. Phys., 2013, 138, 074106 CrossRef PubMed.
- J. A. Stearns, O. V. Boyarkin and T. R. Rizzo, J. Am. Chem. Soc., 2007, 129, 13820 CrossRef CAS PubMed.
- M.-P. Gaigeot, M. Martinez and R. Vuilleumier, Mol. Phys., 2007, 105, 2857 CrossRef CAS.
- G. Bussi, D. Donadio and M. Parrinello, J. Chem. Phys., 2007, 126, 014101 CrossRef PubMed.
- D. Oepts, A. van der Meer and P. van Amersfoort, Infrared Phys. Technol., 1995, 36, 297 CAS.
- J. J. Valle, J. R. Eyler, J. Oomens, D. T. Moore, A. F. G. van der Meer, G. von Helden, G. Meijer, C. L. Hendrickson, A. G. Marshall and G. T. Blakney, Rev. Sci. Instrum., 2005, 76, 023103 CrossRef.
- M. F. Mesleh, J. M. Hunter, A. A. Shvartsburg, G. C. Schatz and M. F. Jarrold, J. Phys. Chem., 1996, 100, 16082 CrossRef CAS.
- M. F. Mesleh, J. M. Hunter, A. A. Shvartsburg, G. C. Schatz and M. F. Jarrold, J. Phys. Chem. A, 1997, 101, 968 CrossRef.
- MOBCAL – A Program to Calculate Mobilities, http://www.indiana.edu/nano/software.html, Downloaded in April 2013.
- F. L. Hirshfeld, Theor. Chim. Acta, 1977, 44, 129 CrossRef CAS.
- M. Kohtani, B. S. Kinnear and M. F. Jarrold, J. Am. Chem. Soc., 2000, 122, 12377 CrossRef CAS.
- T. D. Vaden, T. S. J. A. de Boer, J. P. Simons, L. C. Snoek, S. Suhai and B. Paizs, J. Phys. Chem. A, 2008, 112, 4608 CrossRef CAS PubMed.
- R. J. Plowright, E. Gloaguen and M. Mons, ChemPhysChem, 2011, 12, 1889 CrossRef CAS PubMed.
- T. R. Rizzo, J. A. Stearns and O. V. Boyarkin, Int. Rev. Phys. Chem., 2009, 28, 481 CrossRef CAS.
- A. Cimas, T. D. Vaden, T. S. J. A. de Boer, L. C. Snoek and M.-P. Gaigeot, J. Chem. Theory Comput., 2009, 5, 1068 CrossRef CAS.
- A. Barth, Biochim. Biophys. Acta, 2007, 1767, 1073 CrossRef CAS PubMed.
- A. Barth and C. Zscherp, Q. Rev. Biophys., 2002, 35, 369 CrossRef CAS PubMed.
- Q. Hu, P. Wang and J. Laskin, Phys. Chem. Chem. Phys., 2010, 12, 12802 RSC.
- X. Daura, K. Gademann, B. Jaun, D. Seebach, W. F. van Gunsteren and A. E. Mark, Angew. Chem., Int. Ed., 1999, 38, 236 CrossRef CAS.
- J. Oomens, B. G. Sartakov, G. Meijer and G. von Helden, Int. J. Mass Spectrom., 2006, 254, 1 CrossRef CAS.
- J. B. Pendry, J. Phys. C: Solid State Phys., 1980, 13, 937 CrossRef CAS.
- C. Baldauf, K. Pagel, S. Warnke, G. von Helden, B. Koksch, V. Blum and M. Scheffler, Chem. – Eur. J., 2013, 19, 11224 CrossRef CAS PubMed.
- B. Ma, C.-J. Tsai and R. Nussinov, Biophys. J., 2000, 79, 2739 CrossRef CAS PubMed.
- Y. Shi, Z. Xia, J. Zhang, R. Best, C. Wu, J. W. Ponder and P. Ren, J. Chem. Theory Comput., 2013, 9, 4046 CrossRef CAS PubMed.
- J. M. Scholtz and R. L. Baldwin, Annu. Rev. Biophys. Biomol. Struct., 1992, 21, 95 CrossRef CAS PubMed.
- X. Ren, P. Rinke, V. Blum, J. Wieferink, A. Tkatchenko, A. Sanfilippo, K. Reuter and M. Scheffler, New J. Phys., 2012, 14, 053020 CrossRef.
Footnotes |
| † Electronic supplementary information (ESI) available: Peptide synthesis and purification, experimental details for IRMPD and IM-MS measurements, simulation details. See DOI: 10.1039/c4cp05541a |
| ‡ Present address: CSIRO Materials Science and Engineering, Bayview Avenue, Clayton, Victoria 3168, Australia. |
| This journal is © the Owner Societies 2015 |