 Open Access Article
Creative Commons Attribution 3.0 Unported Licence
A water soluble fluorescent polymer as a dual colour sensor for temperature and a specific protein†
Sahika
Inal
a,
Jonas D.
Kölsch
b,
Frank
Sellrie
c,
Jörg A.
Schenk
cd,
Erik
Wischerhoff
e,
André
Laschewsky
*b and
Dieter
Neher
*a
aInstitute of Physics and Astronomy, University of Potsdam, Karl-Liebknecht-Str. 24-25, Potsdam, 14476, Germany. E-mail: neher@uni-potsdam.de
bInstitute of Chemistry, University of Potsdam, Karl-Liebknecht-Str. 24-25, Potsdam, 14476, Germany. E-mail: laschews@uni-potsdam.de
cUP Transfer GmbH, Am Neuen Palais 10, Potsdam, 14469, Germany
dHybrotec GmbH, Am Mühlenberg 11, Potsdam, 14476, Germany
eFraunhofer Institute for Applied Polymer Research, Geiselberg Str. 69, Potsdam, 14476, Germany
First published on 8th October 2013
Abstract
We present two thermoresponsive water soluble copolymers prepared via free radical statistical copolymerization of N-isopropylacrylamide (NIPAm) and of oligo(ethylene glycol) methacrylates (OEGMAs), respectively, with a solvatochromic 7-(diethylamino)-3-carboxy-coumarin (DEAC)-functionalized monomer. In aqueous solutions, the NIPAm-based copolymer exhibits characteristic changes in its fluorescence profile in response to a change in solution temperature as well as to the presence of a specific protein, namely an anti-DEAC antibody. This polymer emits only weakly at low temperatures, but exhibits a marked fluorescence enhancement accompanied by a change in its emission colour when heated above its cloud point. Such drastic changes in the fluorescence and absorbance spectra are observed also upon injection of the anti-DEAC antibody, attributed to the specific binding of the antibody to DEAC moieties. Importantly, protein binding occurs exclusively when the polymer is in the well hydrated state below the cloud point, enabling a temperature control on the molecular recognition event. On the other hand, heating of the polymer–antibody complexes releases a fraction of the bound antibody. In the presence of the DEAC-functionalized monomer in this mixture, the released antibody competitively binds to the monomer and the antibody-free chains of the polymer undergo a more effective collapse and inter-aggregation. In contrast, the emission properties of the OEGMA-based analogous copolymer are rather insensitive to the thermally induced phase transition or to antibody binding. These opposite behaviours underline the need for a carefully tailored molecular design of responsive polymers aimed at specific applications, such as biosensing.
Introduction
The need to continuously monitor and quantify an analyte or an environmental parameter in the fastest and cheapest way has been the driving force of sensor research for several decades. Given its facile operation, remote monitoring, easy read-out and high sensitivity, fluorescence is by far the most applied detection method.1,2 The output signal comes in a variety of ways namely the lifetime, anisotropy or intensity of the emission of the fluorescent probe. A well-exploited sensing strategy via fluorescence methods employs solvatochromic (environmentally sensitive) dyes which change their emission and/or absorbance properties with respect to physical or chemical changes in their surroundings.3 Such environmental changes, e.g., polarity or viscosity, can be induced by direct or indirect interactions of the fluorophore with target molecules whose presence and concentration can be correlated with the extent of alterations of the photophysical spectra.4–6 However, many of the conventional small molecule-based probes suffer from major limitations such as poor water solubility, low quantum yield, and low structural stability.7 Moreover, due to the presence of different media and an uncountable variety of targets to detect, not only new sensing schemes but also new materials are mandatory.1In this context, synthesis and characterization of a large variety of thermoresponsive polymers bearing covalently attached fluorophores has been reported.7–9 Typically, induced by an increase in solution temperature above their lower critical solution temperature (LCST), these polymers undergo a solubility transition which involves drastic, yet reversible changes in chain conformation and association behaviour.10 The chains, which are extended and exposed to water at lower temperatures, collapse and aggregate leading to the formation of relatively less mobile and less polar, polymer-rich domains at higher temperatures. The covalent incorporation of solvatochromic dyes, which are sensitive to the hydration state of polymer chains, is the key methodology to obtain a fluorescent output of this adaptive behaviour, and thereby to develop schemes that exploit the LCST transition for optical sensing.9 The fluorophore senses the changes in its micro-environment generated as a result of the polymer phase transition, and transforms these into a marked fluorescence read-out,11–21e.g., typically a hypsochromic (blue) shift and enhanced fluorescence intensity.22
Taking advantage of the delicate solubility of amphiphilic polymer chains in water, changes in the dye microenvironment can as well be induced by stimuli other than temperature. For instance, thermoresponsive N-isopropylacrylamide (NIPAm) based microgels bearing CdS quantum dots and phenylboronic acid groups swell upon binding of the glucose molecules to boronic acid moieties.23 In this swollen state of the microgel, the emission of the quantum dots is quenched. Similarly, Ohwada et al. reported a fluorogenic ion sensor based on NIPAm units, an ion-receptor, and a solvatochromic dye. Upon interaction of the receptor with target ions, the polymer coils undergo a three-dimensional conformational change to a globular form due to increased inter-segmental interactions, leading to an enhanced fluorescence signal.18 Such systems relying on the specific functionality, i.e., recognition unit of the polymer, enable sensing of a particular stimulant via fluorescence. In order to generate a dramatic change around the fluorophore by the receptor–analyte interactions, the mandatory condition is nano-sized control of the placement and distribution of receptor and fluorescent moieties,24 which generally requires rather challenging synthetic procedures. On the other hand, by utilizing merely the sensitivity of certain solvatochromic probes, few studies reported the detection of metal ions directly by changes in the fluorescence. The ions change the emission of the probes attached to thermoresponsive units in a water–ethanol environment,25 or incorporated into micro-or nano-gels.14,24 Here, rather than being only a scaffold, the polymer properties, i.e., the intrinsic response, can be exploited to endow a second functionality or to adjust the detection efficiency in terms of selectivity and sensitivity.7
Motivated by these previously reported designs, we envisaged to construct a proof of concept, multifunctional water soluble material which can report changes in solution temperature as well as in analyte concentration through its emission profile. For this purpose, we combined the fundamental ability of the responsive polymer to react on temperature changes with the sensitivity of the probe's fluorescence to a specific, targeted biological macromolecule. Instead of utilizing an additional moiety for molecular recognition, here, the fluorophore itself acts as the recognition unit. We incorporated a solvatochromic fluorophore, 7-(diethylamino)-coumarin-3-carboxylic acid (DEAC) via statistical copolymerisation into two well-established types of thermoresponsive polymers based on either NIPAm or on a mixture of 2-(2′-methoxyethoxy)ethylmethacrylate (MEO2MA) and oligo(ethylene glycol) methacrylate (OEGMA) monomers. The resulting NIPAm-based copolymer reports the LCST-type phase transition via a remarkable fluorescence output. Such a change in fluorescence characteristics is also induced as a monoclonal anti-DEAC antibody is injected into the solution. This biological sensing can be (de)activated simply by tuning the conformation of polymer chains with temperature. We suggest that the correlation of fluorescence enhancement with the solution temperature and antibody concentration should pave the way for new strategies of the detection and quantification of multiple stimuli using responsive polymers.
The NIPAm-based platform is furthermore intriguing as a biological assay. Above the LCST of the polymer, a fraction of the bound antibody is released from the polymer-attached DEAC sites out to the solution. In the presence of the DEAC-functionalized monomer in this mixture, the released antibody binds to the monomer enabling rather effective inter-chain aggregation/collapse. This competitive binding mechanism can be directly monitored from the polymer's temperature–turbidity profile. Remarkably, when the same dye is attached to the polymethacrylate bearing OEG side chains, we find that the fluorescence properties are almost insensitive to the polymer phase transition as well as to the presence of the antibody. This contrasting behaviour stresses the importance of structural considerations for the design of such molecular sensors.
Materials and methods
Synthetic procedures
2-(2′-Methoxyethoxy)ethyl methacrylate (MEO2MA, Aldrich, 95%, stabilized with 100 ppm 4-methoxyphenol (MEHQ) and 300 ppm 2,6-di-tert-butyl-4-methylphenol) and oligo(ethylene glycol) monomethylether methacrylate (OEGMA, Aldrich, Mn = 475 g mol−1, stabilized with 100 ppm MEHQ and 200 ppm 2,6-di-tert-butyl-4-methylphenol) were passed through a basic alumina column to remove inhibitors before use. 2,2′-Azobisisobutyronitrile (AIBN, Acros, 98%) was crystallized from methanol before use. Other chemicals were purchased and used without further purification as received: N-isopropylacrylamide (NIPAm) (Acros, 99%, stabilized with 500 ppm MEHQ), 4-(diethylamino)-2-hydroxybenzaldehyde (Synthon, 99%), diethylmalonate (Merck, >98%), piperidine (Acros, 99% extra pure), sodium hydroxide (Chemsoulte, 99%), pyridine (Merck, >99%), 2-aminoethylmethacrylate hydrochloride (Acros, 90% stabilized with 500 ppm phenothiazine), thionyl chloride (Acros, 99.7%), and phosphate buffered saline (PBS, Fluka).Synthesis of 7-(diethyl amino)-2-oxo-2H-chromene-3-carboxylic acid (7-(diethylamino) 3-carboxy coumarin) (1)
4-Diethylaminosalicylaldehyde (3.86 g, 0.02 mmol), diethylmalonate (6.4 g, ρ = 1.06 g mL−1, 0.04 mmol), and piperidine (82 mL) were stirred in 60 mL of ethanol at 120 °C for 10 h. The mixture was then cooled to room temperature, and 60 mL of NaOH (2 M) was added. The mixture was stirred at 120 °C for 30 min. The pH of the reaction mixture was adjusted to ca. 2 by titration of hydrochloric acid while cooling the mixture in an ice bath. The orange precipitate formed was filtered off and crystallized in ethanol. Yield: 2.89 g (11.06 mmol, 55%); mp. 230 °C. Mass spectrum (ESI) signal at 262.1079 [M + H]+, 284.0899 [M + Na]+ found: 262.1092 [M + H]+, 284.0924 [M + Na]+. Elemental analysis (C14H15NO4): calcd: C = 64.36%, H = 5.79%, N = 5.36%, found: C = 64.03%, H = 5.60%, N = 5.79%; FT-IR (cm−1) selected bands: 2982 ν(CH2), 2935 ν(CH2), 1737 ν(C![[double bond, length as m-dash]](https://www.rsc.org/images/entities/char_e001.gif) O), 1669 ν(C
O), 1669 ν(C![[double bond, length as m-dash]](https://www.rsc.org/images/entities/char_e001.gif) O), 1611 ν(C
O), 1611 ν(C![[double bond, length as m-dash]](https://www.rsc.org/images/entities/char_e001.gif) C), 1582 ν(C
C), 1582 ν(C![[double bond, length as m-dash]](https://www.rsc.org/images/entities/char_e001.gif) C); 1H NMR (300 MHz, CDCl3): δ = 12.35 (s, 1H, OH), 8.65 (s, 1H, C
C); 1H NMR (300 MHz, CDCl3): δ = 12.35 (s, 1H, OH), 8.65 (s, 1H, C![[double bond, length as m-dash]](https://www.rsc.org/images/entities/char_e001.gif) CH), 7.45 (d, J = 9.0 Hz, 1H, CHaromatic), 6.71 (dd, J1 = 9.0 Hz, J2 = 2.4 Hz, 1H, CHaromatic), 6.53 (d, J = 2.2 Hz, 1H, CHaromatic), 3.50 (q, J = 7.1 Hz, 4H, CH2), 1.27 (t, J = 7.1 Hz, 6H, CH3), 13C NMR (75 MHz, CDCl3): δ = 165.6, 164.5, 158.2, 153.9, 150.4, 132.0, 111.0, 108.7, 105.8, 97.0, 45.4, 12.5.
CH), 7.45 (d, J = 9.0 Hz, 1H, CHaromatic), 6.71 (dd, J1 = 9.0 Hz, J2 = 2.4 Hz, 1H, CHaromatic), 6.53 (d, J = 2.2 Hz, 1H, CHaromatic), 3.50 (q, J = 7.1 Hz, 4H, CH2), 1.27 (t, J = 7.1 Hz, 6H, CH3), 13C NMR (75 MHz, CDCl3): δ = 165.6, 164.5, 158.2, 153.9, 150.4, 132.0, 111.0, 108.7, 105.8, 97.0, 45.4, 12.5.
Synthesis of 2-(7-(diethylamino)-2-oxo-2H-chromene-3-carboxlic acid amido) ethyl-methacrylate (2)
Thionyl chloride (0.33 mL, ρ = 1.64 g mL−1, 4.59 mmol) was carefully added to the mixture of 7-(diethylamino)-2-oxo-2H-chromene-3-carboxylic acid (1, 1.00 g, 3.83 mmol) in pyridine. The colour of the mixture changed from green to red and then finally to black. Upon stirring this mixture for 1 h at room temperature, 2-aminoethylmethacrylate hydrochloride (755 mg, 4.67 mmol) was added to the mixture. After stirring overnight at room temperature, the solvent was evaporated, the residue was dissolved in a small amount of acetone, and this solution was poured into water. The yellow precipitate was collected via filtration. Yield: 1.28 g (3.31 mmol, 86%); mp. 103 °C. Mass spectrum (ESI) signal at 373.1763 [M + H]+, found: 373.1735 [M + H]+. Elemental analysis: calcd: C = 64.5%, H = 6.5%, N = 7.52%, found: C = 62.9%, H = 6.25%, N = 7.55%; FT-IR (cm−1) selected bands: 3334 ν(NH), 2975 ν(CH2), 2926 ν(CH2), 1698 ν(C![[double bond, length as m-dash]](https://www.rsc.org/images/entities/char_e001.gif) O), 1650 δ(NH), 1616 ν(C
O), 1650 δ(NH), 1616 ν(C![[double bond, length as m-dash]](https://www.rsc.org/images/entities/char_e001.gif) C), 1583 ν(C
C), 1583 ν(C![[double bond, length as m-dash]](https://www.rsc.org/images/entities/char_e001.gif) C); 1H NMR (300 MHz, CDCl3): δ = 9.08 (s, 1H, CONH), 8,70 (s, 1H, C
C); 1H NMR (300 MHz, CDCl3): δ = 9.08 (s, 1H, CONH), 8,70 (s, 1H, C![[double bond, length as m-dash]](https://www.rsc.org/images/entities/char_e001.gif) CH), 7.43 (d, J = 9.0 Hz, 1H, CHaromatic), 6.65 (d, J = 9.0 Hz, 1H, CHaromatic), 6.50 (s, 1H, CHaromatic), 6.20 (s, 1H, C
CH), 7.43 (d, J = 9.0 Hz, 1H, CHaromatic), 6.65 (d, J = 9.0 Hz, 1H, CHaromatic), 6.50 (s, 1H, CHaromatic), 6.20 (s, 1H, C![[double bond, length as m-dash]](https://www.rsc.org/images/entities/char_e001.gif) CH2,methacrylate), 5.60 (s, 1H, C
CH2,methacrylate), 5.60 (s, 1H, C![[double bond, length as m-dash]](https://www.rsc.org/images/entities/char_e001.gif) CH2,methacrylate), 4.32 (t, J = 5.5 Hz, 2H, CH2), 3.76 (q, J = 5.6 Hz, 2H, CH2), 3.46 (q, J = 7.1, 4H, CH2), 1.98 (s, 3H, CH3,methacrylate), 1.24 (t, J = 7.1, 6H, CH3) 13C NMR (75 MHz, CDCl3) δ = 167.4, 163.5, 162.9, 157.9, 152.8, 148.4, 131.3, 126.2, 110.2, 108.6, 96.8, 63.6, 45.3, 38.6, 18.5, 12.6.
CH2,methacrylate), 4.32 (t, J = 5.5 Hz, 2H, CH2), 3.76 (q, J = 5.6 Hz, 2H, CH2), 3.46 (q, J = 7.1, 4H, CH2), 1.98 (s, 3H, CH3,methacrylate), 1.24 (t, J = 7.1, 6H, CH3) 13C NMR (75 MHz, CDCl3) δ = 167.4, 163.5, 162.9, 157.9, 152.8, 148.4, 131.3, 126.2, 110.2, 108.6, 96.8, 63.6, 45.3, 38.6, 18.5, 12.6.
Synthesis of the copolymers
Preparation of the monoclonal anti-DEAC antibody
The monoclonal antibody G100-HB9 was generated by standard hybridoma technology using electrofusion.26 In brief, spleen cells of Balb/c mice immunized with a DEAC–KLH-conjugate (keyhole limpet hemocyanin, emp biotech, Berlin, Germany) were fused with the myeloma cell line P3 × 63Ag8.653 (ATCC CRL-1580). Positive clones were screened for binding DEAC–ovalbumin (emp biotech) in an indirect ELISA and verified in a competitive ELISA using free DEAC. Clone G100-HB9 was mass-produced in serum free medium and the antibody was purified on protein A columns to avoid contamination with SLPI.27Photophysical characterization
Absorption spectra of solutions were recorded with a Varian Cary 5000 spectrometer. Turbidity measurements were performed on a Varian Cary 50 UV-VIS photometer. The transmittance of polymer solutions at 700 nm was monitored as a function of temperature (with a heating–cooling cycle at rates of 0.1 °C min−1, cell path length of 12 mm). Steady-state fluorescence spectra were recorded with a HORIBA Jobin Yvon Fluorolog-3. The samples in PMMA cells of 1 cm path length were excited at the wavelength of their maximum absorption and the emission was detected at the front face. PL quantum efficiencies were determined with a Hamamatsu C9920 set-up, including an integrating sphere combined with a photonic multi-channel analyzer. The time-resolved fluorescence measurements were performed by using a single photon counting setup (TCSPC) with a Becker&Hickl PML-spectrometer (modified Oriel MS-125). As the excitation source, a picosecond diode laser at 405 nm was operated at a repetition rate of 20 MHz. The detector comprises a Becker&Hickl PML-16-C-1 (modified Hamamatsu) multi-alkaline photomultiplier. Considering that | (1) |
 | (2) |
A cuvette holder equipped with a Peltier element was used to perform temperature-dependent measurements. Each spectrum is acquired after reaching equilibrium, i.e., assuring that both the intensity and the shape of the spectrum are stable 15 minutes after reaching the desired temperature.
Competitive enzyme-linked immunosorbent assay (ELISA) tests
To evaluate the binding of the monoclonal antibody (G100-HB9) to the DEAC-containing polymers, a competitive ELISA was performed. G100-HB9 was added together with different dilutions of polymers or DEAC-labelled monomer 2, to the DEAC–ovalbumin coated and blocked (5% NCS in PBS) microtiter plate for 1 h. After washing with tap water, a goat anti-mouse-IgG antibody conjugated to horseradish peroxidase (HRP) was added and the ELISA stained with a tetramethylbenzidine (TMB) substrate according to standard protocols.28Results and discussion
In analogy with a recently reported procedure,21,29 we prepared the fluorescent thermoresponsive polymers by free radical copolymerisation of the DEAC-functionalized methacrylate monomer with an appropriate amount of NIPAm or with the mixture of MEO2MA and OEGMA. Fig. 1 shows the synthesis of the fluorescent monomer (2) and the chemical structure of the resulting copolymers.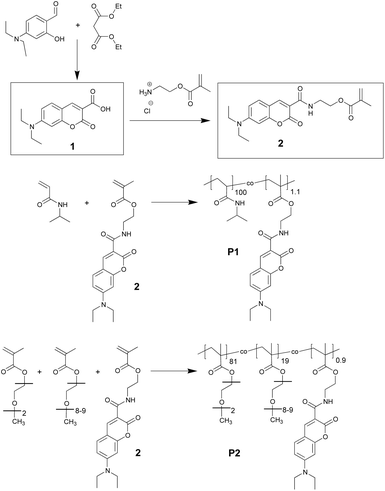 | ||
| Fig. 1 Synthesis of the DEAC-functionalized monomer (2) and of the thermoresponsive copolymers: labelled pNIPAm (P1), and labelled p(MEO2MA-co-OEGMA) (P2). | ||
The analytical data of these copolymers are summarised in Table 1. The polymerization was performed such that it yielded roughly the same degree of polymerisation and dye concentration for both polymers. Because of the higher average molar mass of the repeat unit, the Mw and Mn of P2 are larger than those of P1. The incorporation of the dye into the copolymer structure was quantified via UV-VIS spectroscopy. As expected, the incorporation of the hydrophobic dye shifted the LCST of original polymers to lower temperatures. The fact that the average number of fluorophores per polymer chain is greater than one might result in photophysical characteristics different than those of the isolated monomer.
| Polymer | M appn [kg mol−1] | M appw/Mappna | DPb | Dye contentc [% mol] | NCd | Cloud pointe [°C] | T (50%)f [°C] |
|---|---|---|---|---|---|---|---|
| a Determined by size exclusion chromatography in DMF, using polystyrene standards. b Nominal number average of monomer repeat units per polymer chain. c Calculated from the UV-VIS spectra of the monomer and the copolymer solutions in CHCl3 according to Beer–Lambert's law (molar extinction coefficient (ε): 35.000 L mol−1 cm−1). d Average number of fluorophores per polymer chain. e Onset of the decrease of transmission in PBS solution (2 g L−1). f Temperature at which the transmission is reduced by 50% in PBS solution (2 g L−1). | |||||||
| P1 | 23 | 1.9 | 196 | 1.1 | 2.2 | 20 | 23 |
| P2 | 44 | 2.5 | 177 | 0.9 | 1.6 | 41 | 44 |
As their photophysical properties depend strongly on polarity, viscosity, pH, and hydrogen bonding ability of the microenvironment, 7-aminocoumarins have received considerable interest for chemo-sensing applications.30,31 Due to the push–pull character of the conjugated system, upon electronic excitation, the excited state forms an intramolecular charge transfer (ICT) state.2 For some derivatives of 7-aminocoumarins, depending on the strength of the electron donating and accepting capabilities of the related moieties,32 the amino group undergoes an internal rotation upon photoexcitation, resulting in full charge separation through a perpendicularly orientated donor orbital with respect to that of the acceptor.22 This is called a twisted ICT (TICT) state, the formation of which is facilitated in polar solvents, and which decays non-radiatively leading to a decreased yield of emission from the ICT state.33–35 A complete list of photophysical findings of the DEAC-functionalized monomer dissolved in a variety of solvents can be found in Table S1.† Due to its ICT character, when the monomer is dissolved in solvents of high polarity, the emission maximum shifts bathochromically accompanied with a decrease in quantum yield and fluorescence lifetime.2 These effects are more pronounced in protic solvents. Also, the quantum yield is considerably enhanced in solvents of high viscosity, ascribed to inhibition of the TICT state.
As shown in Fig. 2, we observe marked changes in the emission properties of the aqueous P1 solution upon increasing its temperature. In the photoluminescence (PL) spectra, the formerly two, weakly emitting bands at 20 °C evolve into a single emission component at higher temperatures. While the red-emitting band disappears, the intensity of the higher energy emission increases by about 6 fold, with the maximum shifting to shorter wavelengths. The quantum yield of the dye attains a value even higher than that measured in a structurally similar solvent, i.e., N-methylformamide (φ: 9%). These findings point to a highly rigid/viscous environment which limits encounters of the dye with water and enhances encounters between polymer segments. Accordingly, absorbance and time-resolved PL measurements exhibit marked changes upon increasing the solution temperature, e.g., an abrupt increase in scattering intensity and a longer lifetime extracted for emission at 475 nm (Fig. S1 and S2†).
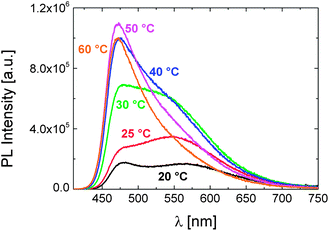 | ||
| Fig. 2 The evolution of the PL spectra of P1 in PBS (0.15 g L−1) with temperature, recorded at an excitation wavelength of 400 nm. | ||
Note that the emission spectrum of the aqueous monomer solution exhibits no such response to temperature in the examined range (Fig. S3†). Therefore, the temperature-triggered changes in the emission profile of P1 are attributed to its phase transition, which sets in as the solution temperature is raised above 20 °C (cf. Table 1). Notably, the emission spectra of the monomer and of the polymer solution in PBS do not resemble each other, i.e. the monomer spectrum involves only the peak centred at about 475 nm. For the polymer, the species responsible for the emission at longer wavelengths also exhibit a ground-state absorption (Fig. S1†). With its relatively long emission lifetime (>10 ns), this feature is only encountered in aqueous solutions of P1 below its LCST and disappears when the P1 concentration is lower than 10−4 g L−1 (Fig. S4†). These findings evidence the presence of DEAC aggregates, promoted presumably by interchain associations. Although it is generally favoured that the photophysical properties of the label are preserved upon incorporation into the polymer structure, the possibility to modulate the relative emission intensity of the two emitting species, i.e., the single dye and its aggregates, by a stimulus, such as the temperature here, makes this polymer very promising and advantageous to construct a dual-colour sensor.
Apart from the distinguished fluorescence response to variations in solution temperature, P1 alerts the presence of a monoclonal antibody through its optical spectra. When the anti-DEAC antibody is introduced into the aqueous P1 solution, remarkable changes in the PL characteristics are induced (Fig. 3). Despite the similarity to those triggered by increasing temperature, these changes are more drastic: while the aggregate band is suppressed, the emission from the isolated dye moieties at shorter wavelengths builds up. The slight blue shift in λPLmax points to a more hydrophobic environment around the dye. As more protein is present in the solution, we measure a longer lifetime of the emission at 475 nm (Fig. S5†). For a polymer concentration of 0.005 g L−1, the presence of the antibody in the solution at any concentration between about 6 and 300 nM invokes correspondingly different emission intensity values, evident from the linear region shown in Fig. 3b. Also, as scattering does not interfere, the antibody-induced changes in the absorbance spectrum are clearly visible, and qualitatively correlated with its concentration (Fig. 4).
![(a) Fluorescence spectra of P1 solution in PBS (0.005 g L−1) at 15 °C containing varying amounts of the antibody [from 6.7 nM to 660 nM]. The direction of the arrows shows the increase in antibody concentration. The excitation wavelength is 400 nm. (b) The relative change of the maximum emission intensity as a function of antibody concentration. Data are taken from Fig. 3a.](/image/article/2013/TB/c3tb21245a/c3tb21245a-f3.gif) | ||
| Fig. 3 (a) Fluorescence spectra of P1 solution in PBS (0.005 g L−1) at 15 °C containing varying amounts of the antibody [from 6.7 nM to 660 nM]. The direction of the arrows shows the increase in antibody concentration. The excitation wavelength is 400 nm. (b) The relative change of the maximum emission intensity as a function of antibody concentration. Data are taken from Fig. 3a. | ||
![Absorbance spectra of P1 solution in PBS (0.005 g L−1) at 15 °C containing varying amounts of the antibody [from 6.7 nM to 660 nM]. The direction of the arrow shows the increase in antibody concentration.](/image/article/2013/TB/c3tb21245a/c3tb21245a-f4.gif) | ||
| Fig. 4 Absorbance spectra of P1 solution in PBS (0.005 g L−1) at 15 °C containing varying amounts of the antibody [from 6.7 nM to 660 nM]. The direction of the arrow shows the increase in antibody concentration. | ||
In Fig. 3 and 4, almost complete disappearance of the spectroscopic features attributed to DEAC aggregates evidences their disruption which might indicate changes in chain conformation/association. In parallel to these, the presence of antibody in the solution shifts the LCST of P1 to somewhat higher temperatures accompanied by lowered turbidity values (Fig. 5a). Here, in addition to the increased hydrophilicity that the polymer chains attain upon complexation with the antibody, steric hindrance might play a role in retarding and/or hindering the interchain aggregation.
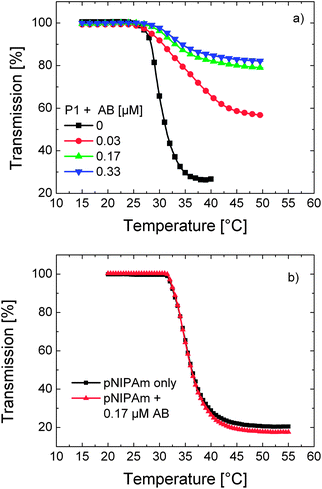 | ||
| Fig. 5 Temperature–transmission profiles of (a) P1 solution in PBS (0.1 g L−1) containing varying amounts of the antibody (AB) (0, 0.03, 0.17, and 0.33 μM) and (b) a solution of unlabelled pNIPAm in PBS (0.01 g L−1) in the presence (red triangles) and absence of the antibody (0.17 μM) (black squares). | ||
Nevertheless, the effect of the interaction of a thermoresponsive polymer with another macromolecule is a priori not obvious. For instance, Rimmer et al. reported that binding of highly branched pNIPAm to a Gram negative bacterium decreased the LCST of the polymer by more than 20 °C.36 On the other hand, the phase transition temperature of a biotinylated OEGMA-based copolymer shifted to higher temperatures upon specific binding of Avidin to the biotin moieties.37 The direction of the LCST shift depends thus on the type of the analyte, on the recognition unit, and on the nature of interactions between these groups and water. It must be emphasised that pNIPAm synthesised analogously to P1 but devoid of DEAC moieties does not exhibit changes in its turbidity profile in the presence of the antibody (Fig. 5b). This reveals that the LCST shift of P1 is caused by the specific binding of the antibody to DEAC, rather than a complexation with NIPAm units. Apparently, when the antibody captures a dye, the co-aggregated chains are separated and further aggregation is inhibited. Within the binding pocket of the antibody, the dye has a rigid, water-free, and relatively nonpolar environment. This situation may be comparable to the enhanced fluorescence of DEAC dyes upon their inclusion in the hydrophobic nanocavities of cyclodextrins.34 The increase in emission intensity was attributed to the inhibition of the TICT state in such an environment.
Injection of the antibody into the solution of P1 at 40 °C, i.e. well above its LCST, does affect neither the shape nor the intensity of the PL spectrum. However, when this mixture is cooled down to 15 °C, we once again detect marked photophysical changes indicative of the binding event (for the evolution of PL and absorbance spectra with the relevant heating and injection steps, see Fig. S6†). Regulating the access of a recognition unit linked to a thermoresponsive polymer by the particular temperature sensitivity of the chains has been reported before.38–40 Apparently, DEAC is accessible to the antibody only when P1 chains adopt a well-extended conformation, whereas their collapse blocks the binding sites. Therefore, by exploiting the intrinsic response of pNIPAm to temperature, i.e., changing the conformational state of the chains, we can switch the protein sensing on and off.
The control of biological sensing with temperature led us to the question whether the antibody bound to P1 is available for competitive binding. Fig. 6 shows that after treatment with a 20 fold excess of DEAC molecules (the functional monomer 2), the mixture of P1 (0.01 g L-1) with 0.17 μM of antibody exhibits a “re-clouding”. This ternary mixture was prepared by injecting the DEAC labelled monomer into the solution, comprising of P1 and the antibody, either at 15 °C followed by heating to 40 °C or directly at 40 °C (lines c and d, respectively). Scattering is clearly identified by the appearance of an absorption tail which extends towards the NIR region. Note that the addition of the fluorescent monomer to pure P1 solution does not introduce such a scattering contribution (Fig. S7†). In all experiments, the heating times and rates were identical, excluding the effect of annealing on the size/density of globules formed, therefore on the scattering intensity.
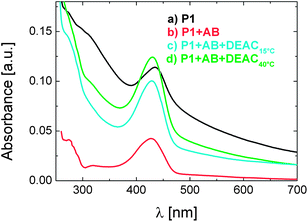 | ||
| Fig. 6 Absorbance spectra of aqueous solutions of P1 (0.01 g L−1) recorded at 40 °C: (a) pure P1 solution, (b) the mixture of P1 with antibody (0.17 μM), (c) the ternary mixture of P1 with antibody (0.17 μM) and with the DEAC-labelled monomer (4 μM) added at 15 °C before heating, and (d) the ternary mixture of P1 with antibody (0.17 μM) and with DEAC-labelled monomer (4 μM) added at 40 °C. The heating time after reaching the designated temperature, i.e., 40 °C was identical and lasted for 60 min. | ||
The increase in turbidity (compared to the binary mixture of P1 with the antibody) in the presence of the DEAC-labelled monomer indicates that a fraction of the antibody is released from the polymer-attached DEAC sites at 40 °C. Apparently, the detached antibody forms new complexes with the monomer available in the solution so that P1 chains can more efficiently collapse and inter-aggregate.
The question then remains whether this competitive binding occurs already at 15 °C or whether the process necessitates elevated temperatures. One way to address this is to examine the effect of monomer addition at 15 and at 40 °C on the fluorescence spectrum of the binary mixture at the respective temperature. As pointed out above (cf. Fig. 2), the emission spectrum of the P1 solution below its LCST includes an aggregate-assigned band at ca. 575 nm. While this feature is still visible in the spectrum of the P1 solution at 40 °C, it becomes fully suppressed upon addition of a sufficient amount of the antibody at 15 °C, below the LCST (cf. Fig. 3a). Here, we detect that the aggregate emission reappears as the monomer is injected into the mixture at 40 °C (Fig. S8a†), while no such effect is present for the low temperature spectrum of the ternary mixture prepared at 15 °C (Fig. S8b†). This shows that below the LCST, the antibody is not released from the polymer. The driving force of the observed antibody detachment at 40 °C is yet not clear, but it might be related to a temperature-activated process, e.g., increased mobility/diffusion of the sensing components or the dehydration of the chains. There have been examples in which the latter was assigned as the trigger of similar kinds of dissociation mechanisms. For example, Stayton and co-workers reported that the biotin bound-streptavidin functionalized-NIPAm chains released a significant amount of the biotin upon heating the mixture above its LCST.40,41 Importantly, at this temperature, the released antibody cannot re-bind to the DEAC sites of P1 as chain collapse and aggregation partly block the accessibility of the polymer-bound dye. Instead, it remains stably bound to the low molar mass dye present excessively in the solution. The relatively firm nature of the new antibody–DEAC complexes is evidenced by the temperature–transmission profile of the ternary mixture that was cooled down to room temperature and reheated, shown in Fig. 7. The ternary mixture displays a situation that is intermediate between the presence of only pure P1 (no interference to interchain aggregation) and the case where P1 solution is saturated with the antibody (full suppression of inter-aggregation).
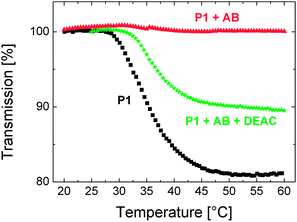 | ||
| Fig. 7 Temperature–transmission profile of the aqueous solution of P1 (0.01 g L−1, black squares), containing 0.17 μM of antibody (red triangles), and containing both the antibody (0.17 μM) and the DEAC-labelled monomer (4 μM) (green stars). The profiles were recorded for the same solutions labelled a, b, and d of Fig. 6. | ||
We, therefore, suggest that the competitive binding mechanism is activated only above the cloud point of the polymer and that this proof of concept experiment might pave the way for sensor assays utilizing thermoresponsive polymers. Scheme 1 depicts the proposed mechanism of sensing with P1.
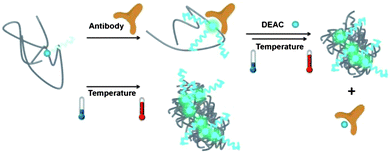 | ||
| Scheme 1 Dual responsiveness of P1 to the presence of antibody and to increasing the solution temperature above the cloud point. In the absence of antibody and/or at low temperatures, the emission from the DEAC label is weak. Upon formation of globules at elevated temperatures and/or binding of the antibody at low temperatures, the emission becomes intense. When heated, the antibody attached to P1 chains is released out to the solution where it forms new complexes with the DEAC-labelled monomer. This promotes inter-aggregation of P1 chains. | ||
In comparison, we also examined the effect of temperature on photophysical properties of the OEGMA-based copolymer P2. To our surprise, no change in emission properties could be associated with its phase transition. Fig. 8 demonstrates the temperature independent shape of the PL spectrum. As the fluorescence intensity decreases gradually with the increase in temperature, the average fluorescence lifetime also shortens (Fig. S9†). These observations are attributed to the heat-facilitated non-radiative deactivation processes.22,42
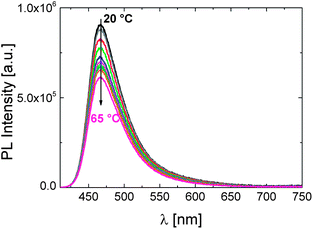 | ||
| Fig. 8 The effect of temperature on the fluorescence characteristics of P2 in PBS (0.15 g L−1). The excitation wavelength is 400 nm. The direction of the arrow shows the increase in the solution temperature from 20 to 65 °C. | ||
Although copolymers like P2 exhibit an LCST-transition,29,37,43 the constant λPLmax below and above the cloud point suggests that the dye's environment is not affected by phase transition. This is quite impressive considering the distinct response of DEAC to pNIPAm phase transition. This dependence of the dye's fluorescence response to the chemical structure of the polymer was observed for another solvatochromic fluorophore, a naphthalimide derivative, incorporated into NIPAm- or OEGMA-based copolymers analogous to P1 and P2, respectively.21 Certain peculiarities about the aqueous solubility and phase transition behaviour of the P2-like copolymer were found out, presumably associated with the lack of intermolecular hydrogen bonding and the limited dehydration of long OEG side chains. When bound to a polymethacrylate backbone, it seems that the rather hydrophobic microenvironment of the fluorophore is preserved due to a particular arrangement of neighbouring molecules. Therefore, although P2 is relatively emissive in aqueous solutions (φ: 25%), it does not feature the temperature sensing ability of P1.
We, lastly, addressed the effect of antibody binding on the optical spectra of P2. It was proven by ELISA tests that the antibody also binds to the DEAC moieties of P2, upon which the LCST shifts to slightly higher temperatures (Fig. S11 and S12†). However as opposed to P1, the emission peak displays a bathochromic shift of ca. 8 nm with a slight decrease in its intensity while there is no significant change in the absorbance spectrum (Fig. 9). With respect to PL spectra, similar observations were reported for a chromophore-modified cyclodextrin upon its interaction with guest molecules.44 Bound to the guest molecule, the chromophore inherently located in the interior of the hydrophobic cavity of dextrin was excluded into the polar aqueous solution. Although the dyes which are bound to the antibody have now less segmental mobility, i.e. an inhibited TICT state, this new environment might be less hydrophobic than that provided by the polymer chains, leading to the slight red-shift in the emission spectrum. On the other hand, the antibody complexion with a certain fraction of the dyes might enhance the water exposure of some others as a result of the expansion of the chains. A detailed analysis on the processes responsible for such spectral changes is on the way.
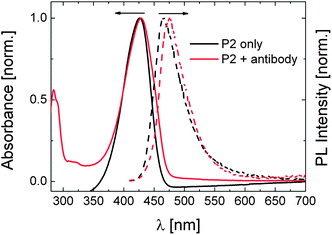 | ||
| Fig. 9 Normalised absorbance (solid lines) and PL (dashed lines) spectra of the aqueous solution of P2 (0.01 g L−1) in the presence and absence of 0.17 μM of antibody at 20 °C. The absolute PL spectra are given in Fig. S10.† | ||
Conclusions
We demonstrate the synthesis and photophysical characterisation of two thermoresponsive polymers bearing a covalently attached TICT-type DEAC dye, promising for optical sensing applications. In aqueous solutions of the OEGMA-based polymer, the quantum yield of DEAC is relatively high. The dye is mostly insensitive to the polymer phase transition, and to the anti-DEAC antibody. In contrast, aqueous solutions of the NIPAm-based polymer exhibit a very weak emission at low temperatures or in the absence of antibody, which increases dramatically above the LCST or upon binding of the antibody. Heating of the solution of antibody-bound polymer above its cloud point releases a fraction of the immobilized antibody. In the presence of the DEAC-labelled monomer in this mixture, the detached antibody binds competitively to the low molar mass monomer allowing the free polymer chains to aggregate. Consequently, on one hand, this work presents a water soluble polymer with a distinct fluorescence response towards temperature and a biological macromolecule. On the other hand, by comparing two analogous DEAC-labelled polymers, the need to design a specific polymer structure is stressed, e.g., composed of alternative thermo-sensitive blocks, one of which only produces a marked fluorescence signal of the thermal transition, or of the binding event.Acknowledgements
The work was funded by the BMBF-Initiative “Spitzenforschung und Innovation in den neuen Ländern” within the cooperative project “Taschentuchlabor – Impulszentrum für Integrierte Bioanalyse” (FKZ 03IS2201B). S.I. thanks Sina Reiter (University of Potsdam) for her assistance in the lab and Sandor Dippel (University of Potsdam) for turbidity measurements.References
- L. Basabe-Desmonts, D. N. Reinhoudt and M. Crego-Calama, Chem. Soc. Rev., 2007, 36, 993–1017 RSC.
- J. R. Lakowicz, Principles of Fluorescence Spectroscopy, Springer, 2009 Search PubMed.
- G. S. Loving, M. Sainlos and B. Imperiali, Trends Biotechnol., 2010, 28, 73–83 CrossRef CAS PubMed.
- N. Marmé, J.-P. Knemeyer, M. Sauer and J. Wolfrum, Bioconjugate Chem., 2003, 14, 1133–1139 CrossRef PubMed.
- A. P. de Silva, H. Q. N. Gunaratne, T. Gunnlaugsson, A. J. M. Huxley, C. P. McCoy, J. T. Rademacher and T. E. Rice, Chem. Rev., 1997, 97, 1515–1566 CrossRef CAS PubMed.
- S. Banerjee, E. B. Veale, C. M. Phelan, S. A. Murphy, G. M. Tocci, L. J. Gillespie, D. O. Frimannsson, J. M. Kelly and T. Gunnlaugsson, Chem. Soc. Rev., 2013, 42, 1601–1618 RSC.
- J. Hu and S. Liu, Macromolecules, 2010, 43, 8315–8330 CrossRef CAS.
- C. Li and S. Liu, Chem. Commun., 2012, 48, 3262–3278 RSC.
- C. Pietsch, U. S. Schubert and R. Hoogenboom, Chem. Commun., 2011, 47, 8750–8765 RSC.
- V. Aseyev, H. Tenhu and F. M. Winnik, Adv. Polym. Sci., 2011, 242, 29–89 CrossRef CAS.
- C. Pietsch, R. Hoogenboom and U. S. Schubert, Angew. Chem., Int. Ed., 2009, 48, 5653–5656 CrossRef CAS PubMed.
- K. Iwai, Y. Matsumura, S. Uchiyama and A. P. de Silva, J. Mater. Chem., 2005, 15, 2796–2800 RSC.
- C. Gota, K. Okabe, T. Funatsu, Y. Harada and S. Uchiyama, J. Am. Chem. Soc., 2009, 131, 2766–2767 CrossRef CAS PubMed.
- C. Li and S. Liu, J. Mater. Chem., 2010, 20, 10716–10723 RSC.
- S. Uchiyama, Y. Matsumura, A. P. de Silva and K. Iwai, Anal. Chem., 2003, 75, 5926–5935 CrossRef CAS PubMed.
- L. Yin, C. He, C. Huang, W. Zhu, X. Wang, Y. Xu and X. Qian, Chem. Commun., 2012, 48, 4486–4488 RSC.
- Y. Shiraishi, R. Miyamoto, X. Zhang and T. Hirai, Org. Lett., 2007, 9, 3921–3924 CrossRef CAS PubMed.
- M. Onoda, S. Uchiyama and T. Ohwada, Macromolecules, 2007, 40, 9651–9657 CrossRef CAS.
- Q. Yan, J. Yuan, Y. Kang, Z. Cai, L. Zhou and Y. Yin, Chem. Commun., 2010, 46, 2781–2783 RSC.
- F. Li, A. H. Westphal, A. T. M. Marcelis, E. J. R. Sudholter, M. A. Cohen Stuart and F. A. M. Leermakers, Soft Matter, 2011, 7, 11211–11215 RSC.
- S. Inal, J. D. Kölsch, L. Chiappisi, D. Janietz, M. Gradzielski, A. Laschewsky and D. Neher, J. Mater. Chem. C, 2013, 1, 6603–6612 RSC.
- B. Valeur, in Molecular Fluorescence, Wiley-VCH Verlag GmbH, 2001, pp. 34–71 Search PubMed.
- W. Wu, T. Zhou, J. Shen and S. Zhou, Chem. Commun., 2009, 4390–4392 RSC.
- T. Liu, J. Hu, J. Yin, Y. Zhang, C. Li and S. Liu, Chem. Mater., 2009, 21, 3439–3446 CrossRef CAS.
- Z. Guo, W. Zhu, Y. Xiong and H. Tian, Macromolecules, 2009, 42, 1448–1453 CrossRef CAS.
- J. A. Schenk, F. Matyssek and B. Micheel, In Vivo, 2004, 18, 649–652 CAS.
- J. A. Schenk, J. Fettke, C. Lenz, K. Albers, F. Mallwitz, N. Gajovic-Eichelmann, E. Ehrentreich-Förster, E. Kusch and F. Sellrie, J. Biotechnol., 2012, 158, 34–35 CrossRef CAS PubMed.
- K. Daskalow, P. Boisguerin, B. Jandrig, R. Volkmer, B. Micheel and J. A. Schenk, Biosci. Biotechnol. Biochem., 2008, 72, 346–351 CrossRef CAS PubMed.
- S. Inal, J. D. Kölsch, L. Chiappisi, M. Kraft, A. Gutacker, D. Janietz, U. Scherf, M. Gradzielski, A. Laschewsky and D. Neher, Macromol. Chem. Phys., 2013, 214, 435–445 CrossRef CAS.
- M. Cigáň, J. Donovalová, V. Szöcs, J. Gašpar, K. Jakusová and A. Gáplovský, J. Phys. Chem. A, 2013, 117, 4870–4883 CrossRef PubMed.
- B. Wagner, Molecules, 2009, 14, 210–237 CrossRef CAS PubMed.
- B. Raju and T. S. Varadarajan, J. Phys. Chem., 1994, 98, 8903–8905 CrossRef.
- A. Nag and K. Bhattacharyya, Chem. Phys. Lett., 1990, 169, 12–16 CrossRef CAS.
- C. Tablet, I. Matei, E. Pincu, V. Meltzer and M. Hillebrand, J. Mol. Liq., 2012, 168, 47–53 CrossRef CAS.
- G. Ramakrishna and H. N. Ghosh, J. Phys. Chem. A, 2002, 106, 2545–2553 CrossRef CAS.
- J. Shepherd, P. Sarker, K. Swindells, I. Douglas, S. MacNeil, L. Swanson and S. Rimmer, J. Am. Chem. Soc., 2010, 132, 1736–1737 CrossRef CAS PubMed.
- J. Buller, A. Laschewsky, J.-F. Lutz and E. Wischerhoff, Polym. Chem., 2011, 2, 1486–1489 RSC.
- G. Pasparakis, A. Cockayne and C. Alexander, J. Am. Chem. Soc., 2007, 129, 11014–11015 CrossRef CAS PubMed.
- G. Pasparakis, M. Vamvakaki, N. Krasnogor and C. Alexander, Soft Matter, 2009, 5, 3839–3841 RSC.
- P. S. Stayton, T. Shimoboji, C. Long, A. Chilkoti, G. Ghen, J. M. Harris and A. S. Hoffman, Nature, 1995, 378, 472–474 CrossRef CAS PubMed.
- Z. Ding, C. J. Long, Y. Hayashi, E. V. Bulmus, A. S. Hoffman and P. S. Stayton, Bioconjugate Chem., 1999, 10, 395–400 CrossRef CAS PubMed.
- C. K. Chee, S. Rimmer, I. Soutar and L. Swanson, React. Funct. Polym., 2006, 66, 1–11 CrossRef CAS.
- J.-F. Lutz, O. Akdemir and A. Hoth, J. Am. Chem. Soc., 2006, 128, 13046–13047 CrossRef CAS PubMed.
- C. Zhong, T. Mu, L. Wang, E. Fu and J. Qin, Chem. Commun., 2009, 4091–4093 RSC.
Footnote |
| † Electronic supplementary information (ESI) available: Photophysical data of the monomer (2), temperature dependent absorbance and time-resolved PL spectra of P1, steady-state PL spectra of the monomer (2) at 20 and 50 °C, concentration dependent PL spectra of P1, decay curves of P1 in the presence of AB, evolution of absorbance, steady state and time resolved PL spectra of aqueous P1 solution upon heating and AB injection, evolution of absorbance and emission of the heated P1 solution upon monomer addition, decay curves of P2 below/above its LCST, ELISA tests on all polymers and the monomer at 4 °C, and the influence of AB on the turbidity profile of P2. See DOI: 10.1039/c3tb21245a |
| This journal is © The Royal Society of Chemistry 2013 |
