 Open Access Article
Dopant-induced 2D–3D transition in small Au-containing clusters: DFT-global optimisation of 8-atom Au–Ag nanoalloys†
Sven
Heiles
a,
Andrew J.
Logsdail
b,
Rolf
Schäfer
a and
Roy L.
Johnston
*b
aEduard-Zintl-Institut für Anorganische und Physikalische Chemie, Technische Universität Darmstadt, Petersenstrasse 20, 64287, Darmstadt, Germany
bSchool of Chemistry, University of Birmingham, Edgbaston, Birmingham, B15 2TT, UK. E-mail: r.l.johnston@bham.ac.uk
First published on 19th October 2011
Abstract
A genetic algorithm (GA) coupled with density functional theory (DFT) calculations is used to perform global optimisations for all compositions of 8-atom Au–Ag bimetallic clusters. The performance of this novel GA-DFT approach for bimetallic nanoparticles is tested for structures reported in the literature. New global minimum structures for various compositions are predicted and the 2D–3D transition is located. Results are explained with the aid of an analysis of the electronic density of states. The chemical ordering of the predicted lowest energy isomers are explained via a detailed analysis of the charge separation and mixing energies of the bimetallic clusters. Finally, dielectric properties are computed and the composition and dimensionality dependence of the electronic polarizability and dipole moment is discussed, enabling predictions to be made for future electric beam deflection experiments.
1 Introduction
The structural characterisation of clusters is not only of scientific interest but is also key in rationalising the size dependent properties of nanosized materials, in order to facilitate possible applications. Whilst recently it has become possible to study the structures of large clusters (with hundreds or thousands of atoms) by electron microscopy,1,2 geometric structures of small aggregates are only accessible by comparing experimental findings with theoretical predictions. In order to generate possible geometric isomers which can describe the experimental results, structures can be created by intuition,3–5 which becomes impossible for larger systems and will bias results. Another option is to use an algorithm which searches the available conformational space for the global minimum (GM).In the latter case, several methods exist, such as: the basin-hopping algorithm6; the stochastic-search method;7 and the genetic algorithm (GA).8,9 While all of these methods provide an unbiased search for the GM isomer, the question arises how the potential energy surface (PES) is described. For clusters with more than typically ∼30 atoms, or systems for which the bulk phase and small aggregates behave similarly, empirical potentials like Sutton-Chen,10 Murrell-Mottram11 or Gupta12 enable a reasonable description of the PES. After reoptimisation at the density functional theory (DFT) level13 it is possible to directly correlate the predicted ground state structure with experimental findings for free14 or supported2clusters.
Combined experimental and theoretical investigations have shown that the bonding situation for very small clusters is different from the bulk material and may also vary between two elements of the same group. For example, lead shows metallic behaviour even for small cluster sizes, and structures found with many-body potentials agree in many cases with DFT predictions.15,16 On the other hand, the structures for Sn can only be rationalised using isomers found by a GA, searching the DFT-PES.17 A similar situation is found for small Ag and Au clusters. For silver the GM structures for the Gupta-potential and DFT calculations agree in most cases,18 whereas it was shown experimentally and theoretically that the structures of small AuN clusters are two-dimensional.19 Hence electronic structure calculations are needed in order to predict the correct growing behavior for small clusters.
The situation becomes more complicated for so called nanoalloys,20clusters in which two or more metals are mixed in order to tune the properties of the particles not only by size but also by composition and chemical ordering, possibly resulting in beneficial synergistic effects. These materials may exhibit interesting optical21 or catalytic22 properties but locating the GM is complicated by the existence of a large number of homotops (inequivalent permutational isomers)20 for each geometric isomer. Recent advances in this research field have enabled the theoretical investigation of large bimetallic clusters with many-body potentials, searching for the GM using a GA, and yielding results which are consistent with experiment.23 On the other hand, a description of the bonding situation in smaller bimetallic clusters is only possible if electronic structure methods are used.
While for small mono-metallic species various attempts to search the GM on a DFT-PES can be found in the literature,17,24,25 similar investigations for bimetallic clusters are rare. Investigations on anionic, single doped Au–Cu, Au–Ag clusters24 and neutral Cu–Ag, Au–Ag and Pd–Ag26,27 with a basin-hopping algorithm have only recently been reported. However, developing reliable methods for finding GM for small bimetallic clusters, where discrete electronic effects are important, remains a challenge.
For this reason, we have combined the Birmingham Cluster Genetic Algorithm (BCGA)9 with the PWscf DFT code within the Quantum Espresso (QE) package,28 to enable the unbiased search for the GM of bimetallic clusters within the DFT framework. Here we present the first GM search for bimetallic clusters over the whole composition range using the GA-DFT approach. For the test system Au8−MAgM several new GM are presented and the competition between 2D and 3D isomers as a function of the composition is discussed. The energetics of these isomers are then analysed with respect to the influence of the dopant atoms and predictions of the dielectric properties are made for possible comparison with future electric beam deflection experiments.17,29–31 For examples of experiments and other electronic structure calculations on small Au–Ag clusters, the reader is referred to ref. 32–35.
2 Methodology
2.1 Global optimisation
The BCGA is a population based GA, which has been used to study mono- and bimetallic clusters in the size range between a few and several hundreds of atoms, as described previously.9 For a Lamarckian type evolution of generations, various empirical many-body potentials and minimisation schemes are already implemented. In order to account for the special bonding situation in small clusters the PWscf program,28 within the QE package, has been coupled with the BCGA code.The initial generation, consisting of ten clusters, is generated by randomly placing the atoms in a sphere with radius 1.1·N1/3·r0, where r0 is the bonding distance in the pure solid or the arithmetic mean of the different distances for bimetallic species and N the number of atoms. As schematically described in Fig. 1 the arrangement of atoms is transformed to the centre of mass coordinate system and placed in the centre of a cubic unit cell. Since PWscf is a plane-wave (PW) DFT code, the cluster is periodically repeated. To ensure that no self-interaction arises the unit cell size is chosen such that no duplicate clusters are closer than 16 Å. After DFT relaxation the convergence of the calculation is checked. In case any problems occur during the DFT calculation (e.g. non-convergence) a new random structure is generated (see Fig. 1). After all newly created population members have been energy minimised the energetically lowest population members are selected. In the next step the clusters are mated and mutated to create novel structures to form the next generation. This cycle is repeated until the energy of the lowest lying isomer changes by less than 1 mRy (∼13.605 meV) for a predefined number of generations (here ten generations).
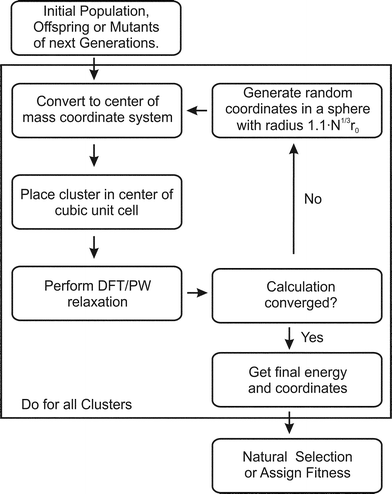 | ||
| Fig. 1 Flow chart for the GA-DFT approach. | ||
For the GA-DFT calculations 11-electrons for each atom are treated explicitly and the remaining 36 and 68 electrons for Ag and Au, respecively, are described by ultrasoft Rabe-Rappe-Kaxiras-Joannopoulos36,37 pseudopotentials, taking scalar-relativistic effects into account. For Au an additional nonlinear core-correction38 is used and the Perdew–Burke–Ernzerhof (PBE)39 exchange–correlation functional is employed within the generalised gradient approximation (GGA) framework. An energy cutoff (Ecut) of 40 Ry and a default density cutoff is used. The self consistent field (SCF) procedure was repeated until the energy change within the SCF cycle is less than 10−6Ry and force and energy convergence criteria of 10−3Ry/a0 (where a0 is the Bohr radius) and 10−4Ry are employed, respectively. Additionally, the Methfessel-Paxton smearing scheme is used (with a smearing parameter of 0.005) for all calculations. For the pure and singly doped systems mating and mutation rates of 0.8 and 0.1 are used. For mating, single-point weighted crossover is adopted, using the “cut-and-paste” phenotypic crossover operation introduced by Deaven and Ho.40 The mutations consist of 40% atom exchange moves and 60% generation of a new random structure. For multiply doped bimetallic clusters the mutation rate is increased to 0.2 and the atom exchange is increased to 50%, keeping all other computational parameters constant. Typically 8–12 new isomers are relaxed in each generation.
The GA-convergence of Ag8 and Au4Ag4 using the GA-DFT approach are depicted in Fig. 2. For the shown GM structures in Fig. 2 the structural motifs are similar for both compositions but the convergence towards the lowest lying isomer is qualitatively different. Whilst for Ag8 the “correct” structural motif is found after the 5th generation, the location of the high symmetry structure for the bimetallic cluster Au4Ag4 is complicated by the large number of permutational homotops, which is highlighted by the slow convergence (towards the lowest-energy isomer) of the highest-energy population member (inset in Fig. 2). These calculations, and those in Section 2.2, were performed on the University of Birmingham's BlueBEAR high performance computer.41
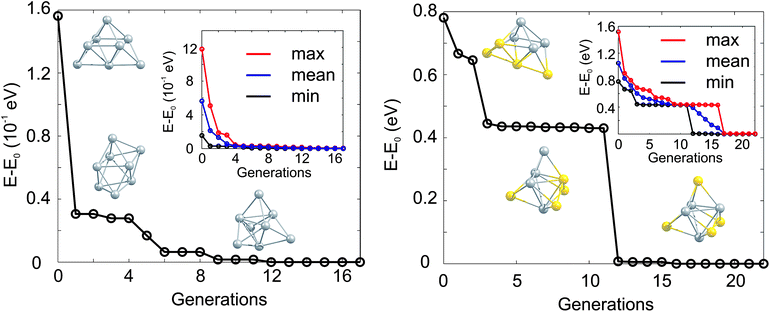 | ||
| Fig. 2 Evolution of the lowest isomer for Ag8 (left) and Au4Ag4 (right), relative to the energy of the GM isomer (E0). The lowest energy isomers for Ag8 (Au4Ag4) from the initial, the 1st and the 5th (the initial, the 3rd and the 12th) generation are shown. In the inset the change of the lowest (min, black), averaged (mean, blue) and highest (max, red) lying isomers with generation is highlighted. | ||
2.2 Post-processing
After the GA-DFT code has converged further refinement of the isomeric ordering is necessary. Therefore, all structures with an energy up to 0.5 eV above the GM are geometrically relaxed within PWscf using the PBE functional. The Ecut is increased to 50 Ry and the density cutoff is chosen as eight times Ecut. The energy and force convergence criteria are tightened to 10−5Ry and 10−4Ry/a0, respectively. The density of states (DOS) for each cluster was calculated using the QE package. Bader charges42 were computed using a 2403FFT grid (test calculations with up to 3503 points showed that the results changed by less than 1%).Following the refinement step, the three lowest lying isomers are geometry optimised (xfine integration grid, tight optimisation criterion) using NWChem v6.0,43 employing an effective core potential,44 an extensive 19-electron basis set45 and a the PBE functional, in order to calculate the harmonic vibrational frequencies, polarizabilities and dipole moments. In all the NWChem calculations low spin states were used since other states are found to lie significantly higher in energy.
3 Results and discussion
The GM isomers for the series Au8−MAgM, after reoptimisation with PWscf, are shown in Fig. 3. In general, the lowest isomer found by the GA-DFT is similar to those obtained after reoptimisation with PWscf or NWChem, with the exception of Au6Ag2 (described below). Higher lying isomers are presented in Figure S1 of the supplementary information.† For the pure clusters Au8 and Ag8 the results are consistent with previous findings: the 2D D4h symmetric GM isomer is well established for Au8,19,46 the GM for Ag8 is often reported as a 3D D2d symmetric structure.19 As shown in Fig. 2 (1st generation) and Figure S1† this structure is also found by the GA but the higher symmetry Td structure is lower in energy at this level of theory. This finding is consistent with the CCSD calculations of Bonačić-Koutecký and co-workers.47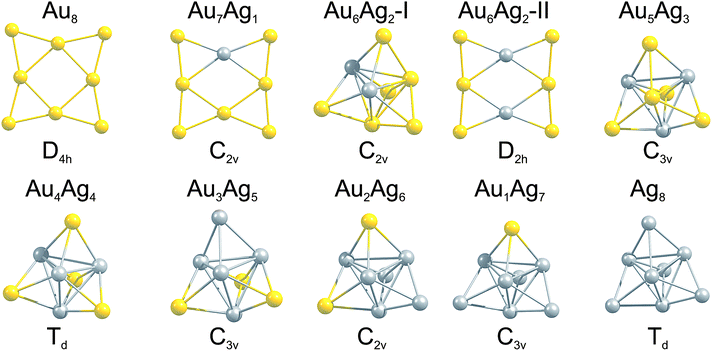 | ||
| Fig. 3 GM isomers for the 8-atom Au–Ag clusters, as a function of composition. Below each cluster the point group is given. For Au6Ag2 the two nearly degenerate isomers are shown. | ||
By introducing a single dopant atom into the cluster the overall structural motif is not changed in the gold and silver rich case, only slight distortions are apparent. For Au7Ag1 the predicted GM motif is identical to previous results reported in the literature for anionic clusters.24 The clusters discussed so far validate the use of the GA-DFT approach, whereas a remarkable result is obtained when a second gold atom is replaced by silver to give Au6Ag2. The GA-DFT run yielded two nearly degenerate isomers, one being 2D (isomer I) and the other 3D (isomer II), as shown in Fig. 3, with isomer I being the GM. Reoptimisation with PWscf yields an energy separation of ∼19 meV between the isomers, while the energetic ordering changes in the NWChem calculations, with isomer II ∼39 meV lower in energy. The same isomers have been reported by Zhao et al., who calculated the 2D structure to lie lower in energy.35 The small energetic separation between the isomers does not allow a clear identification of the GM since the accuracy of the methods used is smaller than the observed energetic separation and GGA functionals tend to overestimate the stability of 2D structures.48,49 Nevertheless, a dopant induced 2D-3D transition can clearly be identified between Au6Ag2 and Au5Ag3. For more than two silver atoms in the cluster, mainly 3D structures are found, all of them closely related to the pure Ag8 GM.
Analysis of the electronic DOS allows a qualitative explanation for the 2D-3D transition as shown in Fig. 4 (a) and (b). It has been speculated that the directional bonding in gold particles, arising from the relativistic s-d and d-d hybridisation,4,50 favours the 2D structures for small clusters. In order to get an idea of the observed 2D-3D transition, we analysed the three highest lying occupied molecular orbitals with respect to their s/d-character. In Fig. 4 (a) and (b) the partial DOS (pDOS) is shown for Au6Ag2-I and Au7Ag1, respectively. The highlighted part of the DOS for the 3D structure of Au6Ag2 contains considerable s-contribution compared to 2D Au7Ag1. Therefore, an increase of the d-character for the considered range of the DOS favours the appearance of 2D structures. In Fig. 4 (c) the d/s-contribution ratio is visualised for all compositions. Starting from Ag8 the three highest occupied orbitals consist mainly of s-character. Doping gold atoms into the cluster starts to increase the d-character nearly linearly until a sudden jump is observed for Au7Ag1. This simple picture does not explain the appearance of the 2D-3D transition between Au6Ag2 and Au5Ag3 but shows that a substantial d-contribution to the orbitals close to the highest occupied molecular orbital (HOMO) favours the occurrence of 2D structures even for bimetallic species.
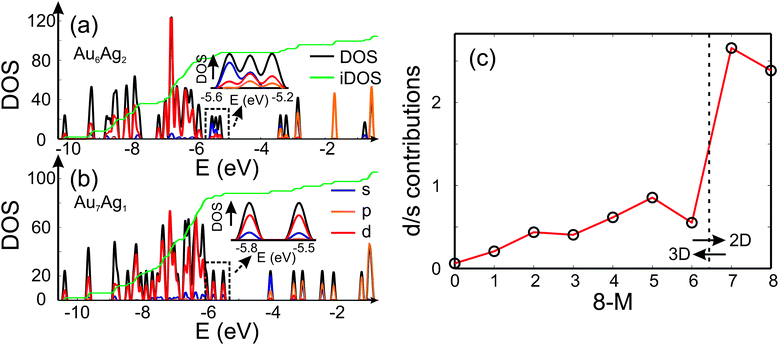 | ||
| Fig. 4 The DOS (black), partial DOS (pDOS) for the s-(blue), p-(orange) and d-contributions (red) for (a) Au6Ag2 and (b) Au7Ag1 calculated using the QE package. The dashed black lines highlight the part of the DOS which is analysed and the green line shows the integrated DOS (iDOS). The energy range close to the HOMO is magnified. (c) Ratio of d- and s-contributions to the three highest lying occupied molecular orbitals for the GM isomers as a function of the number of Au atoms 8 − M. | ||
In addition it is interesting to study the evolution of the energetic 2D-3D separation with composition. For Au6Ag2 both 2D and 3D structures are found by the GA-DFT that are energetically close, whilst the first 2D isomer for Au5Ag3 is ∼0.36 eV higher in energy than the GM. This energetic separation between the lowest lying 2D and 3D structures (E2D3D = E2D − E3D) is shown in Fig. 5 (a) (see Figure S2 in the supplementary information for the 2D isomers†). Starting from Au8 the 2D structure is favoured by ∼0.41 eV and E2D3D varies monotonically until 2D and 3D structures are nearly degenerate for Au6Ag2. Beyond that point the 3D structures become more favourable and E2D3D saturates at (0.6–0.8) eV for a higher silver content. Interestingly, a central silver tetrahedron is favoured for all 3D structures and gold atoms only replace the outer atoms, forming a core-shell structure. In particular Au4Ag4, for which all outer silver atoms are replaced by gold, shows an enhanced stability, as indicated by the relatively high HOMO–LUMO gap (Δε = E(LUMO)-E(HOMO), where LUMO is the abbreviation for lowest unoccupied molecular orbital) and the positive value of the second difference
| Δ2 = −2 E(8 − M,M) + E(8 − M − 1,M + 1) + E(8 − M + 1,M − 1) | (1) |
 | (2) |
 | (3) |
| Cluster | Δ2 (eV) | α/8 (Å3) | μ (D) |
|---|---|---|---|
| Ag8 | — | 6.069 | 0.000 |
| Au1Ag7 | −0.007 | 5.893 | 1.615 |
| Au2Ag6 | −0.004 | 5.713 | 1.896 |
| Au3Ag5 | 0.001 | 5.528 | 1.660 |
| Au4Ag4 | 0.502 | 5.342 | 0.000 |
| Au5Ag3 | −0.009 | 5.445 | 0.907 |
| Au6Ag2-I | — | 5.524 | 1.102 |
| Au6Ag2-II | −0.132 | 5.753 | 0.000 |
| Au7Ag1 | 0.013 | 5.869 | 0.193 |
| Au8 | — | 5.900 | 0.000 |
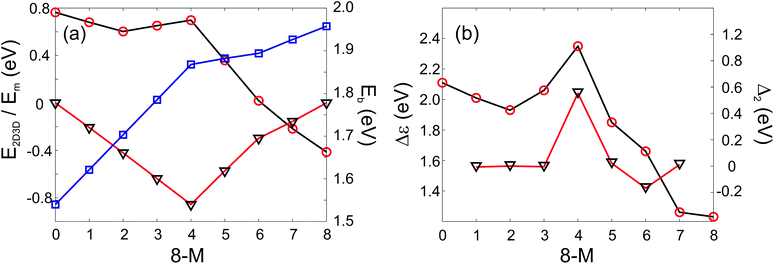 | ||
| Fig. 5 PWscf calculated energies: (a) Energy differences between 2D and 3D isomers (E2D3D, red circles), mixing energy (Em, black triangles) and binding energies (Eb, blue squares); (b) HOMO–LUMO gap (Δε, red circles) and second differences (Δ2, black triangles) as a function of the number of Au atoms. A positive value of E2D3D means that the 3D structure is more stable. | ||
As well as the energetic analysis presented above, the charge separation and dielectric properties of these Au–Ag nanoalloy clusters are of fundamental interest. The first to explain the favourable mixing in small clusters of these elements,3 and the second to inform possible future investigations with electric beam deflection experiments.29–31 In this study, Bader charge analysis was performed, and yielded results which are consistent with those reported in the literature.3,4 A significant charge transfer (of the order ±0.3 elementary charges, see Figure S3†) from silver to gold is observed. The charge transfer can be assigned to two influences: The minor effect is a negative charge accumulation on peripheral sites for all (even pure) clusters, as observed previously,52 whilst the major effect can be attributed to the higher electronegativity of gold compared to silver.53 Charge separation favours the formation of Au–Ag bonds, resulting in mixing of the elements; this conclusion is consistent with the observed mixing behaviour [Fig. 5 (a)].
The static polarizability per atom (α/8) and electric dipole moment (μ) can serve as probes for cluster structure when theoretical predictions are compared to experimental results from electric beam deflection experiments, one of the few methods enabling the investigations of small neutral clusters.29,30 In Table 1 the results for the Au8−MAgM clusters are presented. The calculated values for α/8 of Au8 is in good agreement with the predictions of Assadollahzadeh et al.46 using the B3PW91 functional (5.812 Å3). Zhao et al. computed a polarizability value per atom of 5.639 Å3 at the PW91P86/Lanl2DZ level of theory for Au6Ag2.35 Considering the fact that a valence only basis set without diffuse functions and a different exchange–correlation functional was used, the result is in acceptable agreement with the calculated value (5.753 Å3) reported here. On doping in Ag atoms, α/8 reduces until the smallest value is reached for Au4Ag4 and it then increases again up to Ag8. The inverse behaviour is observed for Δε, which is also inversely related to α/8.54 Therefore, Δε can be used to qualitatively explain the composition dependent behaviour of α/8. The dipole moments are quite large due to the charge transfer between Au and Ag, contrary to the pure clusters (Table 1). Therefore, the measurement of μ would enable the calculation of the charge distribution within the cluster, enabling experimental verification of the theoretically predicted charge separation; especially for Au6Ag2, the planar 2D and the 3D structures have clearly distinguishable dipole moments (see Table 1) and should be easily discriminated by experiment.
4 Conclusion
We have shown, using the example of 8-atom Au–Ag clusters of all compositions, the applicability of the GA-DFT approach to search for the GM of small bimetallic particles. A transition from two to three dimensional structures is predicted between Au6Ag2 and Au5Ag3. We investigated this transition by analysing the occupied orbitals close to the HOMO and deduced a strong influence of s-d and d-d hybridisation for the bimetallic nanoparticles. Furthermore, a general trend for gold to occupy peripheral sites is identified and rationalised in terms of significant charge transfer from Ag to Au, which also favours Ag–Au mixing and and explains the increased stability of the Td isomer of Au4Ag4. Electronic polarizabilities and electric dipole moments are also calculated, revealing a strong dependence of the dipole moment on the composition and dimensionality of the particles, which should facilitate the understanding of future electric beam deflection studies.In the future, the work presented here will be extended to larger Au–Ag nanoalloys and other bimetallic species where the dependence of structure and chemical ordering on the composition will be investigated. Predictions made on the basis of empirical many-body potentials will be critically tested at the DFT level of theory and against experimental results, where available.
Acknowledgements
S.H. and R.S. acknowledge financial support from the Deutsche Forschungsgemeinschaft through Grant No. SCHA 885/10-1. S.H. is grateful to Fonds der Chemischen Industrie for a scholarship. R.L.J. and A.J.L. acknowledge financial support from the EPSRC (UK) Grant EP/G070326/1 and COST Action MP0903: “Nanoalloys as Advanced materials: From Structure to Properties and Applications”. A.J.L. acknowledges financial support from the EPSRC, (DTA Award Reference: EP/P504678/1) and the University of Birmingham.References
- Z. Y. Li, N. P. Young, M. Di Vece, S. Palomba, R. E. Palmer, A. L. Bleloch, B. C. Curley, R. L. Johnston, J. Jiang and J. Yuan, Nature, 2008, 451, 46–48 CrossRef CAS.
- B. C. Curley, R. L. Johnston, N. P. Young, Z. Y. Li, M. Di Vece, R. E. Palmer and A. L. Bleloch, J. Phys. Chem. C, 2007, 111, 17846–17851 CAS.
- V. Bonačić-Kouteck, J. Burda, R. Mitrić, M. Ge, G. Zampella and P. Fantucci, J. Chem. Phys., 2002, 117, 3120–3131 CrossRef.
- H. M. Lee, M. Ge, B. R. Sahu, P. Tarakeshwar and K. S. Kim, J. Phys. Chem. B, 2003, 107, 9994–10005 CrossRef CAS.
- G. F. Zhao and Z. Zeng, J. Chem. Phys., 2006, 125, 014303 CrossRef CAS.
- D. J. Wales and J. P. K. Doye, J. Phys. Chem. A, 1997, 101, 5111–5116 CrossRef CAS.
- M. Saunders, J. Comput. Chem., 2004, 25, 621–626 CrossRef CAS.
- B. Hartke, J. Phys. Chem., 1993, 97, 9973–9976 CrossRef CAS.
- R. L. Johnston, Dalton Trans., 2003, 4193–4207 RSC.
- A. P. Sutton and J. Chen, Philos. Mag. Lett., 1990, 61, 139–146 CrossRef.
- J. N. Murrell and R. E. Mottram, Mol. Phys., 1990, 69, 571–585 CrossRef CAS.
- F. Cleri and V. Rosato, Phys. Rev. B: Condens. Matter, 1993, 48, 22 CrossRef CAS.
- R. Ferrando, A. Fortunelli and R. L. Johnston, Phys. Chem. Chem. Phys., 2008, 10, 640–649 RSC.
- O. Kostko, B. Huber, M. Moseler and B. von Issendorff, Phys. Rev. Lett., 2007, 98, 043401 CrossRef.
- C. Rajesh and C. Majumder, J. Chem. Phys., 2007, 126, 244704 CrossRef.
- S. K. Lai, P. J. Hsu, K. L. Wu, W. K. Liu and M. Iwamatsu, J. Chem. Phys., 2002, 117, 10715–10725 CrossRef CAS.
- S. Schäfer, B. Assadollahzadeh, M. Mehring, P. Schwerdtfeger and R. Schäfer, J. Phys. Chem. A, 2008, 112, 12312–12319 CrossRef.
- D. Alamanova, V. G. Grigoryan and M. Springborg, J. Phys. Chem. C, 2007, 111, 12577–12587 CAS.
- E. M. Fernández, J. M. Soler, I. L. Garźon and L. C. Balbás, Phys. Rev. B: Condens. Matter Mater. Phys., 2004, 70, 165403 CrossRef.
- R. Ferrando, J. Jellinek and R. L. Johnston, Chem. Rev., 2008, 108, 845–910 CrossRef CAS.
- W. Benten, N. Nilius, N. Ernst and H.-J. Freund, Phys. Rev. B: Condens. Matter Mater. Phys., 2005, 72, 045403 CrossRef.
- I. Nakamula, Y. Yamanoi, T. Imaoka, K. Yamamoto and H. Nishihara, Angew. Chem., Int. Ed., 2011, 50, 5830–5833 CrossRef CAS.
- D. T. Tran and R. L. Johnston, Proc. R. Soc. London, Ser. A, 2011, 467, 2004–2019 CrossRef CAS.
- W. Huang, R. Pal, L.-M. Wang, X. C. Zeng and L.-S. Wang, J. Chem. Phys., 2010, 132, 054305 CrossRef.
- E. Aprà, R. Ferrando and A. Fortunelli, Phys. Rev. B: Condens. Matter Mater. Phys., 2006, 73, 205414 CrossRef.
- G. Barcaro and A. Fortunelli, J. Phys. Chem. C, 2007, 111, 11384–11389 CAS.
- G. Barcaro and A. Fortunelli, Faraday Discuss., 2008, 138, 37–47 RSC.
- P. Giannozzi, S. Baroni, N. Bonini, M. Calandra, R. Car, C. Cavazzoni, D. Ceresoli, G. L. Chiarotti, M. Cococcioni, I. Dabo, A. Dal Corso, S. de Gironcoli, S. Fabris, G. Fratesi, R. Gebauer, U. Gerstmann, C. Gougoussis, A. Kokalj, M. Lazzeri, L. Martin-Samos, N. Marzari, F. Mauri, R. Mazzarello, S. Paolini, A. Pasquarello, L. Paulatto, C. Sbraccia, S. Scandolo, G. Sclauzero, A. P. Seitsonen, A. Smogunov, P. Umari and R. M. Wentzcovitch, J. Phys.: Condens. Matter, 2009, 21, 395502–395520 CrossRef.
- S. Schäfer and R. Schäfer, Phys. Rev. B: Condens. Matter Mater. Phys., 2008, 77, 205211 CrossRef.
- S. Heiles, S. Schäfer and R. Schäfer, J. Chem. Phys., 2011, 135, 034303 CrossRef CAS.
- J. Bowlan, A. Liang and W. A. de Heer, Phys. Rev. Lett., 2011, 106, 043401 CrossRef CAS.
- M. Neumaier, F. Weigend, O. Hampe and M. M. Kappes, Faraday Discuss., 2008, 138, 393–406 RSC.
- D. M. Popolan, M. Noessler, R. Mitric, T. M. Bernhardt and V. Bonacic-Koutecky, Phys. Chem. Chem. Phys., 2010, 12, 7865–7873 RSC.
- S. Zhao, Y. Ren, Y. Ren, J. Wang and W. Yin, J. Phys. Chem. A, 2010, 114, 4917–4923 CrossRef CAS.
- Y.-R. Zhao, X.-Y. Kuang, B.-B. Zheng, Y.-F. Li and S.-J. Wang, J. Phys. Chem. A, 2011, 115, 569–576 CrossRef CAS.
- A. M. Rappe, K. M. Rabe, E. Kaxiras and J. D. Joannopoulos, Phys. Rev. B: Condens. Matter, 1990, 41, 1227 CrossRef.
- D. Vanderbilt, Phys. Rev. B, 1985, 32, 8412 CrossRef CAS.
- S. G. Louie, S. Froyen and M. L. Cohen, Phys. Rev. B, 1982, 26, 1738 CrossRef CAS.
- J. P. Perdew, K. Burke and M. Ernzerhof, Phys. Rev. Lett., 1996, 77, 3865 CrossRef CAS.
- D. M. Deaven and K. M. Ho, Phys. Rev. Lett., 1995, 75, 288 CrossRef CAS.
- http://www.bear.bham.ac.uk/bluebear.
- W. Tang, E. Sanville and G. Henkelman, J. Phys.: Condens. Matter, 2009, 21, 084204 CrossRef CAS.
- M. Valiev, E. Bylaska, N. Govind, K. Kowalski, T. Straatsma, H. Van Dam, D. Wang, J. Nieplocha, E. Apra, T. Windus and W. de Jong, Comput. Phys. Commun., 2010, 181, 1477–1489 CrossRef CAS.
- D. Figgen, G. Rauhut, M. Dolg and H. Stoll, Chem. Phys., 2005, 311, 227–244 CrossRef CAS.
- K. A. Peterson and C. Puzzarini, Theor. Chem. Acc., 2005, 114, 283–296 CrossRef CAS.
- B. Assadollahzadeh and P. Schwerdtfeger, J. Chem. Phys., 2009, 131, 064306 CrossRef.
- V. Bonačić-Kouteck, V. Veyret and R. Mitrić, J. Chem. Phys., 2001, 115, 10450–10460 CrossRef.
- L. Ferrighi, B. Hammer and G. K. H. Madsen, J. Am. Chem. Soc., 2009, 131, 10605–10609 CrossRef CAS.
- M. Mantina, R. Valero and D. G. Truhlar, J. Chem. Phys., 2009, 131, 064706 CrossRef.
- H. Häkkinen, M. Moseler and U. Landman, Phys. Rev. Lett., 2002, 89, 033401 CrossRef.
- R. Ferrando, A. Fortunelli and G. Rossi, Phys. Rev. B: Condens. Matter Mater. Phys., 2005, 72, 085449 CrossRef.
- F. Chen and R. L. Johnston, Acta Mater., 2008, 56, 2374–2380 CrossRef CAS.
- L. O. Paz-Borbón, R. L. Johnston, G. Barcaro and A. Fortunelli, J. Chem. Phys., 2008, 128, 134517 CrossRef.
- K. Bonin and V. V. Kresin, Electric-Dipole Polarizabilities of Atoms, Molecules and Clusters, World Scientific, Singapore, 1997 Search PubMed.
Footnote |
| † Electronic supplementary information (ESI) available. See DOI: 10.1039/c1nr11053e |
| This journal is © The Royal Society of Chemistry 2012 |
