Biomarkers of food intake and metabolite differences between plasma and red blood cell matrices; a human metabolomic profile approach†
Abstract
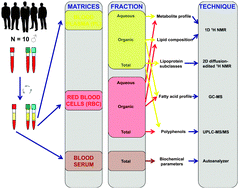
Untargeted metabolomic analyses of plasma and red blood cells (RBCs) can provide complementary information on biomarkers of food consumption. To assess blood collection differences in biomarkers, fasting blood was drawn from 10 healthy individuals using sodium citrate and lithium heparin as anticoagulants. Plasma and RBCs were separated into aqueous and lipid fractions to be analyzed using 1D and 2D 1H NMR spectroscopy. Fatty acids were analyzed using gas chromatography-mass spectrometry (GC-MS). Polyphenols were extracted from plasma and RBCs by micro-elution solid-phase extraction and analyzed by ultra performance liquid chromatography coupled to tandem mass spectrometry (UPLC-MS/MS). 1H NMR demonstrated higher aqueous metabolites such as glucose in plasma compared to RBCs, while RBCs contained higher ADP-ATP, creatine and acetone than plasma. Lipoproteins and their subclasses were higher in plasma than in RBCs. Percentages of saturated fatty acids (SFA) 16 : 0, 17 : 0, 20 : 0, 24 : 0 and polyunsaturated fatty acids (PUFA) 22 : 6 n-3 (docosahexaenoic acid) and 20 : 4 n-6 (arachidonic acid) were higher in RBCs than in plasma (p < 0.05), while SFA 14 : 0, monounsaturated fatty acids (MUFA) 14 : 1 n-5, 16 : 1 n-7, 17 : 1 n-7 and 18 : 1 n-9 and PUFA 18 : 3 n-3, 18 : 2 n-6, 18 : 3 n-6 and 20 : 3 n-6 were higher in plasma than in RBCs (p < 0.05). Polyphenols differed in plasma from those of RBCs. Biomarker concentrations were lower in sodium citrate compared to lithium heparin plasma. In conclusion, metabolomic profiles generated by NMR spectroscopy, GC-MS and UPLC-MS/MS analyses of RBCs versus plasma show complementary information on several specific molecular biomarkers that could be applied in nutritional assessment.


 Please wait while we load your content...