 Open Access Article
Creative Commons Attribution 3.0 Unported Licence
Future costs of power-to-liquid sustainable aviation fuels produced from hybrid solar PV-wind plants in Europe†
Kyle
Seymour
 *a,
Maximilian
Held
a,
Boris
Stolz
 b,
Gil
Georges
a and
Konstantinos
Boulouchos
a
aETH Zurich, Department of Mechanical and Process Engineering, Institute of Energy Technology, Leonhardstrasse 21, 8092 Zurich, Switzerland. E-mail: kwdseymour@gmail.com
bFederal Department of the Environment, Transport, Energy and Communications, Federal Office of Civil Aviation, Papiermühlestrasse 172, 3063 Ittigen, Switzerland
First published on 11th January 2024
Abstract
Sustainable Aviation Fuels (SAFs) produced from renewable electricity via Power-to-Liquids (PtL), also called e-jet fuel, can reduce net greenhouse gas emissions of aircraft by up to 90%, but they are markedly more expensive than fossil jet fuel. Their future production costs are particularly dependent on the cost of renewable electricity and, to date, not analysed with high geographical scope and resolution. This study assesses the future production costs of PtL-SAF produced via electrolysis and Fischer–Tropsch synthesis from hybrid solar PV-wind power plants and CO2 captured from ambient air. At 5390 locations across Europe, plant configurations have been optimised considering spatial and temporal restrictions on electricity generation. Thus, cost-optimal production regions are identified for 2030, 2040 and 2050. By 2030, PtL-SAF costs in Europe could already be as low as 1.21 EUR per litre (1510 EUR per tonne) and decrease to 0.71 EUR per litre (880 EUR per tonne) by 2050. If the blending mandate for renewable fuels of non-biological origin within the ReFuelEU Aviation regulation were to be supplied purely from PtL-SAF production regions within Europe, the average PtL-SAF cost would rank at 1.22 EUR per litre (1525 EUR per tonne) in 2030 – 3 times the historical market price of fossil jet fuel – and at 0.81 EUR per litre (1000 EUR per tonne) by 2050. Consequently, the impact on ticket prices would be less than 1% by 2030, 3% by 2040, and 7% by 2050.
1 Introduction
In November 2021, the 197 Parties to the United Nations Framework Convention on Climate Change (UNFCCC) recognised the need for “rapid, deep and sustained reductions in global greenhouse gas emissions, including reducing global carbon dioxide emissions by 45 per cent by 2030 relative to the 2010 level and to net zero around mid-century”1 to keep global warming below 1.5 °C. This urgency in decarbonising our economies also affects the hard-to-abate sector, aviation, which was responsible for 1.04 Gt of (tank-to-wake) CO2 emissions in 2018 – representing roughly 2.5% of global CO2 emissions2 – with expected demand growth rates of about 2–3% p.a. over the next decades.3–5 If climate change mitigation in the aviation sector continues to lag behind other sectors, international aviation's share of global CO2 emissions could rise to 22% by 2050.6In October 2021, the International Air Transport Association (IATA) increased its ambition from halving 2005 emission levels until 2050 to achieving net-zero carbon emissions by 2050.7 In October 2022, the International Civil Aviation Organisation (ICAO) followed this ambition and adopted a global long-term aspirational goal (LTAG) of net-zero carbon emissions for international aviation.8
Reports from the Mission Possible Partnership,5 the Air Transport Action Group,9,10 the International Transport Forum,11 and the European aviation sector's industry associations12 highlight potential pathways to net zero, including the amount of Sustainable Aviation Fuels (SAFs) required to achieve this goal. In all studies, SAFs – which can already be blended to fossil jet fuel up to 50% (ref. 13) today – represent the most important lever to curb aircraft CO2 emissions. There is also increasing evidence that SAFs can reduce aviation induced cloudiness14 – an effect that historically contributed about two thirds of the effective radiative forcing of aviation (whereas CO2 was only responsible for one third).15
SAFs can be produced from sustainable biomass, high-temperature solar heat or clean electricity.16–18 The limited availability of sustainable biomass warrants a focus on production pathways without such limits.8,19 The third pathway, Power-to-Liquid (PtL), produces e-jet fuel from electricity and CO2, e.g. via electrolysis and Fischer–Tropsch synthesis, and is more mature than the second. Compared with fossil jet fuel, PtL-SAF can reduce the specific greenhouse gas (GHG) emissions of aircraft by about 70–90%,20–22 but is more expensive to produce than fossil jet fuel.
Therefore, the United States provide tax credits for the supply of SAFs23 and the European Union introduced a blending mandate for SAFs to spur their production and use.24,25 The European blending mandate also includes a sub-mandate for the ramp-up of renewable fuels of non-biological origin, which include PtL.
With an increasing number of companies sending a demand signal to airlines and fuel producers by committing to use 10% SAFs by 2030,26 it is crucial to address barriers and risks that impede this growth in a timely manner.27 To increase investment security and thus tackling a pivotal risk, accurate and high-resolution estimates of future fuel production costs are required. This study provides an overview of existing studies for the production costs of PtL fuels and adds regionally resolved fuel cost estimates for production regions across Europe (the EU-27, the UK and the European Free Trade Association).
1.1 Literature review
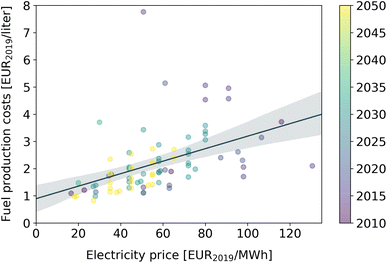
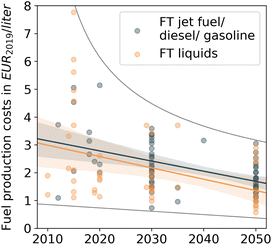
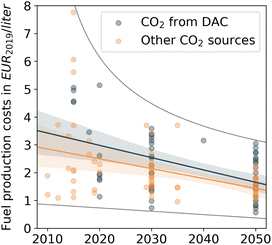
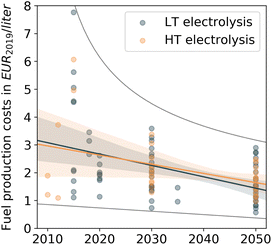
Fig. 1–4 show a literature review of PtL fuel production costs estimates since 2010, and projected costs until 2050.16,21,28–51 Fuel production costs as stated in the references are recalculated to EUR2019, based on individual publication years and using the annual Harmonized Indices of Consumer Prices (HICP52).‡.The cost of electricity is by far the biggest cost driver for PtL fuels, given the high electricity demand for electrolysis, see Fig. 1. Projected fuel production costs decrease over time, but the high spread in the results of individual studies does not support clear conclusions about the impact of individual components (see Fig. 2–4):
• Fuel product fractions: The FT synthesis yields a mixture of different fuel fractions according to the Schulz–Flory distribution and individual plant settings. The distillation of these FT liquids (syncrude) into individual fractions (kerosene, diesel, gasoline or naphtha) requires additional energy. However, the confidence intervals of the regression lines for syncrude and distilled fractions largely overlap.
• Source of CO2: Direct air capture of CO2 (DAC) requires more energy than capturing it from point sources, leading to higher fuel costs, but also here confidence intervals overlap. In Fig. 3, “other CO2 sources” include concentrated point sources like the post-combustion capture of CO2 from flue gases (e.g. of cement/coal power plants), the purchase of concentrated CO2, and other unspecified sources.
• Electrolysis type: High-temperature (HT) electrolysis, i.e. solid oxide electrolysis (SOEL), offers a higher efficiency potential than low-temperature (LT) electrolysis like alkaline or polymer electrolyte membrane electrolysis (AEL or PEMEL). While the comparison of individual studies on either LT or HT electrolysis does not reveal any marked differences, studies that analyse both LT and HT electrolysis variants indicate that LT electrolysis is currently less expensive, but could be outperformed by HT electrolysis from 2030 onwards.33,37,44,45,48
In general, there are a number of reasons for the high variation in existing PtL fuel cost estimations, the most important being different assumptions for the plant setup, its geographical location, the operation of the plants, as well as capital and operational expenditures (CAPEX and OPEX) of individual components. With many of these factors hard to predict due to the yet-to-be-scaled nature of individual components, this study provides a sensitivity analysis of which plant variables most influence the final costs of PtL fuel production.
1.2 Research gaps and contribution of this study
Most existing studies on PtL fuel costs generally focus on single fuel production plants and do not resolve for geographical differences, mostly because they consider the supply of electricity from the grid or excess renewable electricity.54 Three studies have analysed levelised costs of e-fuel production for multiple countries/regions, but do not provide a more granular resolution within country borders: A report published by the German Energy Agency at the end of 2020 optimises the cost for the global supply of various e-fuels between 2030 and 2050 with a resolution of 92 countries or regions.41 Moritz et al. (2023) provide high-level production costs of hydrogen and hydrogen-derived fuels for 113 countries.55 An industry report by Concawe published at the end of 2022 calculates the cost of supplying various e-fuels to Europe from four regions in Europe, Middle East and North Africa.56 Two other studies provide a more in-depth analysis of a few countries within Europe: Gonzalez-Garay et al. (2022) optimise the cost of PtL-SAF supply for Spanish aviation, based on solar energy.57 Ordóñez et al. (2022) calculate the cost of PtL-SAF supply for aviation in five European countries (DE, ES, FR, GB, IT).58We have identified a lack of scientific publications that combine the large regional coverage of some studies with the in-depth analysis of regional fuel production cost differences of others. In particular, there is no study that assesses the cost of PtL-SAF production for all European countries, investigating regional differences (within individual countries) together with cost projections until 2050 and considering intra-day and seasonal energy storage. This study aims to combine these aspects. It analyses stand-alone PtL-SAF production plants utilising solar PV and wind energy. It showcases the benefits of combining these renewable energy sources with high untapped potential. Other energy sources, such as hydropower, as well as electricity supply from the grid have not been assessed. The present work excels existing studies in the geographical and temporal resolution within Europe. We divide Europe into 3102 onshore and 2288 offshore evaluation locations for which we determine the cost-optimal fuel production plant design and operation, given local solar irradiation, wind power potential, and land availability for the production of electricity from these sources.
Doing so, this paper provides insights into how a transformation towards a carbon-neutral aviation sector in Europe can be shaped: First, locations with lowest PtL-SAF production costs are identified. Since PtL-SAF is currently at least 3× more expensive than fossil jet fuel, these lowest-cost regions should be selected in particular for the initial ramp-up of production capacities. Second, parameters with the highest influence on fuel costs are derived from a sensitivity analysis. Third, the additional costs of PtL-SAF compared with fossil jet fuel are discussed in the light of the EU blending mandate – and what effect the cost differential could have on ticket prices.
2 Methods
2.1 Plant design
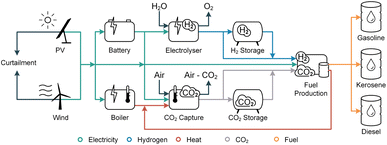
This section provides an overview of the modelled plant design, from its renewable electricity, water and air inputs to the final fuel product. Fig. 5 illustrates the plant setup.To ensure a maximum CO2 reduction of the produced fuels, electricity is supplied by standalone hybrid solar PV-wind plants, which have been identified as promising for the production of synfuels in previous studies.34,59 The majority of the produced electricity is consumed in the production of the fuel's initial constituents: hydrogen and CO2.
Hydrogen is produced via LT electrolysis – either AEL or PEMEL – due to its higher technology readiness level (TRL) than HT SOEL.60,61 LT electrolysers also have the advantage of not requiring co-located high-temperature process heat.
CO2 is captured from ambient air via low-temperature direct air capture.62–64 Required heat streams at 80–120 °C are recycled internally from process waste heat or produced via electric boilers. In the short-term, CO2 from fossil industrial point sources like coal power plants could lower the fuel production costs compared to PtL from DAC. However, CO2 should be supplied increasingly from air or biogenic point sources after 2030 (ref. 61 and 65) to achieve net-zero greenhouse gas emissions across the whole economy.
Hydrogen and CO2 are converted to syngas via a reverse water-gas shift reaction (RWGS).35 Syngas is converted to syncrude in a Fischer–Tropsch synthesis unit, and refined to individual fuel products (jet fuel, diesel, and gasoline) in a hydrocracker. This study excludes other PtL-SAF production pathways such as those via methanol. Since they are not yet certified, a lack of comprehensive process and plant data currently impedes a thorough analysis.66 The fuel synthesis design (including a reverse water-gas shift (RWGS) unit, Fischer–Tropsch (FT) synthesis and the refining of syncrude) is based on ref. 39 and 67.
Li-ion batteries as well as hydrogen and CO2 storage in steel tanks balance electricity generation fluctuations and ensure a steady hydrogen and CO2 stream to the Fischer–Tropsch synthesis unit.
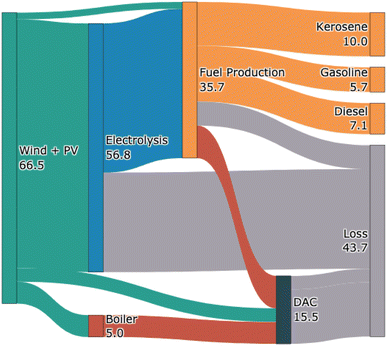
Capital and operational expenditures (CAPEX and OPEX), plant lifetimes and their efficiencies, i.e. their electricity and/or heat demand, of all plant components are summarised in Table 1. The Sankey diagram in Fig. 6 shows the resulting energy exchanges. The total plant efficiency from electricity to fuel amounts to 32–34% depending on battery storage utilisation – which is in line with a recent study by Grim et al. (2022).27
| Component | 2020 | 2030 | 2040 | 2050 | Unit | Reference | |
|---|---|---|---|---|---|---|---|
| CAPEX | Solar PV | 676 | 464 | 382 | 323 | EUR per kWp | 28, 78, 79 |
| Onshore wind (specific capacity of 0.2 kW m−2, hub height of 200 m) | 1760 | 1630 | 1569 | 1520 | EUR per kW | 79 | |
| Onshore wind (specific capacity of 0.3 kW m−2, hub height of 100 m) | 1290 | 1192 | 1147 | 1110 | EUR per kW | 79 | |
| Onshore wind (specific capacity of 0.47 kW m−2, hub height of 50 m) | 1040 | 958 | 921 | 890 | EUR per kW | 79 | |
| Offshore wind (monopile, up to 60 km from shore) | 2890 | 2447 | 2253 | 2100 | EUR per kW | 28, 79 | |
| Offshore wind (floating base, >60 km from shore) | 4540 | 3845 | 3539 | 3300 | EUR per kW | 28, 79 | |
| Electrolyser | 1084 | 621 | 462 | 358 | EUR per kWel | 16, 28, 80–85 | |
| Electrolyser stack replacement | 33% | 30% | 28% | 25% | % of electrolyser CAPEX | 81, 86 | |
| DAC | 730 | 382 | 269 | 199 | EUR per (tCO2 a) | 63 | |
| Fuel synthesis | 799 | 596 | 514 | 452 | EUR per kWch | 28, 80 | |
| Li-ion battery | 324 | 203 | 159 | 129 | EUR per kWhel | 78, 80, 87–89 | |
| H2 storage | 21 | 15 | 13 | 11 | EUR per kWhH2 | 88, 90–92 | |
| CO2 storage | 1500 | 1250 | 1000 | 750 | EUR per tCO2 | 93 | |
| Electrical boiler | 100 | 100 | 100 | 100 | EUR per kWel | 94 | |
| OPEX | Solar PV | 2.0% | 2.0% | 2.0% | 2.0% | % of CAPEX p.a. | 28, 78, 79 |
| Wind (onshore and offshore) | 2.5% | 2.5% | 2.5% | 2.5% | % of CAPEX p.a. | 28, 79 | |
| Electrolyser | 2.5% | 2.5% | 2.5% | 2.5% | % of CAPEX p.a. | 16, 28, 80–85 | |
| DAC | 4.0% | 4.0% | 4.0% | 4.0% | % of CAPEX p.a. | 63 | |
| Fuel synthesis | 2.5% | 2.5% | 2.5% | 2.5% | % of CAPEX p.a. | 28, 80 | |
| Li-ion battery | 2.5% | 2.5% | 2.5% | 2.5% | % of CAPEX p.a. | 78, 88 | |
| H2 storage | 1.0% | 1.0% | 1.0% | 1.0% | % of CAPEX p.a. | 88, 91, 92 | |
| CO2 storage | 2.5% | 2.5% | 2.5% | 2.5% | % of CAPEX p.a. | 83, 88, 93 | |
| Electrical boiler | 0% | 0% | 0% | 0% | % of CAPEX p.a. | 94 | |
| Lifetime | Solar PV | 30 | 30 | 30 | 30 | Years | 28, 78, 79 |
| Wind (onshore and offshore) | 30 | 30 | 30 | 30 | Years | 79 | |
| Electrolyser system | 30 | 30 | 30 | 30 | Years | 80, 84 | |
| Electrolyser stacks | 10 | 10 | 10 | 10 | Years | 81, 86 | |
| DAC | 12 | 15 | 17 | 20 | Years | 62 | |
| Fuel synthesis | 30 | 30 | 30 | 30 | Years | 80 | |
| Li-ion battery | 15 | 15 | 15 | 15 | Years | 78, 88, 89, 95 | |
| H2 storage | 30 | 30 | 30 | 30 | Years | — | |
| CO2 storage | 30 | 30 | 30 | 30 | Years | — | |
| Electrical boiler | 20 | 20 | 20 | 20 | Years | 94 | |
| Efficiency | Electrolyser | 60.0% | 63.3% | 66.7% | 70.0% | % (LHV basis) | 16, 28, 80, 81, 83–85 |
| DACthermal | 1.6 | 1.6 | 1.6 | 1.6 | kWhth per kgCO2 | 62 | |
| DACelectrical | 0.4 | 0.4 | 0.4 | 0.4 | kWhel per kgCO2 | 62 | |
| Fuel synthesis | 65.0% | 70.0% | 75.0% | 80.0% | % (LHV basis) | 28, 80 | |
| Li-ion battery (round-trip) | 92.5% | 92.5% | 92.5% | 92.5% | % | 95–98 | |
| H2 storage | 100% | 100% | 100% | 100% | % | — | |
| CO2 storage | 100% | 100% | 100% | 100% | % | — | |
| Electrical boiler | 100% | 100% | 100% | 100% | % | — |
2.2 Plant optimisation
The minimum technical cost of fuel production is derived by optimising plant component sizing and hourly operation for a modular plant setup of 10 GWh jet fuel output per annum, according to renewable energy resource availability. The objective of the optimisation is the minimisation of the net present value (NPV) of lifetime costs of the plant while fulfilling an annual jet fuel production of 10 GWh (815 tonnes). This plant size is characteristic of first-of-a-kind PtL-SAF plants, but future full-scale production plants are likely to be many times larger. This study does not resolve for potential economies of scale, meaning plant CAPEX and OPEX are assumed to scale linearly with plant production capacity.The plant design is optimised with the assumption of perfect foresight, meaning hourly energy and chemical storage dispatch decisions can be made with the benefit of knowledge of future electricity production over the course of a year.
The cost of fuel production using wind and solar PV-generated electricity for each of these cells is dictated by the prevalence and intermittency of the renewable energy resources. The differences of those inputs across Europe drive the geographic variability of fuel production costs. In order to study this variability, hourly wind speed and solar irradiance data were obtained for each of the evaluation cells within Europe for 2016, a year without any large resource anomalies.68,69
Wind speed data was retrieved from the Modern-Era Retrospective analysis for Research and Applications, Version 2 (MERRA-2) dataset produced by NASA's Global Modelling and Assimilation Office.70 Eastward and northward components of hourly average wind speed at heights of 10 meters and 50 meters were extracted for the year of 2016 at the MERRA-2 resolution of 0.5 by 0.625 degrees latitude and longitude, respectively. Wind speed data was converted to hourly power production using wind turbine power curves. At each cell, the optimal wind turbine model was selected in order to maximise full load hours (see ESI† for further information).
Solar irradiance data was obtained from the Photovoltaic Geographical Information System (PVGIS),71 a web application developed by the European Commission Joint Research Centre. The tool was used to simulate hourly power output of a solar PV installation per kW of installed capacity of optimally-tilted southward-facing fixed axis PV panels. A default PV system loss value of 14% was used as recommended by the tool. Solar PV power production for every hour of 2016 was queried at the centroid of each evaluation cell using this method.
With hourly per-unit electricity production from wind and solar PV generation as exogenous inputs, the optimiser selects plant component capacities and hourly energy and mass exchanges to meet a yearly jet fuel production target of precisely 10 GWh.
In addition to the energy and mass balances, a few component operation constraints are also necessary. The rate of charge and discharge of the battery is constrained by a characteristic C-rate of 0.5 (ref. 73) and the FT synthesis unit must operate with a minimum baseload of 80% of its rated capacity. The charge states of energy and mass storage components must be the same at the end of the year as they were at the beginning.
Optimised decision variables are (a) component capacities, and (b) energy and mass exchange through the plant for each hour of the year, i.e. the plant operation, taking into account component efficiencies and wind/PV electricity availability. The ESI† provides a mathematical description of the optimisation problem.
After the optimisation yields a cost-optimal modular plant design within each evaluation cell, the plant size (production capacity) is determined by the area required for solar PV and wind power and the availability of land (see previous section). The PV land use area requirement is assumed to be 8.3 acres per MWac, which includes all area enclosed by the site boundary.74 The spacing of wind turbines is assumed to be 10 meters per meter of rotor diameter.75,76
2.3 Economic assessment
 | (1) |
Annual fuel production, F, is discounted for year t using discount rate r = 5% (ref. 16 and 77), through the lifetime of the plant, L = 30 years. The net present value (NPV) of the plant, given in eqn (2), is the sum of the NPV of each plant component, k, given in eqn (3). The OPEX of each component for each year, i, of the plant's lifetime, L, is discounted using the NPV formula, eqn (4), which is used to derive the NPV of any expense or cash flow, R. The NPV of the CAPEX of each component is calculated for each component instalment, j, which occurs every l year, where l is the component lifetime. The number of component instalments, N, is limited by the lifetime of the overall plant. The last term of eqn (3) represents the resale value of the component at the end of the plant's lifetime.
 | (2) |
 | (3) |
 | (4) |
The plant costs are allocated across the product fractions based on energy content, meaning the LCOF (in EUR per kWh) is the same for all. For kerosene, the annual production, F, of the modular plant is 10 GWh by design.
Normalised to the initial costs in 2020, the projected experience rates of all technologies are depicted in Fig. 7.
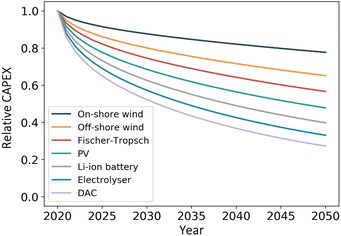 | ||
| Fig. 7 CAPEX of the individual components of a jet fuel production plant,16,28,62,63,78–85,87–89,99 normalised to their initial cost of 2020. PV and wind power costs in EUR per kWp, battery costs in EUR per kWh, electrolyser costs in EUR per kWel, Fischer–Tropsch synthesis plant costs in EUR per kWch, DAC costs in EUR per (tCO2 a). | ||
3 Results and discussion
3.1 Regional variation in PtL-SAF production costs
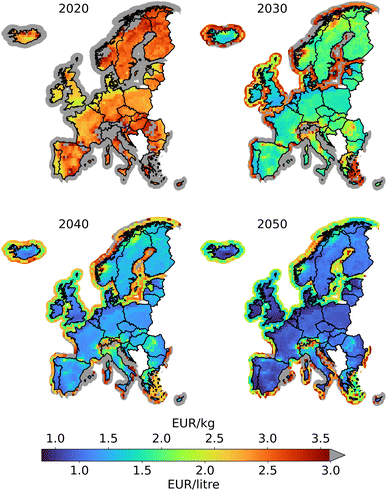
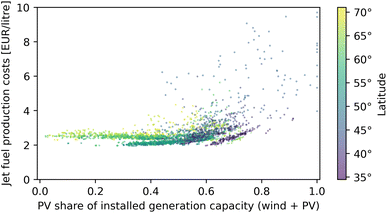
Fig. 8 shows the levelised cost of jet fuel production across Europe for 2020, 2030, 2040 and 2050. For visual simplicity, LCOF are presented in EUR per litre and EUR per kg only. The LCOF in EUR per MWh can be conveniently approximated from EUR per litre by multiplying by 100. By 2030, the lowest LCOF within Europe ranks at 1.21 EUR per litre (1500 EUR per tonne), by 2040 the LCOF goes down to 0.93 EUR per litre (1160 EUR per tonne), and by 2050 it lowers to 0.71 EUR per litre (890 EUR per tonne).Fig. 9 illustrates the location dependency of the levelised cost of jet fuel production. Coastal areas at the English Channel, the North Sea and the Baltic Sea (roughly between 50° and 55° latitude) represent low-cost production sites due to their favourable onshore wind potential. When taking transportation costs into account, production along the English Channel and North Sea would be supported by proximity to the Central European Pipeline System (CEPS), which consists of 5273 km of pipeline transporting jet fuel between storage depots, rail and truck loading stations, sea ports, and commercial airports in Belgium, France, Germany, Luxembourg, and The Netherlands. Another low-cost production area is located in the South-Western part of the Iberian peninsula (35–40° latitude) where high solar irradiation favours the hybrid solar PV-wind production of PtL-SAF, with solar PV comprising 60–70% of the total installed electricity generation capacity.
Future work should use these cost estimates in conjunction with transportation costs, which are driven by regional demand constraints, to optimise production facility siting as was done by e.g. Gonzalez-Garay et al. (2022).57 In contrast to these low-cost locations, the region of the Alps and coastal areas in the Mediterranean Sea show higher fuel production costs due to the limited wind potential in those places.
An example of the optimised hourly operation at a location in Poland is given in the ESI,† as is a series of maps indicating the storage capacities required to firm intermittent electricity generation. Overall, the combination of abundant wind power and solar PV enables high full load hours and therefore low-cost PtL-SAF production, whereas locations with a higher PV share compared to wind tend to show higher production costs (Fig. 9). Similarly, PtL-SAF production sites powered solely by offshore wind show comparatively higher fuel production costs because of the higher CAPEX requirements of wind turbines and larger battery storage required to balance intermittency.
3.2 Attribution of cost to plant components
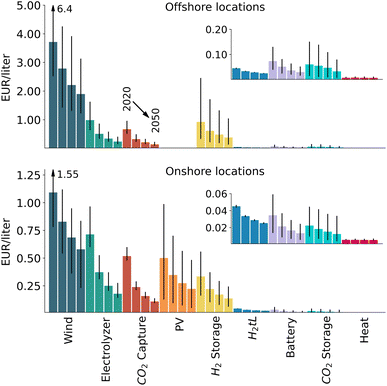
The relative sizes of component capacities are a function of the local wind and PV resources. Thus, the share of installation cost (NPV of CAPEX and OPEX) attributable to each plant component is not fixed. However, for both onshore and offshore locations, electricity generation components represent the largest share of installation costs on average (about 50–60%), followed by the electrolyser (about 15–20%). Fig. 10 details the levelised cost of each plant component. Component costs are given as the NPV of lifetime CAPEX and OPEX and levelised by the total plant lifetime fuel production. The black lines, depicting the 5–95% quantile range across all evaluation cells, indicate significant variation. Even in extreme cases, however, the cost of electricity production (wind and PV) in 2050 is likely to contribute at least 0.25 EUR per litre (or 55% of the total LCOF) for onshore locations and 1.00 EUR per litre (70%) in offshore locations. While technology learning curves drive cost reductions for all components from 2020 to 2050, the most prominent declines are expected for the electrolyser and CO2 capture. Component costs represented as the share of total LCOF are available in the ESI.†In this fuel production pathway, energy is buffered primarily in hydrogen storage tanks rather than in batteries. The geographic flexibility enabled by hydrogen pressure vessels comes at the expense of high cost of storage, but where geological storage options exist, this cost can be reduced by an order of magnitude or greater.90 Fuel synthesis, battery, CO2 storage, and process heat represent very small shares of the total fuel production costs and technological advancements in those areas are thus not expected to contribute to significant cost reductions.
3.3 PtL-SAF production costs under varying land availability
Land availability constrains available PtL-SAF production sites. We consider three land types to showcase how our methodological approach can be used to estimate the PtL-SAF production potential and the resulting PtL-SAF cost curves for individual areas (see Fig. 11).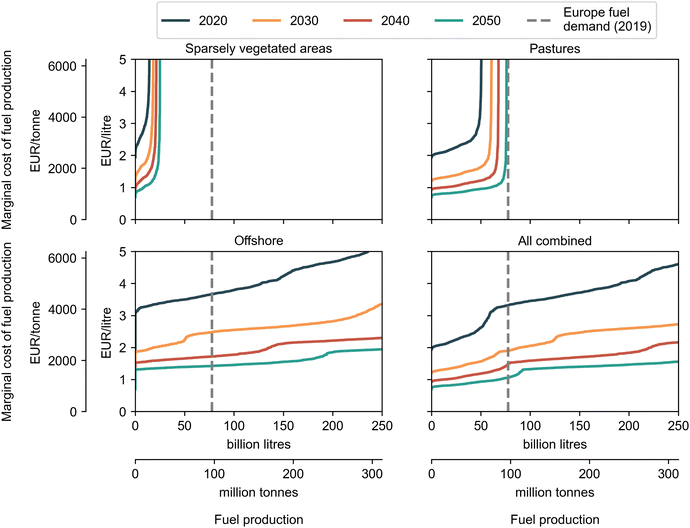 | ||
| Fig. 11 Potential PtL-SAF production volumes and marginal fuel production costs in Europe, constrained by land availability and sorted by ascending fuel production cost. | ||
This analysis is based upon the assumption that a mixture of sparsely vegetated areas, pastures and offshore areas can be made available for PtL-SAF production without inducing any significant harmful side effects (e.g., following the Do No Significant Harm taxonomy of the European Commission100).
• Sparsely vegetated areas: These are assumed to have few other use cases and a comparatively low risk of biodiversity loss.
• Pastures: The combined land use for agriculture and wind and/or solar PV parks (“agrivoltaics”) has already been proven feasible and could be enlarged.101
• Offshore area: We assume offshore wind turbines up to 100 km from the shore can be used to produce electricity that is used at inland PtL-SAF production sites close to the shore.
The land types described above will not be completely available for PtL-SAF production sites. Not all pasture areas will offer the potential of combined land use and not all offshore sites will be available for offshore wind parks due to water protection zones and frequent shipping lanes. In addition, a variety of other factors needs to be considered, including the potential loss of biodiversity when repurposing land for industrial use, the availability of water (for electrolysis), whether a land area currently functions as a carbon sink, and potentially preferable land uses, e.g. for reforestation. Based on such considerations, we have excluded other land types from this analysis where their land use for PtL-SAF production might be controversial. The selection of land types above is made to showcase the developed methodology but the ESI† provides access to a tool for investigating the impact of in-/excluding individual land cover types (from the full set of 44) in Europe from this kind of analysis. Whereas this study provides a first-order approximation on the production potential of PtL-SAF in Europe, further in-depth studies about regional and local land availability and PtL-SAF production costs should follow this paper.
Besides the fuel production costs per year, Fig. 11 also shows the jet fuel demand in Europe in 2019 from domestic and international aviation of 62 Mt (77 billion litres) as a vertical line.102
Neither sparsely vegetated areas nor pastures (at least in the short-term) are sufficient on their own to supply the full 2019 jet fuel demand of European states via PtL-SAF production at costs below 3 EUR per litre (3750 EUR per tonne). This is 7-8x the average historical fossil jet fuel market price of about 0.40 EUR per litre (500 EUR per tonne) – which, except for some short-term outliers, has been fluctuating between 0.2 and 0.6 EUR per litre between August 2013 and February 2022.103
However, SAFs will not only be supplied via PtL but also from sustainable biomass (such as agricultural or forestry residues) and all three land cover types combined suffice to meet the remaining share of PtL-SAF (see Section 3.5).
3.4 Country-specific cost curves
As shown in Fig. 8, PtL-SAF production costs show a high regional variation. For national contexts, country-specific cost curves (similar to the pan-European one in Fig. 11) will be essential to determine whether countries could produce PtL-SAF domestically at competitive costs, whether they should import PtL-SAF from other European countries, and whether they have the opportunity to become PtL-SAF exporters in the future. Such country-specific cost curves can be found in the ESI† for the same combination of land types as in Fig. 11.By 2030, France, Germany, Iceland, Ireland, Netherlands, Poland, and the United Kingdom are likely to be able to produce at least a billion litres of PtL-SAF fuel per annum each at costs lower than 1.5 EUR per litre (3.75× the historical average fossil jet fuel market price).
3.5 Potential impact of blending mandates
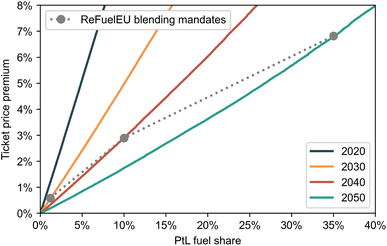
With the ReFuelEU Aviation regulation, the European Commission and the European Parliament have adopted a SAF blending mandate, including a sub-mandate for renewable fuels of non-biological origin of 1.2% by 2030, 10% by 2040, and 35% by 2050.24,104 Here, we analyse at what cost Europe could fulfil this mandate purely with domestic (i.e. intra-European) PtL-SAF production.While non-EU countries like the UK could adopt different blending mandates, we assume in this section that all European states will adopt such a mandate. We also assume that all renewable fuel volumes of non-biological origin will be PtL-SAF produced from the plant design discussed in this paper. We apply the provisional mandates onto the 2019 jet fuel demand and do not consider any changes in fuel demand (while the number of passengers is projected to increase at an annual growth rate of 2% within Europe, aircraft efficiency improvements, novel propulsion aircraft and other CO2 reduction measures could keep the jet fuel demand in Europe roughly at 2019 levels by 2050 (ref. 12)).
The cost of PtL-SAF is discussed in terms of LCOF and GHG abatement costs. GHG abatement costs are computed using the life-cycle GHG emission factor of fossil jet fuel (3.9 t CO2e per t fossil jet fuel105) and the expected GHG emissions reduction of PtL-SAF produced from hybrid solar PV-wind power plants of 87–88%.22
By 2030, the mandated fuel volumes could be produced at an average cost of about 1.22 EUR per litre (see Table 2). This translates to GHG abatement costs of about 300 EUR per tCO2e.
| Metric | 2030 | 2040 | 2050 | Unit |
|---|---|---|---|---|
| Blending mandate | 1.2 | 10 | 35 | % |
| Resulting PtL-SAF volume | 0.9 | 7.8 | 27.1 | Billion litres |
| PtL-SAF production costs | 1.22 | 0.97 | 0.81 | EUR per litre |
| GHG abatement costs | 300 | 210 | 150 | EUR per tCO2e |
| Abated GHG emissions | 2.5 | 21.3 | 74.5 | Million tCO2e |
By 2040 (2050), the mandated fuel volumes could be produced at an average cost of about 0.97 (0.81) EUR per litre, translating to GHG abatement costs of 210 (150) EUR per tCO2e. Lowest-cost sites could produce PtL-SAF at 0.93 and 0.71 EUR per litre in 2040 and 2050, respectively.
To quantify the impact of increased fuel prices on the end customer, we present a case study investigating the effect of blending mandates on ticket prices. Per year, the ticket price is compared to a reference case based on the cost of fossil jet fuel. It is assumed that the current share of fuel costs on total costs of ownership of an airline is 25% and non-fuel costs remain constant in future years.106 Additionally, by extrapolating the historical annual rate of 1.5% fuel efficiency improvements of airlines107 in future years, we incorporate a decreasing fuel consumption per seat-kilometre. The resulting ticket price premiums would be 0.6% by 2030, 3% by 2040, and 7% by 2050, see Fig. 12. A detailed derivation of the formula used to determine ticket price premiums is included in the ESI.†
To supply the provisional mandated fuel volumes within Europe, 8 GW each of solar PV and onshore wind power capacity would need to be installed by 2030 and 250 GW each in 2050, following the cost production curves in Fig. 11. This compares to 1053 GW globally installed solar PV capacity in 2022, and 899 GW globally installed (onshore and offshore) wind capacity in 2022 (ref. 108) – and projected capacity requirements of 26–35 TW solar PV and 14–16 TW wind power by 2050.109 No offshore locations are used due to the more favourable, balanced electricity supply for PtL-SAF production plants from hybrid solar PV-onshore wind power plants.
Additionally, a CO2 capture demand for PtL-SAF production of 210 Mt CO2 by 2050 compares to a projected global capacity demand for 7–10 Gt CO2 by 2050.110 An electrolyser capacity demand for PtL production of 205 GW compares to a projected global capacity demand for 7.8 TW by 2050.111
From the year 2000 to 2022, the global installed capacity of solar PV increased by three orders of magnitude.112 With this as reference for technology growth supported by cost declines and targeted policy action, an increase from an installed electrolysis capacity of 200 MW in 2020 to over 200 GW in 2050 is ambitious but not beyond the realm of the possible.111 With less than 0.1 Mt CO2 of installed DAC capacity globally in 2020, the challenge of meeting CO2 demand for PtL-SAF production is much larger.113 In reality, other SAF production CO2 pathways, including those utilising point-source CO2 will also be required to fulfil the mandated SAF volumes. In either case, significant policy support will be required to drive the ramp-up of PtL-SAF production.
In 2050, a blending mandate of 50% of the final jet fuel demand would create a market of 22 billion EUR, which is approximately three times the fuel expenditure of the Lufthansa Group in 2022.114
3.6 Sensitivity analysis
The sensitivity of the LCOF to model inputs was evaluated using a Monte Carlo method, in which 1000 randomly selected onshore cells were simulated with varied inputs. Since the uncertainty of LCOF model inputs, such as future component CAPEX and efficiencies, are inherently uncharacterisable, model sensitivity was explored using uniform variations across all inputs as a necessary simplification. Thus, input values were randomly sampled from Gaussian distributions centred around their respective 2020 baseline values and with a standard deviation of 20% (see Table 1). This provides a method to characterise the response of the modeled LCOF to each input individually without constraining the model to a specific choice of values for all other inputs.To characterise the sensitivity of LCOF to the model inputs, the inputs and outputs were transformed to a per-unit system. Each input was normalised by its baseline value (see Table 1). The output (LCOF) was normalised for each cell relative to the corresponding reference 2020 LCOF at each cell. The reference 2020 LCOF at each cell is that calculated with all baseline input values (as presented in Fig. 11). This per-unit transformation facilitates comparison of the relationships between modelled inputs and costs. Fig. 13 illustrates these relationships, derived via ordinary least squares regression, for the three inputs to which the model is most sensitive: chemical efficiency of fuel synthesis, electrolyser efficiency, and wind turbine CAPEX. Relative sensitivity is quantified by the slope and R2 values.
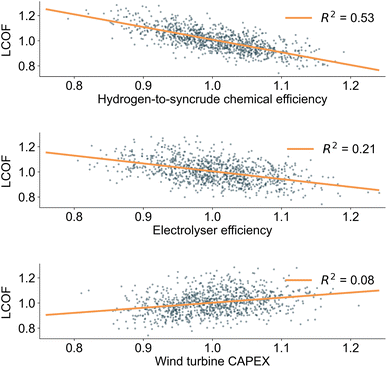 | ||
| Fig. 13 Sensitivity of LCOF to the three most sensitive plant parameters: hydrogen-to-syncrude chemical conversion efficiency (top), electrolyser efficiency (middle), and wind turbine CAPEX (bottom). | ||
The noisiness of the plots is a consequence of two factors. The first is the natural diversity of wind and solar resources across evaluation cells. The second is artificial randomness due to sampling from the input distributions. Because the input distributions are arbitrarily characterised by a standard deviation of 20%, so too is the magnitude of the noise and associated correlation coefficients, which should therefore only be used to compare the strength of correlation relative to other inputs. The regression parameters for the nine inputs found to be most determinant of LCOF are provided in Table 3. The remainder of model inputs listed in Table 1 were found to have statistically insignificant regression parameters (p-value of slope >0.005) and are not included in Table 3.
| Parameter | Variable name | Slope | Slope 95% C.I. | Intercept | Intercept 95% C.I. | R 2 × 100 |
|---|---|---|---|---|---|---|
| Fuel synthesis chemical efficiency | H2tL_chem_efficiency | −1.007 | [−1.07, −0.95] | 2.015 | [+1.96, +2.07] | 53.09 |
| Electrolyser efficiency | electrolyzer_efficiency | −0.622 | [−0.70, −0.55] | 1.627 | [+1.55, +1.70] | 21.35 |
| Wind CAPEX | wind_CAPEX | 0.403 | [+0.31, +0.49] | 0.599 | [+0.51, +0.69] | 7.54 |
| Discount rate | discount_rate | 0.359 | [+0.27, +0.44] | 0.644 | [+0.56, +0.73] | 6.67 |
| Fuel synthesis baseload | H2tL_baseload | 0.236 | [+0.15, +0.32] | 0.766 | [+0.68, +0.85] | 2.76 |
| Wind lifetime | wind_lifetime | −0.192 | [−0.28, −0.11] | 1.195 | [+1.11, +1.28] | 1.92 |
| Electrolyser CAPEX | electrolyzer_CAPEX | 0.181 | [+0.09, +0.27] | 0.822 | [+0.74, +0.91] | 1.69 |
| Solar PV CAPEX | PV_CAPEX | 0.162 | [+0.08, +0.25] | 0.841 | [+0.76, +0.92] | 1.44 |
| DAC CAPEX | CO2_CAPEX | 0.156 | [+0.07, +0.24] | 0.847 | [+0.76, +0.93] | 1.29 |
Notably, the inputs most associated with the cost of electricity (wind and PV CAPEX) and electricity consumption (electrolyser CAPEX and efficiency), were found to be some of the most important. This result supports findings of numerous other works identified in Section 1.1. Using the regression parameters in the table, it is possible to extrapolate fuel production costs under different assumptions of component CAPEX, efficiencies, etc. The results suggest, for example, that increasing the fuel synthesis chemical efficiency by 10% would reduce the LCOF by approximately 10%.
Furthermore, while future costs of DAC are highly uncertain, this analysis suggests LCOF costs are not as sensitive to the model input. Tripling the assumed DAC CAPEX from 730 to 2190 EUR per (tCO2 a) would increase the LCOF by only about 30%.
3.7 Limitations and future research
This section discusses (1) the techno-economic model uncertainties; (2) critical assumptions; and (3) limitations on scope in an effort to guide interpretation and application of the presented results. We also include recommendations for future research that can be done on the back of the methods developed in this paper.Model inputs are subject to uncertainties, especially when projecting into future years. For example, CAPEX cost reductions for renewable electricity generation have historically often been underestimated.115,116 Generally, differences in various plant component efficiencies, CAPEX, and OPEX would lead to different LCOF estimates. Therefore, a robust sensitivity analysis is included, in which the impact of these differences on LCOF are quantified. The results of the analysis, while mostly a characterisation of the model, also indicate which inputs should be more closely refined. While the sensitivity analysis was performed for model inputs clustered around 2020 assumptions, smaller Monte Carlo style simulations were run to test the model performance clustered around 2050 assumptions. The results, while not statistically significant due to the necessarily smaller sample size, indicate that the model responds to inputs similarly in this regime. To robustly extrapolate fuel production costs to different input assumptions in 2030, 2040, and 2050, the associated full-scale high sample size sensitivity analyses should be conducted in the future.
Hourly wind and solar resources from a single year were used to optimise plant operation and component sizing. The variable concurrence of wind and solar resources in another year may lead to different optimal component sizing and a future iteration of the model should add robustness to this effect. Additionally, geographic fuel production potential and the resulting cost curves are dependent on the quality of the CORINE land use dataset, which has a limited resolution and has not been updated since 2018. Inclusion of other land types as well as projections of future competing offshore and onshore development (e.g. renewable energy for other uses) would have an impact on the cost curve. A refined analysis of available areas (including e.g. offshore shipping lanes) and investigation of the sustainability implications of development are key tasks for future work. Offshore wind coupled with onshore or any floating PV was not included in this analysis, but should be included in future iterations as well.
Simplifying assumptions made in our model represent areas for further analysis. While CAPEX and OPEX scale linearly with capacity in our analysis, economies of scale are likely to reduce the LCOF in large-scale commercial plants. Additionally, the assumption of perfect foresight of wind and solar energy in our model leads to perfectly optimal dispatch of energy storage, whereas the implementation of an imperfect algorithm would likely necessitate extra capacity margin and higher costs.
The presented costs and geographic production potential apply only to the specific plant configuration which was studied – utilising solar PV and wind as the only energy sources and ambient air as the source of CO2. Application of results should thus be constrained accordingly. More work is needed to investigate how other likely sources of electricity and heat, such as hydro power, geothermal power, district heat, or grid-supplied renewable energy could impact LCOF and the broader related energy systems. For CO2, other sources – such as industrial point sources – should be considered. Similar analyses should also be performed for other technologies such as high-temperature electrolysis or methanol pathways instead of Fischer–Tropsch (see overview in ref. 117), which could lead to improvements of efficiency or specificity. With this, absolute LCOF values would decrease, but the relative deviations between different regions or years are expected to remain. Additional revenues from the sales of oxygen produced during electrolysis, and the effect of varying prices of other co-products such as diesel and gasoline is also outside the scope of this research.
Cost-optimal supply of SAF in the mid-21st century will undoubtedly necessitate a diversity of production pathways, including those from biogenic point-sources. This study should serve as a tool to enable robust comparison of PtL-SAF supply to others under primary energy and land availability constraints within Europe.
The core contribution of this study lies in the presented approach to quantify regional variability. The open-source and open-access nature of all inputs and code allows researchers to directly build upon the presented work. Underlying assumptions can be easily adapted and input data updated. This work provides an important step for a holistic future research on the role of PtL-SAF in the future, which should assess the trade-offs between GHG intensity, production costs, raw material availability and other socio-economic indicators.
4 Conclusions
This paper estimates future production costs of power-to-liquid sustainable aviation fuels for 5390 locations within Europe. We developed an optimisation method for assessing the levelised cost of PtL-SAF produced from hybrid solar PV-wind plants, under varying land availability constraints. The lowest fuel production costs are observed in areas of high full load hours of onshore wind power – e.g. coastal areas at the English Channel, the North Sea and the Baltic Sea – as well as for areas on the Iberian Peninsula with a high combined potential of solar PV and onshore wind power. They rank at 1.21 EUR per litre (3× the average historical fossil jet fuel price) in 2030, 0.93 EUR per litre (2.3×) in 2040, and 0.71 EUR per litre (1.8×) in 2050.Compared with biofuels, which today cost only about 2–3× of historical fossil jet fuel prices, PtL-SAF could overlap with these costs or become even cheaper in the 2030s. In the long-run (2050), we estimate PtL-SAF costs in Europe to be around at 0.8 EUR per litre. Only a limited amount of biofuels could be produced at similar cost ranges (at 0.7–1.1 EUR per litre), namely using hydroprocessed esters and fatty acids (HEFA) which rely on evidently limited feedstock.5 The production costs of other, non-HEFA biofuels are projected at 1.1–1.7 EUR per litre by 2050.5,8
This paper also analyses the impact of land availability for solar PV and wind power plants. Making sparsely vegetated areas, pastures and offshore locations available for PtL-SAF production, the provisional blending mandates for renewable fuels of non-biological origin from the European Commission and the European Parliament could be fulfilled by domestic PtL-SAF production within Europe at an average cost of 1.22 EUR per litre in 2030, 0.97 EUR per litre in 2040, and 0.81 EUR per litre in 2050. Ticket prices under such a scenario could go up by <1% by 2030, 3% by 2040, and 7% by 2050 due to the increased fuel costs compared with fossil jet fuel. The required renewable electricity generation capacity installations would be 8 GW each of solar PV and onshore wind by 2030. For 2050, these numbers increase to 250 GW each.
Author contributions
Kyle Seymour: conceptualisation, methodology, software, formal analysis, data curation, writing – review & editing, visualization. Maximilian Held: conceptualisation, methodology, investigation, writing – original draft, visualization. Boris Stolz: validation, investigation, writing – review & editing, visualization. Gil Georges: conceptualisation, supervision. Konstantinos Boulouchos: conceptualisation, supervision.Conflicts of interest
There are no conflicts of interest to declare.Acknowledgements
We would like to thank the Audi AG for the financial support to this work, Climeworks and Sunfire for their valuable feedback, Dr Christos Frouzakis for his computational support, and Saskia Adam for her methodological contributions. This research project is part of the Swiss Competence Center for Energy Research in Efficient Technologies and Systems for Mobility (SCCER mobility) of the Swiss Innovation Agency Innosuisse.References
-
UNFCCC, Decision-/CP.26 Glasgow Climate Pact, United Nations Framework Convention on Climate Change Technical Report, 2021 Search PubMed
.
- H. Ritchie, Climate Change and Flying: what Share of Global CO2 Emissions Come from Aviation? – Our World in Data, 2020, https://ourworldindata.org/co2-emissions-from-aviation Search PubMed.
- International Air Transport Association (IATA), 20 Year Passenger Forecast, 2021, https://www.iata.org/en/publications/store/20-year-passenger-forecast/#tab-3 Search PubMed.
-
IEA, Net Zero by 2050: A Roadmap for the Global Energy Sector, International energy agency technical report, 2021 Search PubMed
.
-
MPP, Making Net-Zero Aviation Possible: and Industry-Backed, 1.5 °C-Aligned Transition Strategy, Mission Possible Partnership Technical Report, 2022 Search PubMed
.
-
EU Directorate General for Internal Policies, Policy Department A: Economic and Scientific Policy, Emission Reduction Targets for International Aviation and Shipping, IP/A/ENVI/2015-11, Öko-institut technical report, 2015 Search PubMed
.
- International Air Transport Association (IATA), Resolution on the Industry's Commitment to Reach Net Zero Carbon Emissions by 2050, 2021, https://www.iata.org/contentassets/dcd25da635cd4c3697b5d0d8ae32e159/iata-agm-resolution-on-net-zero-carbon-emissions.pdf Search PubMed.
- International Civil Aviation Organization (ICAO), States Adopt Net-Zero 2050 Global Aspirational Goal for International Flight Operations, 2022, https://www.icao.int/Newsroom/Pages/States-adopts-netzero-2050-aspirational-goal-for-international-flight-operations.aspx Search PubMed.
-
ICF, Fueling Net Zero: How the Aviation Industry Can Deploy Sufficient Sustainable Aviation Fuel to Meet Climate Ambitions, an Icf Report for Atag Waypoint 2050 Technical Report, 2021 Search PubMed
.
-
ATAG, Waypoint 2050, Air Transport Action Group Technical Report, 2021 Search PubMed
.
-
International Transport Forum (ITF), Decarbonising Air Transport: Acting Now for the Future, OECD Publishing, Paris, 2021 Search PubMed
.
-
European Regions Airline Association (ERA), Civil Air Navigation Services Organisation (CANSO), European Regions Airline Association (ERA), Airports Council International-EUROPE (ACI) and Aerospace & Defence Industries Association of Europe (ASD), Destination 2050: A Route to Net Zero European Aviation, Nlr - royal netherlands aerospace centre, seo amsterdam economics technical report, 2021 Search PubMed
.
-
IATA, Fact Sheet 2 – Sustainable Aviation Fuel: Technical Certification, International air transport association technical report, 2020 Search PubMed
.
- C. Voigt, J. Kleine, D. Sauer, R. H. Moore, T. Bräuer, P. Le Clercq, S. Kaufmann, M. Scheibe, T. Jurkat-Witschas, M. Aigner, U. Bauder, Y. Boose, S. Borrmann, E. Crosbie, G. S. Diskin, J. DiGangi, V. Hahn, C. Heckl, F. Huber, J. B. Nowak, M. Rapp, B. Rauch, C. Robinson, T. Schripp, M. Shook, E. Winstead, L. Ziemba, H. Schlager and B. E. Anderson, Commun. Earth Environ., 2021, 2, 114 CrossRef
.
- D. Lee, D. Fahey, A. Skowron, M. Allen, U. Burkhardt, Q. Chen, S. Doherty, S. Freeman, P. Forster, J. Fuglestvedt, A. Gettelman, R. De León, L. Lim, M. Lund, R. Millar, B. Owen, J. Penner, G. Pitari, M. Prather, R. Sausen and L. Wilcox, Atmos. Environ., 2021, 244, 117834 CrossRef CAS PubMed
.
- S. Brynolf, M. Taljegard, M. Grahn and J. Hansson, Renewable Sustainable Energy Rev., 2018, 81, 1887–1905 CrossRef
.
- C. Falter, N. Scharfenberg and A. Habersetzer, Energies, 2020, 13, 802 CrossRef
.
- C. Falter, A. Valente, A. Habersetzer, D. Iribarren and J. Dufour, Sustainable Energy Fuels, 2020, 4, 3992–4002 RSC
.
- D. Oke, J. B. Dunn and T. R. Hawkins, Sustainable Energy Fuels, 2022, 6, 721–735 RSC
.
- C. M. Liu, N. K. Sandhu, S. T. McCoy and J. A. Bergerson, Sustainable Energy Fuels, 2020, 4, 3129–3142 RSC
.
- P. Schmidt, V. Batteiger, A. Roth, W. Weindorf and T. Raksha, Chem.-Ing.-Tech., 2018, 90, 127–140 Search PubMed
.
-
K. Treyer, R. Sacchi and C. Bauer, Life Cycle Assessment of Synthetic Hydrocarbons for Use as Jet Fuel: ”Power-To-Liquid” and ”Sun-To-Liquid” Processes, Paul scherrer institute (psi), commissioned by the swiss federal office of civil aviation (foca). technical report, 2022 Search PubMed
.
-
J. A. Leggett and J. L. Ramseur, Inflation Reduction Act of 2022 (IRA): Provisions Related to Climate Change, Congressional research service technical report, 2022 Search PubMed
.
- eFuel Alliance, Press Release: Good to Go: EU Agrees on Ramp-Up of Climate-Neutral Aviation Fuels, 2023, https://www.efuel-alliance.eu/fileadmin/Downloads/Pressemitteilungen_2023/20230426_PM_ReFuelEU_Aviation_EN_final.pdf Search PubMed.
- European Parliament, Amendments Adopted by the European Parliament on 7 July 2022 on the Proposal for a Regulation of the European Parliament and of the Council on Ensuring a Level Playing Field for Sustainable Air Transport (COM(2021)0561 – C9-0332/2021 – 2021/0205(COD))(1), 2022, https://www.europarl.europa.eu/doceo/document/TA-9-2022-<?pdb_no 0297?>0297<?pdb END?>_EN.html Search PubMed.
- World Economic Forum, Clean Skies for Tomorrow Leaders: 10% Sustainable Aviation Fuel by 2030, Press release, 22 Sep 2021, 2021, https://www.weforum.org/press/2021/09/clean-skies-for-tomorrow-leaders-commit-to-10-sustainable-aviation-fuel-by-2030/ Search PubMed.
- R. G. Grim, D. Ravikumar, E. C. D. Tan, Z. Huang, J. R. Ferrell, M. Resch, Z. Li, C. Mevawala, S. D. Phillips, L. Snowden-Swan, L. Tao and J. A. Schaidle, Energy Environ. Sci., 2022, 15, 4798–4812 RSC
.
-
A. Verkehrswende, A. Energiewende and Frontier Economics, The Future Cost of Electricity-Based Synthetic Fuels, Agora verkehrswende agora energiewende frontier economics technical report, 2018 Search PubMed
.
- F. G. Albrecht and T.-V. Nguyen, Energy, 2020, 192, 116511 CrossRef
.
- V. Becattini, P. Gabrielli and M. Mazzotti, Ind. Eng. Chem. Res., 2021, 60, 6848–6862 CrossRef CAS
.
- W. L. Becker, R. J. Braun, M. Penev and M. Melaina, Energy, 2012, 47, 99–115 Search PubMed
.
- R.-U. Dietrich, F. G. Albrecht, S. Maier, D. H. König, S. Estelmann, S. Adelung, Z. Bealu and A. Seitz, Biomass Bioenergy, 2018, 111, 165–173 CrossRef
.
- S. Drünert, U. Neuling, T. Zitscher and M. Kaltschmitt, Appl. Energy, 2020, 277, 115578 CrossRef
.
- M. Fasihi, D. Bogdanov and C. Breyer, Energy Procedia, 2016, 99, 243–268 CrossRef CAS
.
- Q. Fu, C. Mabilat, M. Zahid, A. Brisse and L. Gautier, Energy Environ. Sci., 2010, 3, 1382–1397 RSC
.
- C. Graves, S. D. Ebbesen, M. Mogensen and K. S. Lackner, Renewable Sustainable Energy Rev., 2011, 15, 1–23 CrossRef CAS
.
- L. E. Hombach, L. Doré, K. Heidgen, H. Maas, T. J. Wallington and G. Walther, J. Cleaner Prod., 2019, 207, 153–162 CrossRef CAS
.
-
N. Pavlenko, S. Searle and A. Christensen, The Cost of Supporting Alternative Jet Fuels in the European Union, The international council on clean transportation technical report, 2019 Search PubMed
.
- D. H. König, N. Baucks, R.-U. Dietrich and A. Wörner, Energy, 2015, 91, 833–841 Search PubMed
.
-
M. Ram, D. Bogdanov, A. Aghahosseini, A. Gulagi, S. A. Oyewo, M. Child, U. Caldera, K. Sadovskaia, J. Farfan, L. S. Barbosa, M. Fasihi, S. Khalili, D. Bernhard, G. Georg, T. Traber, F. De Caluwe, H.-J. Fell and C. Breyer, Global Energy System Based on 100% Renewable Energy, Lappeenranta university of technology and energy watch group technical report, 2019 Search PubMed
.
-
M. Ram, T. Galimova, D. Bogdanov, M. Fasihi, A. Gulagi, C. Breyer dena, M. Micheli and K. Crone, Powerfuels in a Renewable Energy World: Global Volumes, Costs, and Trading 2030 to 2050, Lut university and deutsche energie-agentur gmbh (dena) technical report, 2020 Search PubMed
.
- P. Runge, C. Sölch, J. Albert, P. Wasserscheid, G. Zöttl and V. Grimm, Appl. Energy, 2019, 233–234, 1078–1093 CrossRef
.
- S. Schemme, J. L. Breuer, M. Köller, S. Meschede, F. Walman, R. C. Samsun, R. Peters and D. Stolten, Int. J. Hydrogen Energy, 2020, 45, 5395–5414 Search PubMed
.
-
P. Schmidt, W. Zittel, W. Weindorf, T. Rakasha and D. Goericke, 16. Internationales Stuttgarter Symposium, Springer Fachmedien, Wiesbaden, 2016, pp. 185–199 Search PubMed
.
-
P. Schmidt and W. Weindorf, Power-to-Liquids: Potentials and Perspectives for the Future Supply of Renewable Aviation Fuel, German environment agency technical report, 2016 Search PubMed
.
- C. Schnuelle, J. Thoeming, T. Wassermann, P. Thier, A. von Gleich and S. Goessling-Reisemann, Energy Res. Soc. Sci., 2019, 51, 187–197 Search PubMed
.
- C. Schnuelle, K. Kisjes, T. Stuehrmann, P. Thier, I. Nikolic, A. von Gleich and S. Goessling-Reisemann, Energies, 2020, 13, 5522 CrossRef CAS
.
-
S. Siegemund, P. Schmidt, M. Trommler, O. Kolb, V. Zinnecker, W. Weindorf, W. Zittel, T. Raksha and J. Zerhusen, E-fuels Study: the Potential of Electricity-Based Fuels for Low-Emission Transport in the EU - an Expertise by LBST and Dena, Lbst, dena technical report, 2017 Search PubMed
.
- Q. Smejkal, U. Rodemerck, E. Wagner and M. Baerns, Chem. Ing. Tech., 2014, 86, 679–686 CrossRef CAS
.
- A. Tremel, P. Wasserscheid, M. Baldauf and T. Hammer, Int. J. Hydrogen Energy, 2015, 11457–11464 Search PubMed
.
- C. Zhang, R. Gao, K.-W. Jun, S. K. Kim, S.-M. Hwang, H.-G. Park and G. Guan, J. CO2 Util., 2019, 34, 293–302 Search PubMed
.
-
Eurostat, Harmonised Indices of Consumer Prices, HICP (2015 = 100) - Annual Data (Average Index and Rate of Change), 2020, https://ec.europa.eu/eurostat/databrowser/view/prc_hicp_aind/default/table?lang=en Search PubMed
.
- European Central Bank (ECB), ECB Euro Reference Exchange Rate, 2021, https://www.ecb.europa.eu/stats/policy_and_exchange_rates/euro_reference_exchange_rates/html/eurofxref-graph-usd.en.html Search PubMed.
- M. Millinger, P. Tafarte, M. Jordan, A. Hahn, K. Meisel and D. Thrän, Sustainable Energy Fuels, 2021, 5, 828–843 RSC
.
- M. Moritz, M. Schönfisch and S. Schulte, Int. J. Hydrogen Energy, 2023, 48, 9139–9154 CrossRef CAS
.
-
Concawe and Aramco, E-Fuels: A Technoeconomic Assessment of European Domestic Production and Imports towards 2050, Concawe technical report, 2022 Search PubMed
.
- A. Gonzalez-Garay, C. Heuberger-Austin, X. Fu, M. Klokkenburg, D. Zhang, A. van der Made and N. Shah, Energy Environ. Sci., 2022, 15, 3291–3309 RSC
.
- D. Freire Ordóñez, T. Halfdanarson, C. Ganzer, N. Shah, N. M. Dowell and G. Guillén-Gosálbez, Sustainable Energy Fuels, 2022, 6, 4749–4764 RSC
.
- C. Hank, S. Gelpke, A. Schnabl, R. J. White, J. Full, N. Wiebe, T. Smolinka, A. Schaadt, H.-M. Henning and C. Hebling, Sustainable Energy Fuels, 2018, 2, 1244–1261 RSC
.
- S. Schemme, R. C. Samsun, R. Peters and D. Stolten, Fuel, 2017, 205, 198–221 CrossRef CAS
.
-
European Commission, Proposal for a Regulation of the European Parliament and of the Council on Ensuring a Level Playing Field for Sustainable Air Transport (COM(2021) 561 Final), European commission technical report, 2021 Search PubMed
.
- C. Beuttler, L. Charles and J. Wurzbacher, Front. Clim., 2019, 1, 10 CrossRef
.
- M. Fasihi, O. Efimova and C. Breyer, J. Cleaner Prod., 2019, 224, 957–980 CrossRef CAS
.
- J. Young, N. McQueen, C. Charalambous, S. Foteinis, O. Hawrot, M. Ojeda, H. Pilorgé, J. Andresen, P. Psarras, P. Renforth, S. Garcia and M. v. d. Spek, One Earth, 2023, 6, 899–917 CrossRef
.
-
Global Alliance Powerfuels, Powerfuels Application Fields Factsheets about Powerfuels Technologies and Their Areas of Application, 2019 Search PubMed
.
-
ASTM, ASTM D7566-21: Standard Specification for Aviation Turbine Fuel Containing Synthesized Hydrocarbons, Astm technical report, 2022 Search PubMed
.
-
M. Prussi, M. Yugo, L. De Prada, M. Padella and R. Edwards, JEC Well-To-Wheels Report v5 (EUR 30284 EN), Publications Office of the European Union, Luxembourg, JRC121213 edn, 2020 Search PubMed
.
- A. Grochowicz, K. van Greevenbroek, F. E. Benth and M. Zeyringer, Energy Econ., 2023, 118, 106496 CrossRef
.
-
C. C. C. S. (C3S), European State of the Climate 2022, climate.copernicus.eu/ESOTC/2022, 2023 Search PubMed
.
-
Global Modeling and Assimilation Office (GMAO), MERRA-2 tavg1_2d_slv_Nx: 2d, 1-Hourly, Time-Averaged, Single-Level, Assimilation, Single-Level Diagnostics V5.12.4, 2015 Search PubMed
.
- T. Huld, R. Müller and A. Gambardella, Sol. Energy, 2012, 86, 1803–1815 CrossRef
.
- European Environment Agency (EEA) and Joint Research Centre (JRC), CORINE Land Cover - Copernicus Land Monitoring Service, 2020, https://land.copernicus.eu/pan-european/corine-land-cover Search PubMed.
- S. Saxena, Y. Xing, D. Kwon and M. Pecht, Int. J. Electr. Power Energy Syst., 2019, 107, 438–445 CrossRef
.
-
S. Ong, C. Campbell, P. Denholm, R. Margolis, and G. Heath, Land-Use Requirements for Solar Power Plants in the United States, Nrel/tp-6a20-56290 technical report, 2013 Search PubMed
.
- M. F. Howland, S. K. Lele and J. O. Dabiri, Proc. Natl. Acad. Sci. U. S. A., 2019, 116, 14495–14500 CrossRef CAS PubMed
.
- R. J. A. M. Stevens, B. F. Hobbs, A. Ramos and C. Meneveau, Wind Energy, 2017, 20, 465–477 CrossRef
.
- M. Lehtveer, S. Brynolf and M. Grahn, Environ. Sci. Technol., 2019, 53, 1690–1697 Search PubMed
.
- E. Vartiainen, G. Masson, C. Breyer, D. Moser and E. Román Medina, Prog. Photovoltaics, 2020, 28, 439–453 Search PubMed
.
-
I. Tsiropoulos, D. Tarvydas and A. Zucker, Cost Development of Low Carbon Energy Technologies, Jrc, european commission technical report, 2018 Search PubMed
.
-
IEA, IEA G20 Hydrogen Report: Assumptions, International energy agency technical report, 2019 Search PubMed
.
- G. Matute, J. M. Yusta and L. C. Correas, Int. J. Hydrogen Energy, 2019, 44, 17431–17442 CrossRef CAS
.
- H. Böhm, A. Zauner, D. C. Rosenfeld and R. Tichler, Appl. Energy, 2020, 264, 114780 CrossRef
.
- J. Gorre, F. Ortloff and C. van Leeuwen, Appl. Energy, 2019, 253, 113594 CrossRef CAS
.
- J. Michalski, U. Bünger, F. Crotogino, S. Donadei, G. S. Schneider, T. Pregger, K. K. Cao and D. Heide, Int. J. Hydrogen Energy, 2017, 42, 13427–13443 CrossRef CAS
.
- A. Buttler and H. Spliethoff, Renewable Sustainable Energy Rev., 2018, 82, 2440–2454 CrossRef CAS
.
-
IRENA, Hydrogen from Renewable Power: Technology Outlook for the Energy Transition, International Renewable Energy Agency, Abu Dhabi, 2018 Search PubMed
.
-
Batstorm, Battery Storage to Drive the Power System Transition, Batstorm technical report, 2018 Search PubMed
.
-
P. Runge, C. Sölch, J. Albert, P. Wasserscheid, G. Zöttl and V. Grimm, Economic Comparison of Electric Fuels Produced at Excellent Locations for Renewable Energies: A Scenario for 2035, Fau technical report, 2020 Search PubMed
.
-
W. Cole and A. W. Frazier, Cost Projections for Utility-Scale Battery Storage, National renewable energy laboratory technical report, 2019 Search PubMed
.
-
G. L. DNV, Hydrogen in the Electricity Value Chain, 2019 Search PubMed
.
- J. Gorre, F. Ruoss, H. Karjunen, J. Schaffert and T. Tynjälä, Appl. Energy, 2020, 257, 113967 CrossRef CAS
.
-
C. van Leeuwen and A. Zauner, Innovative Large-Scale Energy Storage Technologies and Power-To-Gas Concepts after Optimisation: Report on the Costs Involved with PtG Technologies and Their Potentials across the EU, Store &go technical report, 2018 Search PubMed
.
-
Element Energy, Shipping CO2 – UK Cost Estimation Study: Final Report for Business, Energy & Industrial Strategy Department, Element energy technical report, 2018 Search PubMed
.
-
E. Sperber, 2nd International Solar District Heating Conference, Hamburg, 2014 Search PubMed
.
- M. Beuse, B. Steffen and T. S. Schmidt, Joule, 2020, 4, 2162–2184 CrossRef CAS
.
- M. Schimpe, M. Naumann, N. Truong, H. C. Hesse, S. Santhanagopalan, A. Saxon and A. Jossen, Appl. Energy, 2018, 210, 211–229 CrossRef
.
- C. Peralta P., G. Vieira, S. Meunier, R. Vale, M. Salles and B. Carmo, Energies, 2019, 12, 375 CrossRef
.
-
K. Mongird, V. Fotedar, V. Viswanathan, V. Koritarov, P. Balducci, B. Hadjerioua and J. Alam, Energy Storage Technology and Cost Characterization Report, U.s. department of energy technical report, 2019 Search PubMed
.
- International Energy Agency (IEA), Capital Cost of Utility-Scale Battery Storage Systems in the New Policies Scenario, 2017-2040, 2019, https://www.iea.org/data-and-statistics/charts/capital-cost-of-utility-scale-battery-storage-systems-in-the-new-policies-scenario-2017-2040 Search PubMed.
-
European Commission, Do No Significant Harm’ Technical Guidance by the Commission (Recovery and Resilience Facility), European commission technical report, 2021 Search PubMed
.
- E. H. Adeh, S. P. Good, M. Calaf and C. W. Higgins, Sci. Rep., 2019, 9, 11442 CrossRef PubMed
.
- European Environment Agency (EEA), National Emissions Reported to the UNFCCC and to the EU Greenhouse Gas Monitoring Mechanism, 2022, https://www.eea.europa.eu/data-and-maps/data/national-emissions-reported-to-the-unfccc-and-to-the-eu-greenhouse-gas-monitoring-mechanism-17 Search PubMed.
- IATA, Fuel Price Monitor of the International Air Transport Association: Jet Fuel Price Developments, Aug 13 - Feb 22, 2022, https://www.iata.org/en/publications/economics/fuel-monitor/ Search PubMed.
-
Personal communications, Draft Text on Final ReFuel EU Aviation Blending Mandate, 2023 Search PubMed
.
-
CORSIA, Supporting Document: CORSIA Eligible Fuels-Life Cycle Assessment Methodology, Icao technical report, 2019 Search PubMed
.
- T. Wassermann, H. Muehlenbrock, P. Kenkel and E. Zondervan, Appl. Energy, 2022, 307, 117683 CrossRef CAS
.
-
B. Graver, U.S. Airlines on Track to Meet One Carbon Goal, Even without Government Leadership, International council on clean transportation technical report, 2018 Search PubMed
.
- H. Ritchie, Installed Solar/wind Energy Capacity, 2023, https://ourworldindata.org/grapher/installed-solar-pv-capacity Search PubMed.
- ETC, Making CleanElectrification Possible, 2023, https://www.energy-transitions.org/wp-content/uploads/2022/07/ETC-Global-Power-Report-Final.pdf Search PubMed.
- ETC, Carbon Capture, Utilisation & Storage in the Energy Transition, 2022, https://www.energy-transitions.org/wp-content/uploads/2022/08/ETC-CCUS_executive-summary_v1.7.pdf Search PubMed.
- ETC, Making the Hydrogen Economy Possible, 2021, https://www.energy-transitions.org/wp-content/uploads/2021/04/ETC-Global-Hydrogen-Executive-Summary.pdf Search PubMed.
- L. Kruitwagen, K. T. Story, J. Friedrich, L. Byers, S. Skillman and C. Hepburn, Nature, 2021, 598, 604–610 CrossRef CAS PubMed
.
- M. Ozkan, S. P. Nayak, A. D. Ruiz and W. Jiang, iScience, 2022, 25, 103990 CrossRef CAS PubMed
.
- L. Group, Lufthansa Group Annual Report 2022, 2022, https://investor-relations.lufthansagroup.com/fileadmin/downloads/en/financial-reports/annual-reports/LH-AR-2022-e.pdf Search PubMed.
- R. Way, M. C. Ives, P. Mealy and J. D. Farmer, Joule, 2022, 6, 2057–2082 CrossRef
.
- M. Xiao, T. Junne, J. Haas and M. Klein, Energy Strategy Rev., 2021, 35, 100636 CrossRef
.
- V. Dieterich, A. Buttler, A. Hanel, H. Spliethoff and S. Fendt, Energy Environ. Sci., 2020, 13, 3207–3252 RSC
.
Footnotes |
| † Electronic supplementary information (ESI) available. See DOI: https://doi.org/10.1039/d3se00978e |
| ‡ Studies published in 2020 and 2021 are not adjusted due to COVID-19 irregularities and due to the fact that the underlying data of these publications likely stems from pre-pandemic years. Values in other currencies are transformed to EUR values via historical currency exchange rates.53 |
| This journal is © The Royal Society of Chemistry 2024 |

