DOI:
10.1039/D4RA02430C
(Paper)
RSC Adv., 2024,
14, 12513-12527
Synergistic effects of β-NaFeO2 ferrite nanoparticles for photocatalytic degradation, antibacterial, and antioxidant applications†
Received
30th March 2024
, Accepted 12th April 2024
First published on 17th April 2024
Abstract
Here, synthesis and thorough characterization of β-NaFeO2 nanoparticles utilizing a co-precipitation technique is presented. XRD analysis confirmed a hexagonal-phase structure of β-NaFeO2. SEM revealed well-dispersed spherical nanoparticles with an average diameter of 45 nm. The FTIR spectrum analysis revealed weak adsorption bands at 1054 cm−1 suggested metal–metal bond stretching (Fe–Na). UV-Visible spectroscopy indicates a 4.4 eV optical band gap. Colloidal stability of β-NaFeO2 was evidenced via Zeta potential (−28.5 mV) and Dynamic Light Scattering (DLS) measurements. BET analysis reveals a substantial 343.27 m2 g−1 surface area with mesoporous characteristics. Antioxidant analysis indicates efficacy comparable to standard antioxidants, while concentration-dependent antibacterial effects suggest enhanced efficacy against Gram-positive bacteria, particularly Streptococcus. The Photocatalytic activity of β-NaFeO2 showed significant pollutant degradation (>90% efficiency), with increased degradation rates at higher nanoparticle concentrations, indicating potential for environmental remediation applications.
1 Introduction
Ever since the pioneering work of Fujishima and Honda in early 1970s,1 the use of TiO2 as a photocatalyst for water splitting under UV light irradiation, photocatalysis gained significant interest for e.g., wastewater treatment. Nowadays, photocatalysis is considered a promising approach to address environmental pollution. Generally, different methods exist for mitigating environmental pollution, including biological and chemical approaches. Biological approaches, e.g., bioremediation, i.e., to use microorganisms to degrade pollutants. However, they endure several challenges, such as the requirement of specific environmental conditions, longer remediation times, and potential sludge generation.2–6 Additionally, chemical methods, e.g., ozonation, chlorination, or simple application of chemicals to degrade pollutants are often used. However, these lead to the production of harmful by-products and can be economically and operationally inefficient. Thus, photocatalysis has emerged as a promising frontier in the restoration of environmental pollution due to its relatively high efficiency, low cost and minimal environmental impact.7–12
Besides the most studied material for photocatalysis, i.e., TiO2, ferrites gained significant attention in this field. For instance, ferrites are considered superior compared to pure metals as magnetic material due to their high electrical resistivity, low costs, facile preparation and enhanced magnetic properties.13 Ferrite nanoparticles have gained tremendous attention because of their extensive exploration in various applications in the fields of electronics and biomedics. Among the different ferrites, delafossites belong to the ferrites of alkali and/or alkaline earth metal with a chemical formula of AFeO2 (where A = alkali/alkaline earth metals).14 Several delafossite magnetic nanostructures have been reported, including LaSrMnO3, NaFeO2, NiFeO2, MnFeO2, CuAlO2, Fe2O3, YFeO3.15–19 Among alkali and alkaline ferrite compounds, sodium ferrite (NaFeO2) is receiving increasing attention, primarily due to its excellent orthorhombic crystal structure,20 which makes NaFeO2 an excellent candidate materials for various applications, such as lithium ion batteries,21 low magnetization ferrofluids,22 electrochromic displays,23 and wastewater treatment.24 The compounds of sodium ferrite have been found in two stable states, namely Na10Fe16O29 and NaFeO2. Sodium ferrate oxide (NaFeO2) exhibits distinct structural phases denoted as α, β, and γ, which are associated with different temperature ranges.25 The α phase predominates at lower temperatures and this phase demonstrates a rhombohedral crystal structure featuring a twofold symmetry with R3m space group number, while the β phase becomes prevalent at intermediate temperatures having space group Pn21a and orthorhombic structure, and the γ phase emerges at significantly elevated temperatures it assumes a tetragonal structure and is associated with the space group P41212.26 This study focuses on utilizing β-NaFeO2 as a catalyst due to its distinct structural phases and properties.
β-NaFeO2 is an advanced material with promising photocatalytic properties for environmental remediation. As a sodium iron oxide, β-NaFeO2 demonstrates exceptional photocatalytic activity under visible light against pollution, and its unique bandgap structure enables visible and ultraviolet (UV) light absorption, making photocatalysis possible across a wide spectrum.27 Solar-to-initiate redox reactions, in which organic pollutants such as methyl red (MR) are degraded, provides a sustainable and low-cost approach to water treatment that can be powerful against some of the challenges presented by MR and other organic dyes. As such, there is a great need to optimize β-NaFeO2 properties through tailored composition, morphology, and surface modifications in order to improve pollutant degradation. There is also a critical need to mechanistically, kinetically, and pathwise understand the decomposition of MR in order to understand how best to design these complex photocatalytic processes.
Furthermore, we conducted a comprehensive assessment of the antioxidant and antibacterial properties of β-NaFeO2 nanoparticles, against three different bacteria's including Escherichia coli (E. coli), Staphylococcus aureus (S. aureus), and Pseudomonas aeruginosa (P. aeruginosa). These bacterial strains were selected because they play important roles as the causal agents of a variety of human illnesses, including respiratory tract, wound, and urinary tract infections. We used the MTT (3-(4,5-dimethylthiazol-2-yl)-2,5-diphenyltetrazolium bromide) assay to determine the antibacterial activity of β-NaFeO2 nanoparticles and assess their capacity to impede the growth of these harmful bacteria. Additionally, we conducted antioxidant activity assays to assess the capacity of β-NaFeO2 nanoparticles to neutralize free radicals, comparing their performance against well-established antioxidants such as vitamin C and vitamin E. By systematically analyzing both the antioxidant and antibacterial properties of β-NaFeO2 nanoparticles, our study aims to provide valuable insights into their safety profile and therapeutic potential in combating bacterial infections and mitigating oxidative stress-related diseases.28
2 Experimental procedure
2.1 Materials
All chemical used for synthesis of β-NaFeO2 nanoparticles meet with analytical grade requirements. Sodium nitrate (NaNO3; purity 99%) was procured from Sigma Aldrich, while iron(III) nitrate (Fe(NO3)3·9H2O; purity 98%) and sodium hydroxide (NaOH; purity 95%) were obtained from the Chemistry Lab at Islamia University of Bahawalpur. Hydrochloric acid (HCl; purity 97%) was purchased from Chemical Solutions, Pakistan, and distilled or de-ionized water was sourced from Fiji.
2.2 Synthesis of β-NaFeO2 nanoparticles
The synthesis of β-NaFeO2 nanoparticles was conducted via the co-precipitation method. Initially, separate solutions of iron nitrate (Fe(NO3)3·9H2O) and sodium nitrate (NaNO3) were prepared by dissolving 1 M of iron nitrate and 0.5 M of sodium nitrate in 20 mL of distilled water, respectively. Afterwards, the sodium nitrate solution was heated on a hot plate at 80 °C and simultaneously stirred for 30 minutes. Subsequently, the iron nitrate solution was added drop-wise to the sodium nitrate solution with continuous stirring for 30 minutes to ensure thorough mixing and dissolution. Control over the pH was maintained by the 5 mL gradual addition of sodium hydroxide (NaOH) to reach and sustain a pH of 12, crucial for the co-precipitation reaction to stabilize the solvents. This stabilization contributes to the enhancement of nanoparticle properties and serves as a preventive measure against their coagulation when incorporated into a nanofluid.29 The resulting mixture was subsequently heated to 80 °C and kept at this temperature for 3 hours to facilitate the co-precipitation process. The solution gradually turned brown as the nanoparticles formed. After the reaction period, the solution was allowed to cool for 1 hour at room temperature. Subsequently, the precipitate containing the β-NaFeO2 nanoparticles was separated from the solution via centrifugation at 6000 rpm for 30 minutes, followed by decanting of the supernatant. The obtained precipitate was then dried overnight in an oven set to 110 °C to remove any remaining moisture. Finally, the dried powder sample was allowed to cool down to room temperature before further characterization or analysis. Schematic diagram of step-by-step synthesis of β-NaFeO2 is shown is Fig. 1.| | |
NaNO3 + Fe(NO3)3·9H2O + NaOH → β − NaFeO2 + NaNO3 + H2O
| (1) |
 |
| | Fig. 1 The schematic illustration of laboratory procedure for synthesizing β-NaFeO2 ferrite nanoparticles via co-precipitation method. | |
2.3 Characterization
X-ray Diffraction (XRD) analysis was conducted using the Phillips PW 1050 Bragg–Brentano diffractometer and Mn filtered Cu-Kα radiations to elucidate the crystal structure. Scanning Electron Microscopy (SEM) and Energy-Dispersive X-ray Spectroscopy (EDS) were performed with the NOVA NANOSEM 430 FESEM to investigate the morphology and elemental composition. Fourier Transform Infrared Spectroscopy (FTIR) was carried out using the PerkinElmer Premium HATR Flat Top Plate – ZnSe, 45° configuration, providing insights into chemical bonding. Thermogravimetric Analysis (TGA) was executed on the Mettler Toledo AG – TGA/SDTA85le instrument in a low-frequency mode up to 1600 °C, offering thermal stability information. Ultraviolet-Visible Spectroscopy (UV) measurements using the Research Model UVD-3400/UVD-3500 revealed optical properties. The Vibrating Sample Magnetometry (VSM) measurements, conducted with the Cryogenic VSM-MAG-2022-I instrument, offered magnetic property insights. Furthermore, Zeta Potential was determined using the Malvern Zetasizer Nano ZSP. Additionally, the research explores the BET analysis for surface area determination, using nitrogen adsorption/desorption and Quantachrome Nova 2200e instrument.
2.4 Photocatalytic degradation efficiency
The investigation aimed to evaluate the photocatalytic activity of β-NaFeO2 nanoparticles against methyl red dye. Initially, a solution containing 20 ppm methyl red dye was prepared, and β-NaFeO2 nanoparticles were added as the photocatalyst. The mixture was kept in the dark for 30 min after proper dispersion to stablish adsorption/desorption equilibrium. Subsequently, light irradiation with a wavelength range from 100 nm to 700 nm was applied for a specified period. Samples were withdrawn at regular intervals for analysis using UV-Visible spectroscopy to assess the degradation efficiency,30,31 calculated as| |
 | (2) |
Here C0 represents the initial absorbance of the dye solution, and Ct denotes the absorbance of the dye solution at a specified time (t). The investigation will explore the impact of various parameters on the photocatalytic degradation process, including initial dye concentrations (10 to 70 ppm), temperatures (20 °C to 50 °C), pH levels (1 to 14), exposure times (10 to 70 minutes), and photocatalyst dosages.
2.5 Antibacterial activity
The antibacterial efficacy of synthesized β-NaFeO2 nanoparticles was evaluated against three distinct bacterial groups: Klebsiella, E. coli, and Streptococcus. For the experiment, bacterial suspensions were meticulously prepared using a 0.79% saline solution. Bacterial suspensions were evenly spread on nutrient agar media within Petri plates to form a dense bacterial lawn. Nutrient agar media served as the cultivation medium for these bacterial strains. Various volumes (10, 15, 20, and 25 μg mL−1) of β-NaFeO2 nanoparticles, with a concentration ratio of 1![[thin space (1/6-em)]](https://www.rsc.org/images/entities/char_2009.gif) :3, were introduced into the central region of each well. Distilled water served as the control. Following inoculation, the plates underwent a 24 hours incubation period at 35 °C. After this duration, the inhibition zone, indicative of antibacterial effectiveness, was measured using a scale in millimeters or Vernier caliper as shown in Fig. 2.
:3, were introduced into the central region of each well. Distilled water served as the control. Following inoculation, the plates underwent a 24 hours incubation period at 35 °C. After this duration, the inhibition zone, indicative of antibacterial effectiveness, was measured using a scale in millimeters or Vernier caliper as shown in Fig. 2.
 |
| | Fig. 2 Steps involved in culturing bacteria on a Petri dish containing agar for assessing the antibacterial activity of β-NaFeO2. | |
2.6 Antioxidant activity
The antioxidant activity of β-NaFeO2 was evaluated using the DPPH (2,2-diphenyl-1-picrylhydrazyl) assay. The β-NaFeO2 were tested against DPPH at 20, 40, 60, 80 and 100 mg mL−1 concentrations; ascorbic acid was used as control. The DPPH solution (1.5 mL) was added to test sample (1.5 mL) of all test tubes, vortex mixed and incubated at room temperature for 40 minutes. The color change from violet to yellow indicated the antioxidant potential. The blank was prepared using methanol (1.5 mL) and DPPH solution (1.5 mL) and their optical density against the colloidal mixture of a sample was measured at 512 nm. The percentage scavenging activity of DPPH was calculated according to the following equation:32| |
 | (3) |
where AC is absorbance of control and AS is the absorbance in the presence of the samples.
3 Result and discussion
3.1 Structure and morphology of β-NaFeO2
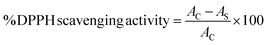
The crystallinity of β-NaFeO2 was assessed using X-ray diffraction (XRD) analysis, as depicted in Fig. 3(a). The diffractions were plotted within the 2θ angle range of 10° to 80° and matched with their corresponding Miller indices, including (011), (102), (112), (201), (022), (123), (312), (015), (412), and (413), respectively. The presence of a diffraction at approx. 33.5° confirmed the formation of the hexagonal phase, signifying the orthorhombic structure of β-NaFeO2. These diffractions correlate with the JCPDS data card number 01-076-0245, with a space group denoted as Pna21 (Space group number: 33).33 The high intensity of these diffractions indicates a highly crystalline nature of the prepared material. The average particle size of the prepared β-NaFeO2 nanoparticles was calculated as approx. 28 nm using Debye–Scherrer's equation D = Kλ/βcosθ, where D is the crystalline size, K is the shape factor (0.9), λ is the wavelength of Cu-Kα, and β is full width at half maximum. Additionally, Williamson–Hall (W–H) equation, expressed as βcosθ = Kλ/D + 4εsinθ, was utilized for particle size calculation, where ε represents the strain.34 A plot was constructed with 4sinθ on the x-axis and βcosθ on the y-axis as shown in Fig. 3(b). The crystalline size was obtained from the y-intercept of the plot, which was found to be approx. 15 nm by applying linear regression analysis to the data, while the slope of the linear fit yielded the strain.
 |
| | Fig. 3 (a) Analysis of diffraction pattern within 2θ angle range of 10° to 80° by XRD (b) Williamson–Hall plot derived from XRD data of β-NaFeO2 nanoparticles, yielding an average particle size of approximately 15 nm (c) Dynamic Light Scattering (DLS) analysis of β-NaFeO2 nanoparticles in solution with an average particle size of approximately 82 nm (d) surface morphology of β-NaFeO2 nanoparticles by using SEM images at different resolutions (e and f). | |
Dynamic Light Scattering (DLS) was used to determine the hydrodynamic diameter (HD), which reflects the size of the particles in a solution.35 It is important to note that the sizes obtained by DLS are generally larger than those obtained by XRD and SEM, since the latter techniques provide an estimate of the particle size in the dry state.36 The obtained DLS data of β-NaFeO2 nanoparticles are summarized in Fig. 3(c), with the average particle size of approx. 82 nm. This nanoscale dimension is extremely meaningful for a wide variety of applications, as the particle size will have a dramatic impact on biological interactions, as well as systemic distribution in fields such as drug delivery.37 Furthermore, the DLS analysis shows that the particle dispersion is homogeneous and stable providing useful information about the physical characteristics of the nanoparticles.38
The surface morphology and particle size distribution of the β-NaFeO2 nanoparticles was investigated via Scanning Electron Microscopy (SEM). Fig. 3(d–f) shows the SEM images of the nanoparticles at different resolutions, which depicted that the required distribution of particle sizes was relatively uniform, as they appeared as spherical with clear edges, and indicating their porous and homogeneous structure.39 These characteristics leads to large specific surface area and good adsorption performance. Moreover, the SEM in Fig. 2(f) showed that the modified particles were obtained by further deagglomerated and formed a cloud-like structure.
Energy Dispersive X-ray Spectroscopy (EDS) analysis provides a comprehensive insight into the material's elemental composition as shown in Fig. S1.† EDS revealed a distinct composition, showcasing that iron (Fe) constitutes 47% of the overall composition, oxygen (O) comprises 28%, and sodium (Na) accounts for 25%. This composition confirms the purity of the material, specifically demonstrating the presence of pure β-NaFeO2 without any observable impurities.40 The absence of impurities is significant, highlighting the high purity level of the material and its suitability for applications where purity is crucial.
3.2 Comprehensive characterization of β-NaFeO2
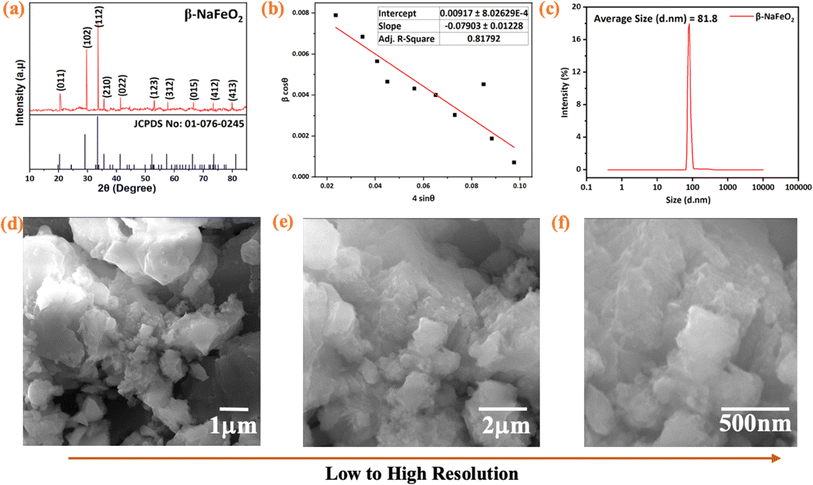
The presence of functional groups on the surface of the synthesized β-NaFeO2 was analyzed using FTIR. In Fig. 4(a), the FTIR spectrum of β-NaFeO2 was observed within the span of 640–4000 cm−1. In this spectrum, we observed transmittance peaks at 754 cm−1. This is attributed to the stretching vibrations of Fe–O–Fe bonds.41 Another peak at about 834 cm−1 was attributed to the Na–O vibration. Weak adsorption bands at 1054 cm−1 showed the stretching of metal–metal bonds, such as Fe–Na. Finally, the peak at approximately 1502 cm−1 is attributed to O![[double bond, length as m-dash]](https://www.rsc.org/images/entities/char_e001.gif) CO bonds.41 The peaks at around 1332, 1640, and 3399 cm−1 align with the vibrational modes of water's O–H bonds, respectively.42
CO bonds.41 The peaks at around 1332, 1640, and 3399 cm−1 align with the vibrational modes of water's O–H bonds, respectively.42
 |
| | Fig. 4 (a) FTIR analysis of β-NaFeO2 nanoparticles with characteristic peaks (754 cm−1 for Fe–O–Fe bonds, 834 cm−1 for Na–O vibrations) (b). UV visible analysis of β-NaFeO2 with the maximum absorbance at 241 nm (c). Optical band gap (Eg) of approximately 4.4 eV (d). Nitrogen adsorption–desorption isothermal curves with the specific surface area of 343.27 m2 g−1 (e). Barrett–Joyner–Halenda (BJH) pore diameter distribution having value of 3.5 nm. | |
The changes in composition associated with the calcination process were tracked using Thermogravimetric Analysis (TGA).43 Fig. S2† exhibited distinctive weight loss patterns observed across three temperature regions. In the initial region, from 40 °C to 120 °C, a mass loss of 7.07% indicated the removal of volatile components, likely including water molecules from sources such as ferric nitrate (Fe(NO3)3·9H2O) or citric acid (C6H8O7·H2O). Transitioning to the second temperature range, spanning 120 °C to 334 °C, a significant mass loss of 43.46% was recorded, suggesting the decomposition of organic constituents such as citric acid and ethylene glycol. In the third temperature region, ranging from 334 °C to 489 °C, a weight loss of 21.88% was observed, likely attributed to the elimination of additional organic residues or the conversion of precursor compounds into the final sodium ferrite (β-NaFeO2).
At room temperature and within a magnetic field range of ±5T, β-NaFeO2 nanoparticles exhibit superparamagnetic behavior, illustrated by the ‘S’-shaped magnetization versus applied magnetic field (M–H) curve in Fig. S3.† The coercivity is affected by of porosity, synthesis technique and the size of the particles.44–46 The absence of coercive field (Hc) and remanence magnetization (Mr) confirms their superparamagnetic nature.47 The saturation magnetization (Ms) at room temperature is measured at 27.11 emu g−1. This change in saturation magnetization (Ms) is attributed to various factors such as surface effects, colloidal stability, nanoparticle volume, interatomic/dipolar interactions, anisotropy energy, dispersed fluid, and environmental factors.48 The superparamagnetic nature of these nanoparticles offers several advantages, making them suitable for applications including magnetic resonance imaging (MRI), targeted drug delivery in cancer treatment, gene therapy, and hyperthermia.49 Superparamagnetic nanoparticles possess unique characteristics, including excellent dispersibility, resistance to agglomeration, minimal hysteresis loss, and magnetization retention only in the presence of a magnetic field, holding great promise for diverse applications in advanced electronics, high-performance materials, energy, and transportation industries.50
UV-Visible spectroscopy was conducted in the wavelength range of 200–800 nm, as shown in Fig. 4(b). In ultraviolet-visible (UV-Vis) spectroscopy, the measurement of maximum absorbance at 241 nm indicates a significant characteristic of the material.51 This peak suggests a specific electronic transition or molecular structure within the material that efficiently absorbs light at this wavelength. Additionally, we utilized Tauc's equation ((αhν)γ = A (hν − Eg)) to calculate the optical band gap (Eg) and gain deeper insight into the optical properties. Here, we denote the absorption coefficient as α, Planck's constant as h, the frequency of light as ν, a constant factor as A, and the energy of the band gap as Eg. An evaluated band gap of about 4.4 eV was observed for the synthesized β-NaFeO2 nanoparticles as displayed in Fig. 4(c). The band gap denotes the energy required for electronic transitions from the valence band to the conduction band. A smaller band gap implies a greater probability of electronic transitions thus render it capable of serving as a potential material for optoelectronic devices and photovoltaic technologies.52 The production of β-NaFeO2 nanoparticles with a maximum absorbance observed at 241 nm along with a band gap of 4.4 eV suggests that this novel material could be suitable for potential applications, e.g., photocatalysis, solar cells, and sensor technology.53
The surface charge of nanoparticles can be determined from the zeta potential, which is an important means by which their colloidal stability can be obtained.54 Fig. S4† shows zeta potential of −28.5 mV for β-NaFeO2 nanoparticles. The zeta potential arises from the charge the particle acquires when it is exposed to a liquid. This negative charge can influence the stability and dispersion of the nanoparticles in a suspension. Generally, higher absolute values (either positive or negative) indicate better stability, as particles with high zeta potential repel each other, preventing aggregation.55 The high negative charge on the nanoparticles can enhance their interaction with positively charged drug molecules or cells, facilitating targeted delivery. The repulsion between negatively charged nanoparticles also reduces the likelihood of their undesired aggregation in physiological environments.
The nitrogen adsorption–desorption isotherm (conducted via BET) is presented in Fig. 4(d). The isotherm exhibits a Type II behavior, indicative of non-rigid aggregates of plate-like particles and slit-shaped pores. The hysteresis loop, denoted as H3, suggests the presence of mesopores in the sample. The specific surface area (SBET) calculated from the BET analysis is determined to be 343.27 m2 g−1, highlighting a substantial surface area available for nitrogen adsorption. The pore diameter distribution, depicted in Fig. 4(e), indicates a dominant mesopore size at 3.55 nm. This finding is further supported by the identification of a mesopore region, suggesting the existence of pores within this size range.56 The calculated pore volume is reported as 0.015 cm3 g−1, indicating the volume of nitrogen gas adsorbed at standard temperature and pressure conditions. Table 1 provides a comparison of the properties of β-NaFeO2 as investigated in this study with relevant data from the literature.
Table 1 Comparison of properties of β-NaFeO2 synthesized in this study with literature values for similar materials
| Property |
This study (β-NaFeO2) |
Literature comparison |
| Particle size (XRD) |
∼28 nm |
258 nm,25 45 nm,57 |
| Crystalline size (WH) |
∼15 nm |
22 nm,50 77 nm25 |
| Optical band gap (UV-Vis) |
4.4 eV |
2.35 eV50 |
| Surface charge (zeta potential) |
−28.5 mV |
−43.51 mV47 |
| Specific surface area (BET) |
343.27 m2 g−1 |
— |
3.3 Photocatalytic performance of β-NaFeO2
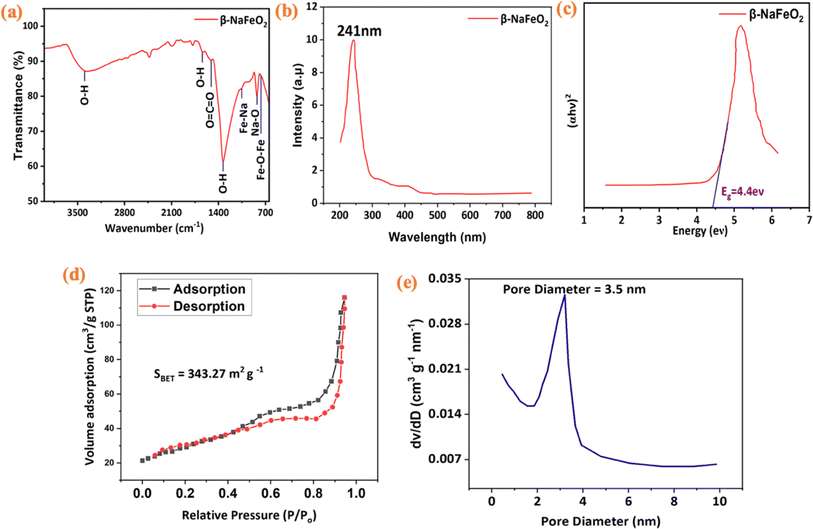
Fig. 5(a) depicts the impact of varying initial dye concentrations on the photocatalytic activity of β-NaFeO2 in methyl red (MR) dye degradation. A clear inverse relationship is observed, with higher initial concentrations leading to decreased photocatalytic degradation efficiency. At 10 ppm, degradation percentage was notably high at 91%, but decreased consistently with increasing concentrations, reaching 4% at 70 ppm. This trend suggests saturation of active sites on β-NaFeO2 surface with higher concentrations, reducing adsorption and thus decreasing the overall photocatalytic activity.58 Fig. 5(b) showcases the effect of temperature on photocatalytic degradation of MR dye using β-NaFeO2. Results indicate a temperature-dependent enhancement in degradation efficiency. For instance, at 20 °C and 10 ppm concentration, degradation percentage is 71%, rising substantially to 89% at 50 °C. This correlation between temperature elevation and enhanced photocatalytic activity underscores the sensitivity of the process to temperature variations. The impact of pH on the photocatalytic degradation of methyl red (MR) dye using β-NaFeO2 nanoparticles is depicted in Fig. 5(c). The results reveal a strong correlation between pH levels and degradation efficiency. Lower pH values, e.g., 2 and 3, result in photocatalytic degradation percentages of 57% and 59%, respectively, while pH values ranging from 4 to 14 show a progressive increase in degradation, peaking at 92% at pH 14. However, degradation slows notably beyond a pH of 11, indicating diminishing enhancement. This reduction in efficiency at lower pH is attributed to the positively charged surface of β-NaFeO2 nanoparticles in acidic conditions, causing electrostatic repulsion with anionic groups of methyl red dye, thus limiting dye adsorption. As pH increases, the surface charge becomes less positive, enhancing electrostatic attraction with dye molecules and promoting adsorption, leading to increased degradation.59 However, degradation slows notably beyond pH 11, possibly due to the formation of anions from OH˙ radicals reacting with HCl, limiting degradation efficiency. The observed pH variations are crucial for optimizing conditions to maximize the photocatalytic efficacy of β-NaFeO2 nanoparticles in methyl red dye degradation.60 The synthesized β-NaFeO2 exhibits superior photocatalytic degradation as compared to other sodium composites and detailed results can be found in Table 3.
 |
| | Fig. 5 (a) Impact of varying initial dye concentrations on photocatalytic degradation of methyl red (MR) dye using β-NaFeO2 (b). Effect of different temperatures ranges (20 °C, 30 °C, 40 °C, 50 °C) on photocatalytic degradation of MR dye with the indication of temperature-dependent enhancement of photocatalytic activity (c). Unveiling the pH-dependent performance dynamics of a promising β-NaFeO2 catalyst (d). Impact of contact time on MR dye degradation with the optimal degradation between 35 to 60 minutes (e). Effect of catalyst dosage on MR dye degradation, with maximum efficiency observed at 40 mg L−1 dosage (f). Pseudo-first-order linear aggression. | |
Fig. 5(d) presents the effect of contact time on MR dye degradation. Optimal degradation occurs between 35 to 60 minutes, beyond which no further degradation is observed. This cessation suggests a possible saturation point in the photocatalytic degradation process, wherein the available active sites on the catalyst surface might have been fully utilized or the concentration of reactive species may have reached a plateau. Moreover, the maximum wavelength recorded during this period was identified at 514 nm, emphasizing a specific wavelength at which the photocatalytic activity of β-NaFeO2 nanoparticles in degrading methyl red dye is most pronounced. The findings highlight the critical role of contact time in achieving optimal photocatalytic efficiency. Fig. 5(e) examines the effect of catalyst dosage on MR dye degradation. Maximum absorption occurs at 40 mg L−1 dosage, with degradation efficiency peaking at 92. Further increases in dosage lead to decreased efficiency, indicating an optimal dosage threshold. Additionally, we carried out radical scavenging experiment by adding scavenger (0.01 M, 2 mL) to the dye solution. The effect of catalyst such as TEMPO (2,2,6,6-tetramethyl-1-piperidinyloxy) on the photodegradation of methyl red dye was extracted by using the irradiation time of 90 min depicted in Fig. S5.† The degradation % of scavenging TEMPO concentration was about 58% after 15 minutes and then increase to 75% after 60 minutes. This intensified scavenging capability contributes to a more effective radical suppression inhibiting the degradation pathways, thereby increasing the percentage of dye adsorption to a higher level. After 60 minutes, no change in degradation was observed.61 Fig. 5(f) demonstrates the pseudo-first-order kinetics analysis for methyl red dye degradation using β-NaFeO2 nanoparticles. This shows absorbance changes over time, while graph depicts linear regression for the pseudo-first-order reaction. The high coefficient of determination (R2 = 0.97895) indicates strong correlation between experimental and theoretical data, supporting the model's suitability. The calculated rate constant (k = 0.01493 min−1) suggests moderate degradation speed. These findings provide a robust understanding of the degradation kinetics. In Fig. S6.†, the Langmuir–Hinshelwood model is applied to analyze methyl red dye degradation. R2 = 0.90 indicates a strong correlation with the experimental data, validating the model's representation of reaction kinetics. The calculated rate constant (k = 0.000613 min−1) signifies the efficiency of β-NaFeO2 nanoparticles in degrading methyl red dye. This comprehensive analysis confirms the applicability of pseudo first-order to describe the degradation process. The rate constant of different factors such as dye concentration, temperature, pH, catalytic dosage, and contact time is presented in Table 2.
Table 2 Coefficient of determination and rate constants for dye concentration, temperature, pH, catalytic dosage, and pseudo first order and Langmuir isotherm
| Factors |
Coefficient of determination R2 |
Rate constant (min−1) |
| Initial dye concentration |
0.91732 |
1.4651 |
| Temperature |
0.8722 |
1.09921 |
| pH |
0.9872 |
2.97919 |
| Photocatalytic dosage |
0.28129 |
0.34286 |
| Pseudo first order |
0.97895 |
0.01493 |
| Langmuir isotherm |
0.90963 |
0.00065 |
Table 3 Comparison of photocatalytic activity of β-NaFeO2 with some other Na composites
| Compounds |
Synthesis method |
Organic dye |
Time (minutes) |
Degradation % |
Reference |
| Bi0.65Na0.2Ba0.15FeO3 |
Sol–gel |
Methylene blue |
120 |
75 |
64 |
| Bi0.96Na0.04FeO3 |
Sol–gel |
Methylene blue |
100 |
94% |
65 |
| Ag10–CN–Na2SO4 |
One-pot |
Rhodamine B |
50 |
96 |
66 |
| Bi0.94Na0.06Fe0.94Co0.066O3 |
Sol–gel |
Methyl blue |
160 |
99.46 |
67 |
| β-NaFeO2 |
Co-precipitation |
Methyl red |
45 |
90.56 |
This study |
For a more profound understanding, a charge transfer mechanism is suggested in Fig. 6. The degradation mechanism is intricately linked to the pH of dye molecules in the aqueous solution and the surface charge characteristics of nanoparticles. The isoelectric point (IEP) plays a pivotal role, delineating a shift between positive and negative charges on the surface of nanoparticles in acidic and basic solution media, respectively.62 This transition in surface charge, influenced by the solution's pH, significantly impacts the interaction between dye molecules and nanoparticles. Upon exposure to sunlight, the surface electrons of the photocatalyst undergo excitation, moving from the valence band to the conduction band and leaving behind positive holes (h+). These holes then react with water, generating hydroxyl radicals. These radicals, particularly hydroxyl radicals and h+, instigate the degradation of dyes. In depth, the electrons present in the conduction band (C·B) react with oxygen to form O2˙, while the holes (h+) generate hydrogen peroxide (H2O2) on reaction with water. This hydrogen peroxide then reacts with electrons (e−) and H+ ions to yield ˙OH radicals. Further, the holes also directly react with water to produce hydroxyl radicals. A concatenation of aforementioned radicals, h+ and OH radicals in tandem attack and degrade the pollutants, converting them to mineral acids such as H2O and CO2.63 The photocatalytic degradation mechanism of methyl dyes using β-NaFeO2 follows several sequential steps:
| | |
- Light absorption and electron–hole pair generation: β-NaFeO2 + hν → e− + h+
| (4) |
| | |
- Hydroxyl radical formation: H2O + hν → OH− + H
| (5) |
| | |
- Electron-induced reduction: e− + O2 → O2−
| (6) |
| | |
- Superoxide radical formation: O2− + H+ → H2O
| (7) |
| | |
- Hydroxyl radical generation: O2− + e− → OH˙
| (8) |
| | |
- Hydroxyl radical interaction with water: OH˙ + H2O → HO2− + H+
| (9) |
| | |
- Hydroxyl radical reaction with methyl red dye: HO2− + Methyl red → H2O + CO2 + Other products
| (10) |
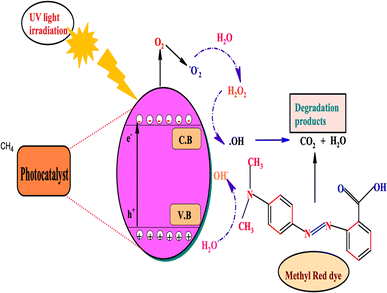 |
| | Fig. 6 Proposed charge transfer mechanism and photocatalytic pathway of methyl red dye using β-NaFeO2 as a catalyst. | |
3.4 Antibacterial activity of β-NaFeO2
Fig. 7 shows inhibition zones produced through the action of antibiotics applied against three strains of bacteria: Klebsiella, E. coli, and Streptococcus. The Streptococcus shows the widest zone, which indicates high susceptibility. The Klebsiella and the E. coli showed narrower zones which indicates reduced efficiency of the antibiotics. The concentration-dependent effect is evident, with larger antibiotic disks leading to bigger inhibition zones, suggesting higher antibacterial activity.68 Varied zone sizes imply potential differences in the antibiotic's mechanisms against distinct bacterial strains. The outcomes highlight a concentration-dependent decrease in β-NaFeO2 nanocomposite antibacterial activity, manifested by prolonged bacterial detection times and enhanced efficacy against Streptococcus (Table 4). This variation is linked to the nanocomposite's interaction with bacterial membranes, causing membrane death and showing specificity against Gram-positive bacteria like Streptococcus.69
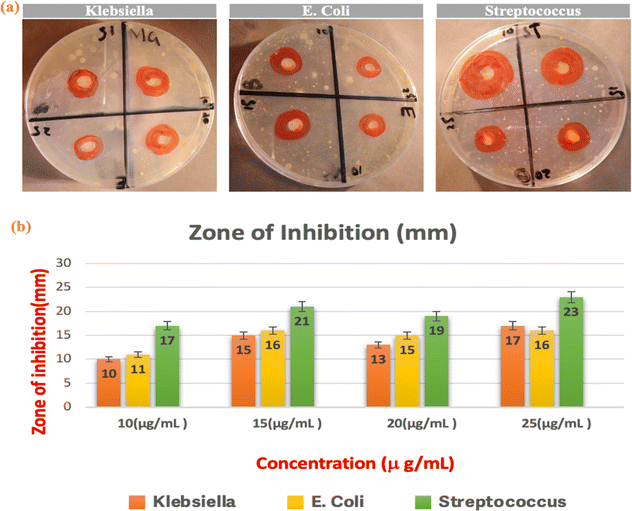 |
| | Fig. 7 Inhibition zones against Klebsiella, E. coli, and Streptococcus show varying susceptibility, with Streptococcus displaying the widest zone. | |
Table 4 Results of synthesized β-NaFeO2 nanoparticles antibacterial activity: zone of inhibition (mm) against various microorganisms
| Concentration |
Inhibition zone (mm) at different concentrations |
| 10 (μg mL−1) |
15 (μg mL−1) |
20 (μg mL−1) |
25 (μg mL−1) |
| Klebsiella |
10 |
15 |
13 |
17 |
| E. coli |
11 |
16 |
15 |
16 |
| Streptococcus |
17 |
21 |
19 |
23 |
The toxicity of β-NaFeO2 measured in mice for the assessment of its safety to environmental species. The mice being treated with dosages of β-NaFeO2 via oral or IV way were regularly checked, and the overall health and the survival of the mice were recorded at different time points. Our experimental data showed that no significant symptoms and no death were observed even at high dose level of β-NaFeO2 in mice for acute toxicity testing. Meanwhile, the necessity of additional research to discover any potential long-term consequences, such as the positioning in tissues and subacute or chronic toxicity that come with long-term exposure to mice organism of β-NaFeO2 still remains crucial. From the results, β-NaFeO2 seems to demonstrate a good safety picture in mice under treatment of applied conditions suggesting it's good safety for biomedical applications.70
The ability of β-NaFeO2 to selectively and rapidly kill bacteria implies that it has multiple mechanisms that target essential bacterial cellular processes. It initially disrupts bacterial cell walls, thereby compromising the structural integrity of the bacterial cell walls, leading to cell lysis and eventual cell death. It also causes massive protein damage as demonstrated by the Cloud Zonal Pellet observed in early time points in the protein profiles in the supplement, which likely arises from the ability of β-NaFeO2 to damage bacterial ribosomes, thus leading to the inhibition of protein synthesis and consequent disruption of vital cellular processes. β-NaFeO2 also induces damage to the DNA of the bacterium by inhibiting both its replication and transcription processes, leading to the instability and consequently death of the bacterium. In addition, the compound also disrupts the bacterial ribosomes inducing Destabilization of the ribosomes thereby halting the synthesis of proteins at the level of polypeptide elongation. Finally, β-NaFeO2 also induces damage to the mitochondria, thus affecting energy metabolism and cellular respiration. These events ultimately lead to cellular collapse and death, emphasizing the diverse and effective antibacterial actions of β-NaFeO2. Fig. 8 represents the detailed schematic of the mechanism of antibacterial activity associated with β-NaFeO2.
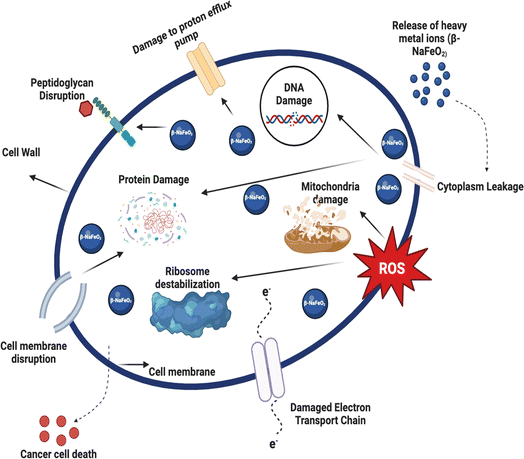 |
| | Fig. 8 Illustration of schematic antibacterial activity mechanism of β-NaFeO2 by targeting essential cellular processes. | |
3.5 Antioxidant activity
Fig. 9(a) presents an antioxidant analysis of β-NaFeO2, comparing its efficacy with standard antioxidants such as vitamin E, vitamin C, and ascorbic acid. The graph displays the percentage inhibition of free radicals at different concentrations (20 μg mL−1, 40 μg mL−1, 60 μg mL−1, 80 μg mL−1, and 100 μg mL−1) for each antioxidant. Higher percentages indicate greater effectiveness in neutralizing free radicals. Vitamin E and vitamin C exhibit increased antioxidant activity with higher concentrations, suggesting efficient scavenging of free radicals. Similarly, β-NaFeO2 demonstrates notable antioxidant effects, with activity rising as concentration increases, indicating efficient neutralization of free radicals.71 Ascorbic acid also shows strong antioxidant effects, with a significant increase in activity at higher concentrations. Overall, the analysis underscores β-NaFeO2 potential as an effective antioxidant, comparable to or even surpassing standard antioxidants like vitamin E and vitamin C. Its concentration-dependent increase in antioxidant activity suggests a promising role in combating oxidative stress and neutralizing free radicals in biological systems (Table 5).
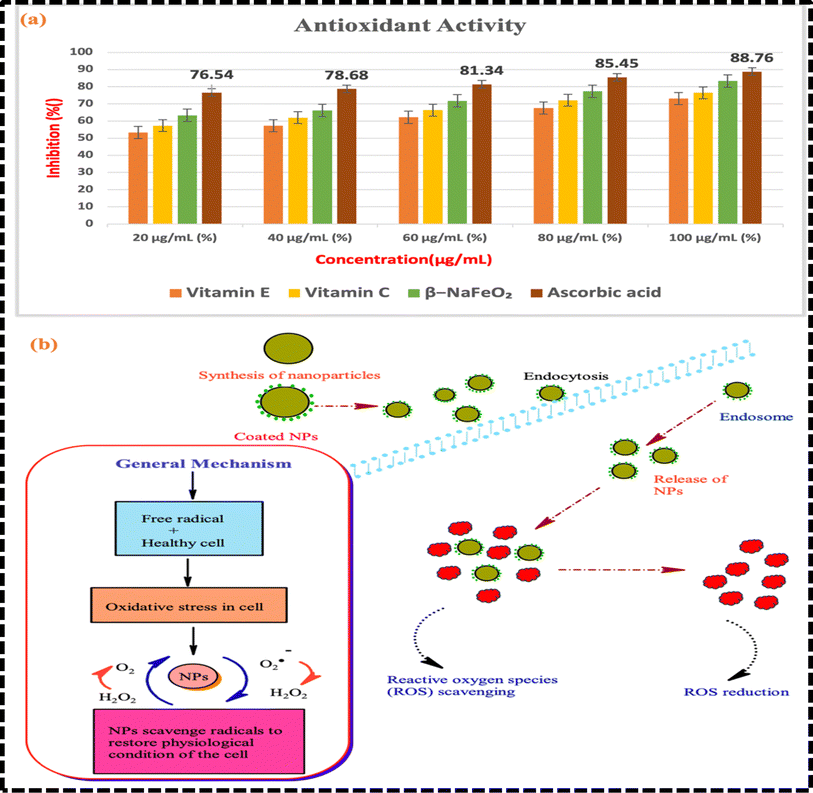 |
| | Fig. 9 (a) An antioxidant analysis of β-NaFeO2 compared to standard antioxidants (vitamin E, vitamin C, and ascorbic acid) at varying concentrations (20 μg mL−1 to 100 μg mL−1) (b) proposed mechanism of β-NaFeO2 nanoparticles in combating oxidative stress and protecting cells from free radical-induced damage in biological systems. | |
Table 5 Results of synthesized β-NaFeO2 ferrite NPs antioxidant activity
| Compounds |
20 μg mL−1 (%) |
40 μg mL−1 (%) |
60 μg mL−1 (%) |
80 μg mL−1 (%) |
100 μg mL−1 (%) |
| Vitamin E |
53.34 |
57.2 |
62.16 |
67.65 |
73.02 |
| Vitamin C |
57.28 |
61.91 |
66.35 |
72.12 |
76.43 |
| β-NaFeO2 |
63.34 |
66.16 |
71.76 |
77.32 |
83.34 |
| Ascorbic acid |
76.54 |
78.68 |
81.34 |
85.45 |
88.76 |
For a deeper understanding, a mechanism illustrating antioxidant activity is proposed in Fig. 8(b). Antioxidants are substances that play a crucial role in protecting cells from damage caused by free radicals. Free radicals are highly reactive molecules or ions that can cause oxidative stress in the body, leading to cell damage and contributing to various diseases, including cancer and cardiovascular diseases. As β-NaFeO2 has boron, sodium, and iron ions in its structure; it shows quite versatile antioxidant activities. Iron ions react with reactive oxygen species (ROS), e.g., hydroxyl radical (˙OH) or superoxide radical (˙O2−), by undergoing redox reactions. Therefore, it scavenges these radicals by donating its electrons. On the other hand, boron ions form very stable complexes with ROS and prevent them to be reactive and damage cellular components by oxidation. β-NaFeO2 also neutralizes reactive oxygen species by participating hydrogen atom transfer reactions. It donates the hydrogen atoms to ROS and turns ROS into less harmful species. Moreover, it has a quite good ability to chelate the transition metal ions like copper and nickel. These metal ions can catalyze the generation of reactive oxygen species via Fenton-like reactions and β-NaFeO2 prevents this to happen.
4 Conclusions
In conclusion, the comprehensive analysis of synthesized β-NaFeO2 nanoparticles through various characterization techniques has provided a thorough understanding of their structural, morphological, compositional, magnetic, optical, and catalytic properties. XRD analysis confirmed the highly crystalline nature of the nanoparticles, exhibiting a hexagonal phase with an orthorhombic structure, while DLS and SEM elucidated their nanoscale dimensions, homogeneous dispersion, and porous morphology. EDS analysis confirmed the purity of the material, crucial for its suitability in diverse applications. Furthermore, the superparamagnetic behavior observed through VSM highlights their potential in magnetic resonance imaging (MRI) and targeted drug delivery. UV-Visible spectroscopy revealed significant optical properties, while zeta potential analysis indicated colloidal stability. Photocatalytic studies unveiled their efficacy in degrading methyl red dye, with factors such as initial dye concentration, temperature, pH, contact time, and catalyst dosage influencing degradation efficiency. Antibacterial testing demonstrated concentration-dependent inhibition zones, particularly notable against Streptococcus strains, underscoring their potential in biomedical applications. Antibacterial testing revealed concentration-dependent inhibitory zones, most notably against Streptococcus strains, highlighting their potential in biomedical applications. Furthermore, antioxidant analysis demonstrated that they were as effective as normal antioxidants, indicating a function in oxidative stress reduction. Overall, the synthesized β-NaFeO2 nanoparticles exhibit multifaceted capabilities, positioning them as promising candidates for a wide range of scientific and technological applications, with future research endeavors focused on optimizing synthesis techniques and elucidating underlying mechanisms.
Data availability
Data will be made available on request.
Author contributions
Tahira Jabeen: conceptualization; data curation; formal analysis; funding acquisition; investigation; methodology; project administration; resources; software; validation; visualization; roles/writing – original draft; and writing – review & editing. Shahid Khan: conceptualization; data curation; formal analysis; funding acquisition; investigation; methodology; project administration; resources; software; supervison; validation; visualization; roles/writing – original draft; and writing – review & editing. Sana Javid: data curation; formal analysis; funding acquisition; investigation; methodology. Rabia Ayoub: data curation; formal analysis; funding acquisition; investigation; methodology. Waqar Azeem: data curation; formal analysis; funding acquisition; investigation; methodology. Motola Martin: conceptualization; data curation; formal analysis; funding acquisition; investigation; methodology; project administration; resources; software; validation; visualization; roles/writing – original draft; and writing – review & editing.
Conflicts of interest
The authors declare that they have no known competing financial interests or personal relationships that could have appeared to influence the work reported in this paper.
References
- A. Fujishima and K. Honda, Electrochemical photolysis of water at a semiconductor electrode, nature, 1972, 238, 37–38 CrossRef CAS PubMed.
- C. Byrne, G. Subramanian and S. C. Pillai, Recent advances in photocatalysis for environmental applications, J. Environ. Chem. Eng., 2018, 6, 3531–3555 CrossRef CAS.
- S. Muzammal, A. Ahmad, M. Sheraz, J. Kim, S. Ali, M. B. Hanif, I. Hussain, S. Pandiaraj, A. Alodhayb and M. S. Javed, Polymer-Supported Nanomaterials for Photodegradation: Unraveling the Methylene Blue Menace, Energy Convers. Manage.: X, 2024, 100547 CAS.
- V. Berezenko, M. B. Hanif, M. Sihor, Y. Zeng, M. F. Edelmannová, M. Reli, H. Iftikhar, M. Z. Khan, T. Plecenik and M. Gregor, Exploring next-generation X (NO3) Y (X= Na+, K+, Sr2+, Ag+; Y= 1, 2) electrolytes for enhanced TiO2 nanotube hydrogen generation, Int. J. Hydrogen Energy, 2024 DOI:10.1016/j.ijhydene.2024.02.295.
- M. B. Hanif, G. K. Thirunavukkarasu, V. Liapun, H. Makarov, M. Gregor, T. Roch, T. Plecenik, K. Hensel, M. Sihor and O. Monfort, Fluoride-free synthesis of anodic TiO 2 nanotube layers: A promising environmentally friendly method for efficient photocatalysts, Nanoscale, 2022, 14, 11703–11709 RSC.
- M. B. Hanif, M. Sihor, V. Liapun, H. Makarov, O. Monfort and M. Motola, Porous vs. Nanotubular Anodic TiO2: Does the Morphology Really Matters for the Photodegradation of Caffeine?, Coatings, 2022, 12, 1002 CrossRef CAS.
- E. Issaka, J. N.-O. Amu-Darko, S. Yakubu, F. O. Fapohunda, N. Ali and M. Bilal, Advanced catalytic ozonation for degradation of pharmaceutical pollutants-A review, Chemosphere, 2022, 289, 133208 CrossRef CAS PubMed.
- M. F. Farid, M. U. U. Rehman, J. U. Rehman, W. Sajjad, M. W. Fazal, M. A. Khan and N. Akhtar, In situ synthesis of manganese oxide/iron oxide/polyaniline composite catalyst for oxygen evolution reaction, J. Mater. Res., 2024, 1–11 Search PubMed.
- S. Brahma, S. M. Raafi, S. N. Arju and J. U. Rehman, Dyeability and mechanical properties of banana fiber reinforced polypropylene composite, SPE Polym., 2024, 5, 82–87 Search PubMed.
- M. Sihor, M. B. Hanif, G. K. Thirunavukkarasu, V. Liapun, M. F. Edelmannova, T. Roch and M. Motola, Anodization of large area Ti: a versatile material for caffeine photodegradation and hydrogen production, Catal. Sci. Technol., 2022, 12(16), 5045–5052 RSC.
- G. K. Thirunavukkarasu, M. B. Hanif, V. Liapun, K. Hensel, J. Kupčík, J. Lorincik, I. Elantyev, O. Monfort and M. Motola, Decrypting the growth of anodic TiO2 nanotube layers in eco-friendly fluoride-free nitrate-based electrolyte for enhanced photocatalytic degradation of organic pollutants, Mater. Res. Bull., 2023, 165, 112322 CrossRef CAS.
- V. Liapun, M. B. Hanif, M. Sihor, X. Vislocka, S. Pandiaraj, V. Unnikrishnan, G. K. Thirunavukkarasu, M. F. Edelmannová, M. Reli and O. Monfort, Versatile application of BiVO4/TiO2 S-scheme photocatalyst: Photocatalytic CO2 and Cr (VI) reduction, Chemosphere, 2023, 337, 139397 CrossRef CAS PubMed.
- A. B. Mapossa, W. Mhike, J. L. Adalima and S. Tichapondwa, Removal of organic dyes from water and wastewater using magnetic ferrite-based titanium oxide and zinc oxide nanocomposites: a review, Catalysts, 2021, 11, 1543 CrossRef CAS.
- A. K. Tangra, S. Singh and G. Singh, Investigation of the magnetic behavior of the ferrites of alkali and alkaline earth metals for biomedical application., Mater. Today: Proc., 2020, 36, 621–625 Search PubMed.
- K. Ong, K. Bai, P. Blaha and P. Wu, Electronic structure and optical properties of AFeO2 (A= Ag, Cu) within GGA calculations, Chem. Mater., 2007, 19, 634–640 CrossRef CAS.
- J. Ahmed, C. K. Blakely, J. Prakash, S. R. Bruno, M. Yu, Y. Wu and V. V. Poltavets, Scalable synthesis of delafossite CuAlO2 nanoparticles for p-type dye-sensitized solar cells applications, J. Alloys Compd., 2014, 591, 275–279 CrossRef CAS.
- J. Ahmed, V. V. Poltavets, J. Prakash, S. M. Alshehri and T. Ahamad, Sol – gel synthesis, structural characterization and bifunctional catalytic activity of nanocrystalline delafossite CuGaO2 particles, J. Alloys Compd., 2016, 688, 1157–1161 CrossRef CAS.
- J. Ahmed and Y. Mao, Synthesis, characterization and electrocatalytic properties of delafossite CuGaO2, J. Solid State Chem., 2016, 242, 77–85 CrossRef CAS.
- T. Ahmad, D. I. Lone, S. G. Ansari, J. Ahmed, T. Ahamad and S. Alshehri, Multifunctional properties and applications of yttrium ferrite nanoparticles prepared by citrate precursor route, Mater. Des., 2017, 126, 331–338 CrossRef CAS.
- M. Büyükyazi and S. Mathur, 3D nanoarchitectures of α-LiFeO2 and α-LiFeO2/C nanofibers for high power lithium-ion batteries, Nano Energy, 2015, 13, 28–35 CrossRef.
- A. Manthiram, An outlook on lithium ion battery technology, ACS Cent. Sci., 2017, 3, 1063–1069 CrossRef CAS PubMed.
- D. Susan-Resiga and L. Vekas, From high magnetization ferrofluids to nano-micro composite magnetorheological fluids: properties and applications, Rom. Rep. Phys., 2018, 70, 501 Search PubMed.
- C. Gu, A.-B. Jia, Y.-M. Zhang and S. X.-A. Zhang, Emerging electrochromic materials and devices for future displays, Chem. Rev., 2022, 122, 14679–14721 CrossRef CAS PubMed.
- S. N. Ahmed and W. Haider, Heterogeneous photocatalysis and its potential applications in water and wastewater treatment: a review, Nanotechnology, 2018, 29, 342001 CrossRef PubMed.
- D. G. Araiza, F. Plascencia-Hernández and H. Pfeiffer, Enhanced CO2 capture over Li-containing β-NaFeO2 materials: effect of lithium nitrate addition, Fuel, 2022, 324, 124605 CrossRef CAS.
- I. E. Grey, R. J. Hill and A. W. Hewat, A neutron powder diffraction study of the β to γ phase transformation in NaFeO2, Z. fur Krist. – Cryst. Mater., 1990, 193, 51–70 CrossRef CAS.
- Y. Sang, H. Liu and A. Umar, Photocatalysis from UV/Vis to near-infrared light: towards full solar-light spectrum activity, ChemCatChem, 2015, 7, 559–573 CrossRef CAS.
- T. Islam, M. R. Repon, T. Islam, Z. Sarwar and M. M. Rahman, Impact of textile dyes on health and ecosystem: A review of structure, causes, and potential solutions, Environ. Sci. Pollut. Res. Int., 2023, 30, 9207–9242 CrossRef CAS PubMed.
- W. Yu and H. Xie, A review on nanofluids: preparation, stability mechanisms, and applications, J. Nanomater., 2012, 2012, 1–17 Search PubMed.
- G. Nagaraju, K. Karthik and M. Shashank, Ultrasound-assisted Ta2O5 nanoparticles and their photocatalytic and biological applications, Microchem. J., 2019, 147, 749–754 CrossRef CAS.
- P. Intaphong, A. Phuruangrat, K. Karthik, P. Dumrongrojthanath, T. Thongtem and S. Thongtem, Effect of pH on phase, morphology and photocatalytic properties of BiOBr synthesized by hydrothermal method, J. Inorg. Organomet. Polym. Mater., 2020, 30, 714–721 CrossRef CAS.
- E. Sreelekha, B. George, A. Shyam, N. Sajina and B. Mathew, A comparative study on the synthesis, characterization, and antioxidant activity of green and chemically synthesized silver nanoparticles, J. Bionanosci., 2021, 11, 489–496 CrossRef.
- A. K. Tangra, S. Singh and G. Singh, Investigation of the magnetic behavior of the ferrites of alkali and alkaline earth metals for biomedical application, Mater. Today: Proc., 2021, 36, 621–625 CAS.
- S. Singh, A. Tovstolytkin and G. S. Lotey, Magnetic
properties of superparamagnetic β-NaFeO2 nanoparticles, J. Magn. Magn. Mater., 2018, 458, 62–65 CrossRef CAS.
- C. Beliciu and C. Moraru, Effect of solvent and temperature on the size distribution of casein micelles measured by dynamic light scattering, J. Dairy Sci., 2009, 92, 1829–1839 CrossRef CAS PubMed.
- Z. Abbas, J. P. Holmberg, A. K. Hellström, M. Hagström, J. Bergenholtz, M. Hassellöv and E. Ahlberg, Synthesis, characterization and particle size distribution of TiO2 colloidal nanoparticles, Colloids Surf., A, 2011, 384, 254–261 CrossRef CAS.
- M. O. Emeje, I. C. Obidike, E. I. Akpabio and S. I. Ofoefule, Nanotechnology in Drug Delivery, Recent Advances in Novel Drug Carrier Systems, 2012, vol. 1 Search PubMed.
- R. Tantra, S. Jing, S. K. Pichaimuthu, N. Walker, J. Noble and V. A. Hackley, Dispersion stability of nanoparticles in ecotoxicological investigations: the need for adequate measurement tools, J. Nanopart. Res., 2011, 13, 3765–3780 CrossRef CAS.
- D. Su, Development of Novel Electrode Materials for Li-Ion Batteries and Na-Ion Batteries, Chem, 2013, 4, 3688–3690 Search PubMed.
- I. Bakaimi, E. L. Papadopoulou, G. Kenanakis, E. Spanakis and A. Lappas, Thin film growth of delafossite-related derivative β-NaFeO2 on a ZnO layer by pulsed laser deposition, Thin Solid Films, 2018, 645, 424–430 CrossRef CAS.
- L. Durai and S. Badhulika, Facile synthesis of large area pebble-like β-NaFeO2 perovskite for simultaneous sensing of dopamine, uric acid, xanthine and hypoxanthine in human blood, Mater. Sci. Eng. C, 2020, 109, 110631 CrossRef CAS PubMed.
- A. Ghorbani and A. D. Khalaji, β-NaFeO2@ SrFe12O19 magnetic nanocomposite: synthesis, characterization, magnetic properties and antibacterial activity, J. Mater. Sci.: Mater. Electron., 2022, 33, 7792–7798 CrossRef CAS.
- M. G. D. Guaita, O. José de Oliveira, P. R. Catarini da Silva, L. H. Dall'Antonia and A. Urbano, New α-NaFeO2 synthesis route for green sodium-ion batteries, Green Mater., 2022, 40, 1–10 Search PubMed.
- M. Ahmad, M. Shahid, Y. M. Alanazi, A. ur Rehman, M. Asif and C. W. Dunnill, Lithium ferrite (Li0. 5Fe2. 5O4): synthesis, structural, morphological and magnetic evaluation for storage devices, J. Mater. Res. Technol., 2022, 18, 3386–3395 CrossRef CAS.
- M. George, A. M. John, S. S. Nair, P. Joy and M. Anantharaman, Finite size effects on the structural and magnetic properties of sol–gel synthesized NiFe2O4 powders, J. Magn. Magn. Mater., 2006, 302, 190–195 CrossRef CAS.
- M. Kooti and A. N. Sedeh, Synthesis and characterization of NiFe2O4 magnetic nanoparticles by combustion method, J. Mater. Sci. Technol., 2013, 29, 34–38 CrossRef CAS.
- S. Singh, J. Kaur, A. Tovstolytkin and G. Singh, Superparamagnetic β-NaFeO2: a novel, efficient and biocompatible nanoparticles for treatment of cancer by nanohyperthermia, Mater. Res. Express, 2019, 6, 0850a0856 Search PubMed.
- V. Kalita, A. Tovstolytkin, S. Ryabchenko, O. Yelenich, S. Solopan and A. Belous, Mechanisms of AC losses in magnetic fluids based on substituted manganites, Phys. Chem. Chem. Phys., 2015, 17, 18087–18097 RSC.
- Y. Xiao and J. Du, Superparamagnetic nanoparticles for biomedical applications, J. Mater. Chem. B, 2020, 8, 354–367 RSC.
- S. Singh, A. K. Tangra and G. S. Lotey, Optical and luminescence properties of β-NaFeO 2 nanoparticles, Electron. Mater. Lett., 2018, 14, 594–598 CrossRef CAS.
- M. Enneffati, M. Rasheed, B. Louati, K. Guidara and R. Barillé, Morphology, UV–visible and ellipsometric studies of sodium lithium orthovanadate, Opt. Quantum Electron., 2019, 51, 1–19 CrossRef.
- Q. H. Wang, K. Kalantar-Zadeh, A. Kis, J. N. Coleman and M. S. Strano, Electronics and optoelectronics of two-dimensional transition metal dichalcogenides, Nat. Nanotechnol., 2012, 7, 699–712 CrossRef CAS PubMed.
- R. Ameta, M. S. Solanki, S. Benjamin and S. C. Ameta, Photocatalysis, Advanced Oxidation Processes for Waste Water Treatment, Elsevier, 2018, pp. 135–175 Search PubMed.
- X. R. Shao, X. Q. Wei, X. Song, L. Y. Hao, X. X. Cai, Z. R. Zhang, Q. Peng and Y. F. Lin, Independent effect of polymeric nanoparticle zeta potential/surface charge, on their cytotoxicity and affinity to cells, Cell proliferation, 2015, 48, 465–474 CrossRef CAS PubMed.
- S. Karmakar, Particle size distribution and zeta potential based on dynamic light scattering: Techniques to characterize stability and surface charge distribution of charged colloids, Recent Trends in Materials: Physics and Chemistry, 2019, pp. 117–159 Search PubMed.
- J. R. Matos, M. Kruk, L. P. Mercuri, M. Jaroniec, L. Zhao, T. Kamiyama, O. Terasaki, T. J. Pinnavaia and Y. Liu, Ordered mesoporous silica with large cage-like pores: structural identification and pore connectivity design by controlling the synthesis temperature and time, J. Am. Chem. Soc., 2003, 125, 821–829 CrossRef CAS PubMed.
- A. Ghorbani and A. Khalaji, β-NaFeO2@SrFe12O19 magnetic nanocomposite: synthesis, characterization, magnetic properties and antibacterial activity, J. Mater. Sci.: Mater. Electron., 2022, 33 Search PubMed.
- R. Chatterjee, S. Sarkar, A. K. Dutta, Y. Akinay, S. Dasgupta and M. Mukhopadhyay, Scope and Challenges for Green Synthesis of Functional Nanoparticles, Novel Applications of Carbon Based Nano-Materials, CRC Press, 2022, pp. 274–318 Search PubMed.
- F. Azeez, E. Al-Hetlani, M. Arafa, Y. Abdelmonem, A. A. Nazeer, M. O. Amin and M. Madkour, The effect of surface charge on photocatalytic degradation of methylene blue dye using chargeable titania nanoparticles, Sci. Rep., 2018, 8, 7104 CrossRef PubMed.
- A. Jamil, T. H. Bokhari, T. Javed, R. Mustafa, M. Sajid, S. Noreen, M. Zuber, A. Nazir, M. Iqbal and M. I. Jilani, Photocatalytic degradation of disperse dye Violet-26 using TiO2 and ZnO nanomaterials and process variable optimization, J. Mater. Res. Technol., 2020, 9, 1119–1128 CrossRef CAS.
- Y. Zhang, W. Li, Z. Hu, X. Jing and L. Yu, Mo@ PANI-catalyzed oxidative deoximation reaction, Chin. Chem. Lett., 2024, 35, 108938 CrossRef CAS.
- X. Ma, M. Li, P. Pfeiffer, J. Eisener, C.-D. Ohl and C. Sun, Ion adsorption stabilizes bulk nanobubbles, J. Colloid Interface Sci., 2022, 606, 1380–1394 CrossRef CAS PubMed.
- W. Zuo, L. Zhang, Z. Zhang, S. Tang, Y. Sun, H. Huang and Y. Yu, Degradation of organic pollutants by intimately coupling photocatalytic materials with microbes: a review, Crit. Rev. Biotechnol., 2021, 41, 273–299 CrossRef CAS PubMed.
- S. Chauhan, C. Anand, B. Tripathi, M. Kumar, M. Sahni, R. Singh and S. Singh, Influence of Na substitution on structural, magnetic, optical and photocatalytic properties of bismuth ferrite nanoparticles, J. Mater. Sci.: Mater. Electron., 2020, 31, 20191–20209 CrossRef.
- A. Haruna, I. Abdulkadir and S. O. Idris, Visible light induced photodegradation of methylene blue in sodium doped bismuth barium ferrite nanoparticle synthesized by sol-gel method, Avicenna J. Environ. Health Eng., 2018, 5, 120–126 CrossRef CAS.
- K.-L. Wang, Y. Li, T. Sun, F. Mao, J.-K. Wu and B. Xue, Ultrafine silver nanoparticles deposited on sodium-doped graphitic carbon nitride towards enhanced photocatalytic degradation of dyes and antibiotics under visible light irradiation, Appl. Surf. Sci., 2019, 476, 741–748 CrossRef CAS.
- S. Chauhan, M. Kumar, A. Yousuf, P. Rathi, M. Sahni and S. Singh, Effect of Na/Co co-substituted on structural, magnetic, optical and photocatalytic properties of BiFeO3 nanoparticles, Mater. Chem. Phys., 2021, 263, 124402 CrossRef CAS.
- J. Pasquet, Y. Chevalier, E. Couval, D. Bouvier, G. Noizet, C. Morlière and M.-A. Bolzinger, Antimicrobial activity of zinc oxide particles on five micro-organisms of the Challenge Tests related to their physicochemical properties, Int. J. Pharm., 2014, 460, 92–100 CrossRef CAS PubMed.
- R. Pachaiappan, S. Rajendran, P. L. Show, K. Manavalan and M. Naushad, Metal/metal oxide nanocomposites for bactericidal effect: A review, Chemosphere, 2021, 272, 128607 CrossRef CAS PubMed.
- X. Chen, S. Zhuang, W. Yan, Z. Zeng, J. Feng, H. Cao and L. Yu, Synthesis, antibacterial evaluation, and safety assessment of Se@ PLA as a potent bactericide against Xanthomonas oryzae pv. oryzae, Chin. Chem. Lett., 2024, 109635 CrossRef.
- S. B. Nimse and D. Pal, Free radicals, natural antioxidants, and their reaction mechanisms, RSC Adv., 2015, 5, 27986–28006 RSC.
|
| This journal is © The Royal Society of Chemistry 2024 |

 Open Access Article
 This Open Access Article is licensed under a Creative Commons Attribution-Non Commercial 3.0 Unported Licence
 *a,
Muhammad Shahid Khan
*a,
Muhammad Shahid Khan