 Open Access Article
NMR analysis of structural geometry and molecular dynamics in perovskite-type N(CH3)4CdBr3 crystal near high-temperature phase transition
Ae Ran Lim *ab and
Sun Ha Kimcd
aGraduate School of Carbon Convergence Engineering, Jeonju University, Jeonju 55069, Korea
bDepartment of Science Education, Jeonju University, Jeonju 55069, Korea. E-mail: aeranlim@hanmail.net; arlim@jj.ac.kr
cKorea Basic Science Institute, Seoul Western Center, Seoul 03759, Korea
dDepartment of Chemistry, Kyungpook National University, Daegu 41566, Korea
First published on 24th April 2024
Abstract
The NMR chemical shifts, linewidths, spin–lattice relaxation times in the rotating system T1ρ, and spin–lattice relaxation times in the laboratory system T1 were evaluated for the perovskite-type N(CH3)4CdBr3 crystal, aiming to understand the changes in the structural geometry and molecular dynamics from phase I to phase II. From the temperature-dependence of the 1H, 13C, 14N, and 113Cd NMR chemical shifts, the structural geometry underwent a continuous change, without anomalous changes around (TC = 390 K). However, the linewidths in phase I were narrower than those in phase II, indicating that the motional averaging effects were caused by the rapid rotation of the N(CH3)4 group. Sudden changes in T1 and T1ρ were observed near TC, for which the activation energy Ea in phase I was approximately 12 times larger than that in phase II; the small Ea values in phase II indicate a large degree of freedom for the methyl group and CdBr6 octahedra, whereas the large Ea in phase I was primarily attributed to the overall N(CH3)4 and the 113Cd in the CdBr6 groups. Consequently, the phase transition mechanisms of N(CH3)4CdBr3 are related to reorientation of the N(CH3)4 group and the arrangement of the CdBr6 groups.
1. Introduction
ABX3 perovskites are an interesting group of compounds that undergo phase transition accompanied by remarkable changes in their physical and chemical properties.1–7 Many studies on organic–inorganic hybrid compounds have yielded meaningful results because of the wide applicability of these materials.8–17 Tetramethylammonium tribromocadmate (N(CH3)4CdBr3) belongs to the N(CH3)4BX3 (B = 55Mn, 59Co, 64Cu, 65Zn, 113Cd; X = 35Cl or 79Br) family of ABX3-type perovskites.18–29 The crystal structure at room temperature consists of isolated linear chains of face-sharing CdBr6 octahedra separated by N(CH3)4 ions. N(CH3)4CdBr3 has two phase transition temperatures, 160 and 390 K,19,22,23 with three phases denoted as III, II, and I, respectively, in the order of increasing temperature. The high-temperature transition is a second-order process, whereas the low-temperature transition is a weak first-order phase transition. In phase I (above 390 K), N(CH3)4CdBr3 adopts a hexagonal structure in the space group P63/mmc with Z = 2. In phase II (below 390 K), the crystal exhibits the same hexagonal structure in space group P63/m with Z = 2. At room temperature, the crystal structure is hexagonal with lattice constants of a = b = 9.404 Å, c = 6.990 Å, α = β = 90°, and γ = 120°.20 The phase transition at 160 K leads to another hexagonal phase with space group P61 and Z = 6. The cell dimensions in phase III are characterized by the lattice constants a = b = 9.257 Å, c = 20.900 Å, α = β = 90°, and γ = 120°,24,26 where the c-axis is three times longer compared to that in phase II. The structures, space groups, lattice constants, and Z in the phases I, II, III are summarized in Table 1.In a previous study, the 1H nuclear magnetic resonance (NMR) spin–lattice relaxation time T1 in the laboratory frame did not reveal any anomaly in the temperature range of 77–400 K for N(CH3)4CdBr3.18 This phenomenon can be explained by the relaxation mechanism owing to the fast reorientation of the CH3 groups. According to a previous report by Baisa et al.,25 a singlet 79Br nuclear quadrupole resonance (NQR) spectrum was obtained for phases II and I, and a triplet spectrum was recorded for phase III. In addition, the NMR T1 for 79Br near 160 K exhibits strong temperature dependence and changes by three orders of magnitude in the temperature range of 77–310 K.27 Overall, the relaxation processes of 1H and 79Br in N(CH3)4CdBr3 near the phase-transition temperature of 160 K were studied in the laboratory frame using static NMR. The structural phase transition near the high phase-transition temperature of 390 K presented by our group in the past was briefly studied using magic angle spinning (MAS) NMR in the rotating frame and static NMR in the laboratory frame.30
Measurements of the spin–lattice relaxation time in the rotating system (T1ρ) have the advantage of probing the molecular motion within the kHz range, whereas the spin–lattice relaxation time in the laboratory system (T1) reflects motion within the MHz range.
Although various experimental results have been reported for N(CH3)4CdBr3, the structural geometry and the molecular motion associated with the phase transitions remain undisclosed. This study is expected to provide important insights into the characteristics regarding the advancements in perovskite materials. Therefore, N(CH3)4CdBr3 single crystals are grown, and it was confirmed that the high phase-transition temperature occurs at (TC =390 K). The crystal structure is also confirmed to be hexagonal, using single-crystal X-ray diffraction (SCXRD) experiments. The temperature dependence of the 1H and 13C MAS NMR chemical shifts is obtained to elucidate the changes in the structural geometry related to the phase transition. The temperature dependences of the 14N and 113Cd NMR chemical shifts near TC in the laboratory system are also measured. In addition, the spin–lattice relaxation times in the rotating system (T1ρ) for 1H and 13C as a function of temperature are considered, and the corresponding spin–lattice relaxation times in the laboratory system (T1) for 113Cd are measured by a static NMR method. Based on these results, the activation energies near the phase-transition temperature of 390 K are discussed in relation to the role of the N(CH3)4 group in the cation and Cd in the anion.
2. Experimental
2.1. Crystal growth
Single crystals of N(CH3)4CdBr3 were grown by slow evaporation method using N(CH3)4Br (Aldrich, 98%) and CdBr2 (Aldrich, 98%) in a molecular weight ratio of 2![[thin space (1/6-em)]](https://www.rsc.org/images/entities/char_2009.gif) :
:![[thin space (1/6-em)]](https://www.rsc.org/images/entities/char_2009.gif) 1, in an aqueous solution. However, N(CH3)4CdBr3 crystals did not grow well at a ratio of 1
1, in an aqueous solution. However, N(CH3)4CdBr3 crystals did not grow well at a ratio of 1![[thin space (1/6-em)]](https://www.rsc.org/images/entities/char_2009.gif) :
:![[thin space (1/6-em)]](https://www.rsc.org/images/entities/char_2009.gif) 1 molar composition. N(CH3)4Br and CdBr2 compounds with the ratio of 2
1 molar composition. N(CH3)4Br and CdBr2 compounds with the ratio of 2![[thin space (1/6-em)]](https://www.rsc.org/images/entities/char_2009.gif) :
:![[thin space (1/6-em)]](https://www.rsc.org/images/entities/char_2009.gif) 1 were dissolved in distilled water, and stirred and heated at a slightly higher temperature to obtain a completely saturated solution. The single crystals obtained by slow evaporation after a few weeks in a thermostat at 300 K were hexagonal in shape, transparent and colorless with dimensions of 7 × 3 × 2 mm3. To prevent degradation from moisture in the air, the crystals were stored in a desiccator.
1 were dissolved in distilled water, and stirred and heated at a slightly higher temperature to obtain a completely saturated solution. The single crystals obtained by slow evaporation after a few weeks in a thermostat at 300 K were hexagonal in shape, transparent and colorless with dimensions of 7 × 3 × 2 mm3. To prevent degradation from moisture in the air, the crystals were stored in a desiccator.
2.2. Characterization
Differential scanning calorimetry (DSC) curves were obtained using a DSC instrument at a heating and cooling rate of 10 °C min−1 in the 200–570 K range under a flow of dry nitrogen gas. The variation in the crystal morphology with respect to the temperature change was observed using an optical polarizing microscope (Carl Zeiss) on a hot stage (Linkam THMS 600).The structure and lattice parameters at 250 and 300 K were determined using single-crystal X-ray diffraction (SCXRD) at the Korea Basic Science Institute (KBSI) of the Seoul Western Centre. The crystal was mounted on a diffractometer (Bruker D8 Venture PHOTON III M14) with a graphite-monochromated Mo Kα target and a nitrogen cold stream (−50 °C). Data were collected using the SMART APEX3 and SAINT programs and absorption-corrected using the multiscan method in SADABS. The single-crystal structure was analyzed using direct methods and supplemented with least squares analysis of the entire F2 matrix using SHELXTL.31 All non-hydrogen atoms were anisotropically refined, and the hydrogen atoms were included at geometrically ideal positions. Further, the powder X-ray diffraction (PXRD) patterns were obtained at 300 K and 410 K using an XRD spectrometer with a Mo Kα radiation source by utilizing the SCXRD method.32
NMR spectra of the N(CH3)4CdBr3 crystals were recorded using a solid-state NMR spectrometer (Bruker 400 MHz Avance II+) at KBSI. The 1H magic angle spinning (MAS) NMR data at the Larmor frequency of ωo/2π = 400.13 MHz and the 13C MAS NMR data at the Larmor frequency of ωo/2π = 100.61 MHz were measured as a function of temperature. To minimize the spinning sideband, the MAS speed was measured at 10 kHz. 1H and 13C chemical shifts were recorded using tetramethylsilane as the standard. The one-dimensional (1D) NMR spectra of 1H and 13C were obtained with a delay time of 0.5 s. The 1H and 13C spin–lattice relaxation times in the rotating system (T1ρ) were measured with delay times from 200 μs to 100 ms; a 90° pulse was used for acquiring 1H and 13C data, with a delay of 3.6–3.8 μs. In addition, the static 14N NMR chemical shift at a Larmor frequency ωo/2π = 28.90 MHz was monitored with increasing temperature. The 14N NMR chemical shift was determined using NH4NO3 as the reference standard, and 14N NMR spectra were obtained using a solid-state echo sequence. The static NMR spectra for the 113Cd nucleus at ωo/2π = 88.73 MHz were obtained using the same NMR spectrometer. The spin–lattice relaxation time in the laboratory system (T1) was measured by applying the pulse sequence method. A 90° pulse width was used for 113Cd at 4.3 μs. Temperature-dependent NMR spectra were obtained between 180 and 430 K. The temperature was maintained by controlling the N2 gas flow and heater current within an accuracy of ±0.5 K.
3. Results and discussion
3.1. Single-crystal XRD
SCXRD analysis at 250 and 300 K revealed that N(CH3)4CdBr3 crystallized with a hexagonal structure belonging to space group P63/m. At 250 K, the lattice parameters are a = b = 9.3878 (4) Å, c = 6.9957 (5) Å, α = β = 90°, γ = 120°, and Z = 2, whereas the lattice constants at 300 K are a = b = 9.417 (3) Å, c = 7.0002 (3) Å, α = β = 90°, γ = 120°, and Z = 2. The crystal structure is composed of isolated linear chains of face-shared CdBr6 octahedra, which are widely separated by N(CH3)4 ions. Here, the bond lengths for C–H are approximately 0.91 Å.26 The single-crystal structure with the chains of CdBr6 octahedra parallel to the c-axis are shown in Fig. 1.20 Cd2+ is at the origin and three Br− ions form a regular triangle. Br on the +z axis is shown as open circles, and Br on the −z axis is shown as gray circles.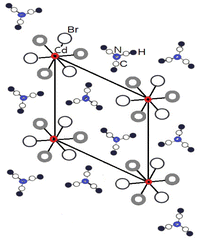 | ||
| Fig. 1 Projection of the unit cell of hexagonal N(CH3)4CdBr3 at room temperature along the c-axis (big open circle Br in the +z and gray circle Br in −z). | ||
3.2. Phase-transition temperature
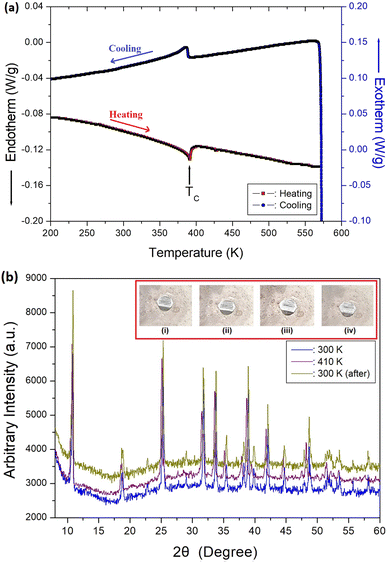
DSC analysis of the N(CH3)4CdBr3 crystals was performed at a heating and cooling rate of 10 °C min−1 with a sample amount of 15.70 mg. The DSC curves show weak endothermic and exothermic peaks near 390 K during heating and cooling, respectively (Fig. 2(a)); the corresponding enthalpy for the peak was 300 J mol−1. The endothermic peak at 390 K corresponds to the phase-transition temperature, arising from the transition from one hexagonal structure to another. The phase transition at this temperature was reversible. Variable-temperature optical polarizing microscopy analysis of the morphology shows that the single crystals did not change until the temperature was increased from 300 to 573 K. The morphologies of the N(CH3)4CdBr3 single crystal at (a) 300 K, (b) 350 K, (c) 430 K, and (d) 300 K (after cooling) are shown in the inset of Fig. 2(b).PXRD analysis was performed below and above the phase-transition temperature, in the 2θ range of 8–60° (Fig. 2(b)). The PXRD pattern recorded at 300 K (blue) differs slightly from that recorded at 410 K (violet). This result correlates well with the endothermic peak obtained from the DSC results; this difference is related to the phase transition temperature, TC (=390 K). The PXRD pattern (dark yellow) obtained after cooling from 410 to 300 K matches well with the results obtained at 300 K before heating. The DSC and PXRD results show that the phase transition is reversible.
3.3. NMR chemical shifts and linewidths for 1H and 13C
Structural analysis was performed by monitoring 1H in N(CH3)4CdBr3 using MAS NMR at increasing temperatures. The temperature-dependences of the 1H NMR chemical shifts and linewidths are shown in Fig. 3. At 300 K, the 1H NMR chemical shift appearing at approximately δ = 3.57 ppm (inset of Fig. 3) is assigned to the methyl proton. The sidebands for the proton signal obtained at a spinning speed of 10 kHz are indicated by open circles. The 1H NMR chemical shifts were nearly continuous within the error range, without any anomalous changes near TC as the temperature increased. The full-width-at-half-maximum (FWHM) in the 1H NMR spectrum increased as the temperature increased and then decreased again rapidly near TC; the FWHM decreased from 2 ppm at 300 K to 1.67 ppm near TC.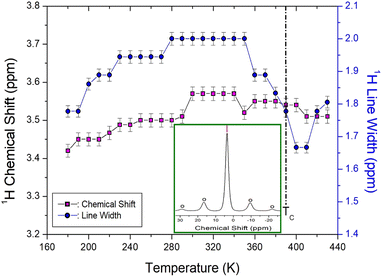 | ||
| Fig. 3 NMR chemical shifts and line widths for 1H in N(CH3)4CdBr3 as the temperature rises ((Inset): The 1H NMR spectrum at 300 K, and open circles are spinning sidebands). | ||
The temperature-dependences of the NMR chemical shifts and 13C linewidths for N(CH3)4CdBr3 are shown in Fig. 4. The 13C MAS NMR spectrum at 300 K exhibited one resonance signal (inset of Fig. 4) and a 13C chemical shift was recorded at 58.82 ppm, related to the methyl carbon. With increasing temperature, the 13C NMR chemical shift moved from 58.09 to 59.49 ppm without an anomalous change near TC, but increased almost linearly with increasing temperature. The continuous change in the NMR chemical shifts due to the local field around the 13C nuclei indicates changes in the crystallographic geometry, without anomalous changes near TC. The 13C linewidth decreased from 0.35 ppm at 300 K to 0.26 ppm near TC, similar to the change in the linewidth of 1H. This implies that the sources of the interactions between the atoms and ions around the 1H and 13C nuclei are similar. The 13C linewidths were very small compared to the 1H linewidths. The less broadening of the linewidths for 1H and 13C near 160 K are thought to be due to the low phase-transition temperature.
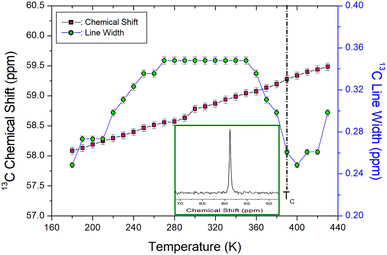 | ||
| Fig. 4 NMR chemical shifts and line widths for 13C in N(CH3)4CdBr3 as the temperature rises ((Inset): The 13C NMR spectrum at 300 K). | ||
3.4. 1H and 13C NMR spin–lattice relaxation times in the rotating system, T1ρ
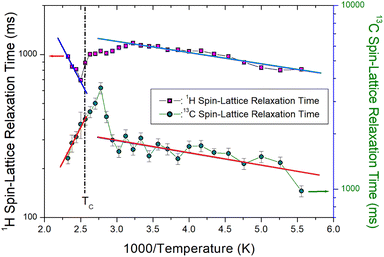
The changes in the intensity of the 1H and 13C NMR signals with variation of the delay times were recorded at a given temperature, and the relationship to the decay rate of the magnetization was defined by the spin–lattice relaxation time, T1ρ:33,34
P(τ)/P(0) = A![[thin space (1/6-em)]](https://www.rsc.org/images/entities/char_2009.gif) exp(−τ/T1ρ) exp(−τ/T1ρ)
| (1) |
![[thin space (1/6-em)]](https://www.rsc.org/images/entities/char_2009.gif) exp(Ea/kBT) and the slow motion as ω1τC ≫ 1, T1ρ−1 α ω1−2 exp(−Ea/kBT).34 The plot is separated into different motion areas at a temperature that is approximately 50 K lower than the phase transition temperature. At low temperatures, the 1H T1ρ and 13C T1ρ values were in the fast-motion region. At high temperatures, the 13C T1ρ values were attributed to the slow-motion region, whereas the 1H T1ρ values were related to the fast-motion region.
exp(Ea/kBT) and the slow motion as ω1τC ≫ 1, T1ρ−1 α ω1−2 exp(−Ea/kBT).34 The plot is separated into different motion areas at a temperature that is approximately 50 K lower than the phase transition temperature. At low temperatures, the 1H T1ρ and 13C T1ρ values were in the fast-motion region. At high temperatures, the 13C T1ρ values were attributed to the slow-motion region, whereas the 1H T1ρ values were related to the fast-motion region.
Based on Bloembergen–Purcell–Pound (BPP) theory, the experimental values of T1ρ can be expressed by the correlation time τC for re-orientational motion, and T1ρ for molecular motion as follows:35–37
1/T1ρ = R{4τC/[1 + ω12τC2] + τC/[1 + (ωC − ωH)2 τC2] + 3τC/[1 + ωC2τC2]+ 6τC/[1 + (ωC + ωH)2 τC2] + 6τC/[1 + ωH2τC2]} = A![[thin space (1/6-em)]](https://www.rsc.org/images/entities/char_2009.gif) exp(−Ea/kBT) exp(−Ea/kBT)
| (2) |
In addition, the Ea for 13C obtained from the slope of T1ρ vs. 1000/temperature (represented by green circles in Fig. 5) at low and high temperatures was 1.14 ± 0.25 and 16.17 ± 1.83 kJ mol−1, respectively. Here, Ea is determined at temperatures ranging from 180 to 340 K below TC and from 390 to 430 K above TC.
To determine the sample temperature by spinning rate during MAS NMR experiments, the variance between the set temperature and the actual sample temperature inside the probe was previously reported by Guan and Stark. The equation for the fast MAS probe is cited as46,47
Ts (f) = 0.98 To +3.79 (°C)![[thin space (1/6-em)]](https://www.rsc.org/images/entities/char_2009.gif) exp(ωs/19.6 kHz)−3.49 (°C) exp(ωs/19.6 kHz)−3.49 (°C)
| (3) |
3.5. Static 14N NMR chemical shifts and linewidths
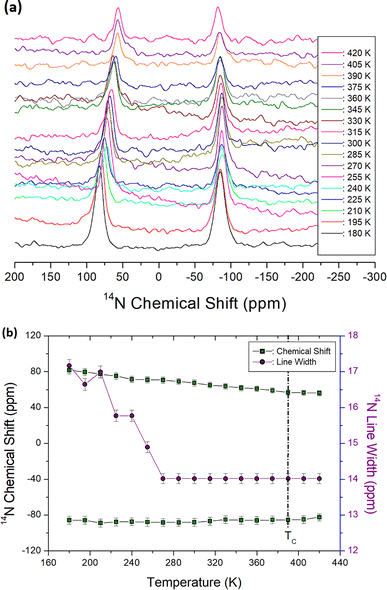
The 14N static NMR spectra of the N(CH3)4CdBr3 single crystal were obtained with variation of the temperature in the range of 180–420 K using the solid-state echo method. An external magnetic field of 9.4 T was applied to the single crystal in an arbitrary axial direction. The 14N NMR chemical shifts spanned a significantly wider range than the 1H and 13C chemical shifts, suggesting that valuable insight can be gained by considering the surrounding environment of 14N. Because the spin number of 14N is I = 1, the NMR spectrum is expected to have two resonance lines owing to quadrupole interactions.33 Two 14N NMR signals appeared on the left and right sides of the zero point of the chemical shifts with variation of the temperature, as shown in Fig. 6(a). At 300 K, 14N NMR signals were recorded at 16.69 and 12.80 ppm. As the temperature increased, the 14N NMR chemical shifts decreased slightly without any change near TC (Fig. 6(b)); the surrounding environment of 14N hardly changes as the temperature increases. The reduction in 14N NMR signal intensity with increasing temperature is caused by cross-linking with 13C around the 14N nuclei. The 14N linewidth was broad as approximately 17.30 ppm at low temperatures, and the linewidth as the temperature increased became slightly narrower. As the temperature increased, it was found that although there was little change in the 14N NMR chemical shift, molecular motion due to line width became very active.3.6. Static 113Cd NMR chemical shifts and spin–lattice relaxation times in the laboratory system, T1
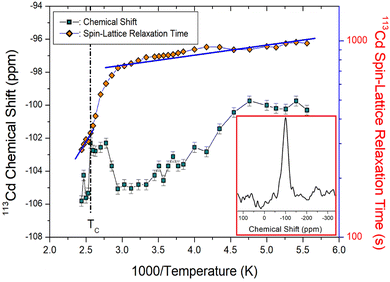
The natural abundance and spin number of 113Cd are 12.3% and I = 1/2, respectively;33,37 the peak has relatively high NMR sensitivity. Therefore, 113Cd NMR spectroscopy is used to examine the structural geometries and molecular dynamics of various organic and inorganic materials. The NMR spectrum of 113Cd was recorded for only one resonance line owing to the spin I = 1/2. The 113Cd NMR spectrum at 200 K is shown in the inset of Fig. 7. The 113Cd NMR chemical shift was recorded using CdCl2O8·6H2O as a standard. The 113Cd NMR chemical shifts decreased as the temperature increased, and then increased slightly near TC. Above TC, the chemical shifts moved downfield, indicating that the surrounding environment of 113Cd changed slightly near TC.The saturation recovery traces for the 113Cd spectrum of the N(CH3)4CdBr3 single crystal were measured using a static NMR method; the recovery traces were satisfactorily fitted to a single-exponential function:30
P(∞) − P(τ)/P(∞) = A![[thin space (1/6-em)]](https://www.rsc.org/images/entities/char_2009.gif) exp(−τ/T1) exp(−τ/T1)
| (4) |
![[thin space (1/6-em)]](https://www.rsc.org/images/entities/char_2009.gif) exp(−Ea/kBT).
exp(−Ea/kBT).
The experimental value of T1 was expressed in terms of the correlation time τC for the molecular motions based on the BPP theory:35,37
1/T1 = R{τC/[1 + ωC2τC2] + 4τC/[1 + 4ωC2τC2]} = A![[thin space (1/6-em)]](https://www.rsc.org/images/entities/char_2009.gif) exp(−Ea/kBT) exp(−Ea/kBT)
| (5) |
4. Conclusion
The data confirm that N(CH3)4CdBr3 crystallizes with a hexagonal structure having a phase transition temperature of 390 K. The NMR chemical shifts, linewidths, T1ρ, and T1 of the perovskite-type N(CH3)4CdBr3 crystal were considered, aiming to understand the structural geometry and changes in the molecular dynamics during the high-temperature transition from phase I to II. Analysis of the 1H, 13C, and 14N NMR chemical shifts of the cation with temperature showed that the surrounding structural geometry underwent a continuous change, without anomalous changes around TC. However, the 113Cd NMR chemical shifts showed a small change near TC. N(CH3)4CdBr3 crystal has a hexagonal structure both above and below the phase transition temperature, and only the space group is different. In relation to this, although the structural geometry changes around 1H, 13C, and 14N were not significantly detected, the 113Cd NMR chemical shifts are changed slightly near TC. It is inferred that it is related to the arrangement of Cd in CdBr3 groups. The linewidths of the 1H, 13C, and 14N peaks of phase I were narrower than those of phase II, indicating that the motional averaging effects were caused by the rapid rotation of the N(CH3)4 group in phase I, resulting from the motional narrowing caused by the rapid rotation of the N(CH3)4 groups.The T1ρ values for the 1H and 13C nuclei, and the T1 values for 113Cd were obtained with increasing temperature. The sudden changes in T1 and T1ρ near TC indicate a sudden variation in the energy transfer in the area surrounding the protons, carbons, and cadmium. The Ea obtained from the temperature-dependence of T1 and T1ρ for 1H, 13C, and 113Cd was generally ∼1.2 kJ mol−1 below TC and almost 14.5 kJ mol−1 above TC, for phases I and II, respectively, where the Ea for phase I is ∼12 times larger than that for phase II. Because the Ea of CH3 is lower than that of N(CH3)4, the methyl group moves more easily and freely. The small values of Ea for phase II indicate a large degree of freedom for the methyl group and CdBr6 octahedra in N(CH3)4CdBr3. For phase I, the large values of Ea were primarily attributed to the overall molecular motion of N(CH3)4 and 113Cd in the CdBr6 groups. These results are supported by the following: the 113Cd T1 obtained herein changes rapidly near TC, and the 79Br NQR spectrum reported by other groups25 also changes rapidly near TC. Consequently, the phase-transition mechanisms of N(CH3)4CdBr3 at high temperature are related to the reorientation of the N(CH3)4 group and arrangement of 113Cd in the octahedral CdBr6 groups. The results of this study on organic–inorganic hybrid perovskite-type N(CH3)4CdBr3 are expected to facilitate their potential applications in various electrochemical devices such as supercapacitors, batteries, and fuel cells. In the future, this study may be able to provide a complete link between the structure, dynamics and NMR properties observed here by combining Ab initio molecular dynamics NMR calculations.48,49
Author contributions
A. R. Lim performed crystal growth, X-ray experiments, and wrote the manuscript. S. H. Kim measured NMR experiments.Conflicts of interest
There are no conflicts to declare.Acknowledgements
This work was supported by the National Research Foundation of Korea (NRF) grant funded by the Korean Government (MSIT) (2023R1A2C2006333) and the Basic Science Research Program through the NRF, funded by the Ministry of Education, Science, and Technology (2016R1A6A1A03012069).References
- I. Ruiz-Larrea, J. Diaz-Hernandez, A. Fraile-Rodriguez, A. Arnaiz, E. H. B. Canegra and A. Lopez-Echarri, J. Phys.: Condens. Matter, 1999, 11, 2259 CrossRef CAS.
- T. Asahi and K. Izutsu, J. Phys. Soc. Jpn., 2003, 72, 330 CrossRef CAS.
- A. El-Korashy and M. G. Brik, Solid State Commun., 2005, 135, 298 CrossRef CAS.
- D. G. Sannikov, Phys. Solid State, 2005, 47, 324 CrossRef CAS.
- F. Hlel, A. Ben Rhaeim and K. Guidara, Russ. J. Inorg. Chem., 2008, 53, 785 CrossRef.
- S. Tancharakon, F. P. A. Fabbiani, D. R. Allan, K. V. Kamenev and N. Robertson, J. Am. Chem. Soc., 2006, 128, 9205 CrossRef PubMed.
- J. S. Kim, M. Lee and A. R. Lim, J. Appl. Phys., 2018, 124, 205501 CrossRef.
- S. Gonzalez-Carrero, R. E. Galian and J. Perez-Prieto, Part. Syst. Char., 2015, 32, 709 CrossRef CAS.
- W. Liu, J. Xing, J. Zhao, X. Wen, K. Wang, P. Lu and Q. Xiong, Adv. Opt. Mater., 2017, 5, 1601045 CrossRef.
- I. Saikumar, S. Ahmad, J. J. Baumberg and G. Vijaya Prakash, Scr. Mater., 2012, 67, 834 CrossRef CAS.
- P. Mondal, S. K. Abdel-Aal, D. Das and S. K. Manirul Islam, Catal. Lett., 2017, 147, 2332 CrossRef CAS.
- M. Yuan, L. N. Quan, R. Comin, G. Walters, R. Sabatini, O. Voznyy, S. Hoogland, Y. Zhao, E. M. Beauregard, P. Kanjanaboos, Z. Lu, D. H. Kim and E. H. Sargent, Nat. Nanotechnol., 2016, 11, 872 CrossRef CAS PubMed.
- C. N. R. Rao, A. K. Cheetham and A. Thirumurugan, J. Phys. Condens. Matter., 2008, 20, 83202 CrossRef.
- J.-P. Correa-Baena, M. Saliba, T. Buonassisi, M. Gratzel, A. Abate, W. Tress and A. Hagfeldt, Science, 2017, 358, 739 CrossRef CAS PubMed.
- E. Edri, S. Kirmayer, M. Kulbak, G. Hodes and D. Cahen, J. Phys. Chem. Lett., 2014, 5, 429 CrossRef CAS PubMed.
- C. Eames, J. M. Frost, P. R. F. Barnes, B. C. O'Regan, A. Walsh and M. S. Islam, Nat. Commun., 2015, 6, 7497 CrossRef CAS PubMed.
- D. P. McMeekin, G. Sadoughi, W. Rehman, G. E. Eperson, M. Saliba, M. T. Horantner, A. Haghighirad, N. Sakai, L. Korte, B. Rech, M. B. Johnston, L. M. Herz and H. J. Snaith, Science, 2016, 351, 151 CrossRef CAS PubMed.
- K. Venu, V. S. S. Sastry and J. Ramakrishna, J. Phys. C: Solid State Phys., 1987, 20, 1519 CrossRef CAS.
- P. Vanek, M. Havrankova, F. Smutny and B. Brezina, Ferroelectrics, 1990, 109, 51 CrossRef CAS.
- T. Asahi, K. Hasebe and K. Gesi, Acta Crystallogr., Sect. C: Cryst. Struct. Commun., 1990, 46, 2252 CrossRef.
- K. Gesi, J. Phys. Soc. Jpn., 1990, 59, 432 CrossRef CAS.
- M. N. Braud, M. Couzi and N. B. Chanh, J. Phys.: Condens. Matter, 1990, 2, 8243 CrossRef CAS.
- M. N. Braud, M. Couzi, N. B. Chanh, C. Courseille, B. Gallois, C. Hauw and A. Meresse, J. Phys.: Condens. Matter, 1990, 2, 8209 CrossRef CAS.
- T. Asahi, K. Hasebe and K. Gesi, Acta Crystallogr., Sect. C: Cryst. Struct. Commun., 1991, 47, 1208 CrossRef.
- D. F. Baisa, E. D. Chesnokov, Z. V. Czapla, S. V. Pogrebnyak and I. G. Vertegel, Acta Phys. Pol., A, 1993, 84, 271 CrossRef CAS.
- G. Aguirre-Zamalloa, G. Madariaga, M. Couzi and T. Breczewski, Acta Crystallogr., Sect. B: Struct. Sci., 1993, 49, 691 CrossRef.
- D. F. Baisa, E. D. Chesnokov and Z. Czapla, Acta Phys. Pol., A, 1994, 86, 357 CrossRef CAS.
- J. M. Igartua, G. Aguirre-Zamalloa, I. Ruiz-Larrea, M. Couzi, A. Lopez-Echarri and T. Breczewski, J. Therm. Anal. Calorim., 1994, 41, 1211 CrossRef CAS.
- Z. Czapla and S. Dacko, Ferroelectrics, 1996, 185, 49 CrossRef.
- A. R. Lim, Appl. Magn. Reson., 2017, 48, 297 CrossRef CAS.
- SHELLXTL v6.10, Bruker AXS, Inc., Madison, Wisconsin, USA, 2000 Search PubMed.
- A. R. Lim, Sci. Rep., 2023, 13, 6133 CrossRef CAS PubMed.
- A. Abragam, The Principles of Nuclear Magnetism, Oxford University Press, 1961 Search PubMed.
- C. Na and A. R. Lim, Sci. Rep., 2023, 13, 21008 CrossRef CAS PubMed.
- N. Bloembergen, E. M. Purcell and R. V. Pound, Phys. Rev., 1948, 73, 679 CrossRef CAS.
- J. L. Koenig, Spectroscopy of Polymers, Elsevier, 1999 Search PubMed.
- R. K. Harris, Nuclear Magnetic Resonance Spectroscopy, Pitman Pub., UK, 1983 Search PubMed.
- S. Albert, H. S. Gutowsky and J. A. Ripmeester, J. Chem. Phys., 1972, 56, 3672 CrossRef CAS.
- T. Tsuneyoshi, N. Nakamura and H. Chihara, J. Magn. Reson., 1977, 27, 191 CAS.
- S. Sato, R. Ikeda and D. Nakamura, Bull. Chem. Soc. Jpn., 1986, 59, 1981 CrossRef CAS.
- S. Sato, R. Ikeda and D. Nakamura, Ber. Bunsen-Ges. Phys. Chem, 1987, 91, 122 CrossRef CAS.
- K. J. Mallikarjunaiah, K. Jugeshwar Singh, K. P. Ramesh and R. Damle, Magn. Reson. Chem., 2008, 46, 110 CrossRef CAS PubMed.
- K. Pogorzelec-Glaser, J. Kaszyńska, A. Rachocki, J. Tritt-Goc, N. Piślewski and A. Pietraszko, J. Chem., 2009, 33, 1894 CAS.
- P. A. Beckmann, C. E. Moore and A. L. Rheingold, Phys. Chem. Chem. Phys., 2016, 18, 1720 RSC.
- B. V. S. Murthy, K. P. Ramesh and J. Ramakrishna, Z. Naturforsch., 1993, 48a, 868 CrossRef.
- X. Guan and R. E. Stark, Solid State Nucl. Magn. Reson., 2010, 38, 74 CrossRef CAS PubMed.
- M. Y. Choi, S. J. Lee, H. Ju and A. R. Lim, RSC Adv., 2022, 12, 20679 RSC.
- L. Szeleszczuk, D. M. Pisklak, M. Z. Pisklak and J. Com, Chemistry, 2019, 40, 811 CAS.
- A. H. Mazurek, L. Szeleszuk and D. M. Pisklak, Int. J. Mol. Sci., 2021, 22, 4378 CrossRef CAS PubMed.
| This journal is © The Royal Society of Chemistry 2024 |

