
 Open Access Article
 This Open Access Article is licensed under a Creative Commons Attribution-Non Commercial 3.0 Unported Licence
Scanning electrochemical microscopy for the differentiation of radical-induced degradation mechanisms in polymer electrolyte membranes
Susanne Thiel and
Maik Eichelbaum*
and
Maik Eichelbaum*
Nuremberg Institute of Technology, Department of Applied Chemistry, Prinzregentenufer 47, Nuremberg, Germany. E-mail: maik.eichelbaum@th-nuernberg.de; Tel: +49 (0)911 5880 1561
First published on 26th April 2024
Abstract
In this work, a spatially resolved analytical method based on scanning electrochemical microscopy (SECM) to distinguish different degradation phenomena in polymer electrolyte membranes was developed. SECM was combined with a Franz diffusion cell to distinguish between radical-induced aging of a sulfonated tetrafluoroethylene based fluoropolymer-copolymer due to deactivation of the sulfonic acid groups followed by a decreased proton conductivity, and the radical-induced formation of cracks and holes in the polymer. The experiments were performed with ferrocyanide as redox mediator to detect holes and cracks, and protons (sulfuric acid) to determine the through-plane proton conductivity, respectively. A pristine Nafion™ membrane, a pristine Nafion™ membrane with an artificial pinhole and a Nafion™ membrane aged with Fenton's reagent were investigated to prove the measurement principle. It could be shown that holes and cracks can be reliably detected with this approach and discriminated from a change in proton conductivity. The presence of holes in the investigated aged membranes was confirmed by scanning electron microscopy, whereas the loss of sulfonate groups could be supported by infrared spectroscopy measurements.
1 Introduction
Polymer electrolyte membranes (PEM) are essential parts of PEM fuel cells (PEMFC) and PEM water electrolyzers (PEMWE).1–4 These electrochemical energy converters are needed to implement hydrogen as sustainable energy vector in a future carbon-neutral energy system. The ambitious goals of the Paris climate protection agreement, the associated CO2 emission targets for the transport sector and the future de facto ban on internal combustion engines in the European Union require the accelerated development of climate-neutral drives for the transport sector.5,6 Hydrogen-based drive systems, and fuel cells in particular, are expected to play a key role in heavy-duty transportation. Hydrogen PEMFCs are scalable for both the high power ranges and large daily mileages of heavy-duty transport. They have a high system efficiency and are also free of local pollutant and greenhouse gas emissions.7 Compared to state-of-the-art lithium-ion batteries, they allow a higher gravimetric density and a longer mileage per charge or tank load.8,9 In order to achieve acceptance of PEMFC-based drive systems as an alternative to combustion engines, this technology must be reliable, inexpensive, efficient and offer a long service life.5 While the long-term target for the service life of fuel cells for passenger cars, as specified by the Department of Energy (DoE), is 8000 hours, this value is as high as 30![[thin space (1/6-em)]](https://www.rsc.org/images/entities/char_2009.gif) 000 hours for heavy-duty vehicles.7,9–11 It is therefore obvious that extending the service life of fuel cells is crucial in order to help fuel cells achieve a breakthrough in the commercial vehicle sector.
000 hours for heavy-duty vehicles.7,9–11 It is therefore obvious that extending the service life of fuel cells is crucial in order to help fuel cells achieve a breakthrough in the commercial vehicle sector.
One of the most important components particularly affected by aging in PEMFCs and PEMWEs is the membrane.1–4 The PEM typically consists of a sulfonated tetrafluoroethylene based fluoropolymer-copolymer. Its main tasks are to transfer protons from the anode to the cathode and to avoid the diffusion of hydrogen and oxygen gas to the opposite electrochemical half cell. It also has to be electrically insulating to rule out short circuits. In addition to its use in fuel cells, the PEM is also required in state-of-the-art water electrolyzers for the production of (green) hydrogen. The stability of the PEM in electrolyzers is particularly important in combination with renewable energies.12 The volatility of renewable energies leads to voltage fluctuations that put particular stress on the membrane.
Since PEMWEs and PEMFCs work under acidic conditions, noble metals such as iridium and platinum must be utilized. The usage of these materials is associated with very high costs.11 In order to reduce production costs, research has been carried out in recent years on alternative anion exchange membranes (AEM) that could also work with non-noble metals such as cobalt, nickel, iron and copper.13,14 Furthermore, per- and polyfluoroalkyl substances (PFAS) are currently subject to stricter regulations due to environmental and health concerns.15 As a consequence, extensive research is being conducted into fluorine-free alternatives for PEMs at the moment. Promising options here are hydrocarbon polymer and sulfonated polyphenylene membranes.16,17
As a consequence, all these demanding applications and developments regarding polymer electrolyte membranes make an understanding of degeneration processes necessary in order to improve the robustness and lifetime of these materials. The degradation of the polymer electrolyte membrane based on sulfonated tetrafluoroethylene based fluoropolymer-copolymers can be characterized primarily by the deactivation or loss of the acidic sulfonate groups and by the destruction of the polymeric fluorohydrocarbon structure and the associated formation of cracks and holes.4 During fuel cell or electrolyzer operation, highly reactive species such as hydroxyl radicals can be formed through the decomposition of hydrogen peroxide, which can be an intermediate product of electrochemical oxygen reduction. The radicals can attack the C–F bonds as schematically shown by the following equations:4
 | (1) |
 | (2) |
| R–COF + H2O → R–COOH + HF | (3) |
Alternatively, sulfonic acid groups can be attacked by radicals in the following way:4,18
 | (4) |
The reaction can then proceed as shown in eqn (2) and (3). Whereas the former reactions can lead to cracks and holes due to the attack of the fluorohydrocarbon backbone of the membrane, the latter reaction induces a reduced proton conductivity that is facilitated by the sulfonate groups. The formation of radicals and their attack of the membrane structure can be artificially reproduced using the Fenton reaction:
| H2O2 + Fe2+ → Fe3+ + OH˙ + OH− | (5) |
In order to increase the lifetime of established and newly developed PEM candidates, powerful analytical methods are needed to quickly and effectively assess and comprehend the robustness of membrane materials. Microscopic methods with high local resolution play an important role in characterizing the aging of fuel cell and electrolyzer components. For example, gas or liquid composition, electrochemical potential, humidity and temperature vary both within a cell and between cells in an electrolyzer or fuel cell stack under operation conditions. This has different effects on the materials and can lead to a heterogeneous degradation of the membrane.19–21
Due to its versatility, scanning electrochemical microscopy (SECM) is a powerful method to characterize and investigate different materials with high local resolution. In recent years, applications of SECM in energy research such as the characterization of batteries, fuel cells, supercapacitors and solar cells have been reported.22 E.g., SECM was combined with a diffusion cell for membrane characterization.23–26 Jadi et al. investigated the proton conductivity of Nafion™–polypyrrole membranes23 and polyaniline modified membranes.24 Another work focused on measuring the heterogeneity of aged Nafion™ membranes.25 Kallio et al. investigated proton transport through poly(vinylidene fluoride) and poly(vinylidene fluoride-co-hexafluoropropylene) films.26 The potential of alternating current (AC) SECM to map the heterogeneity of the in-plane proton conductivity of PEMs was recently shown by our group.27 Nafion™ membranes were activated both partially and over the entire area with various acids and deactivated with either the Fenton reagent or barium hydroxide solution. We could prove with AC-SECM that activation (deactivation) led to a reduction (increase) in the local impedance.
However, since SECM basically measures the total impedance of the sample, it is usually very difficult to identify the specific origin of the impedance change. E.g., an increased diffusion of protons (or other species) through the membrane in a diffusion cell could be due to an increased proton conductivity or simply by the presence of holes and cracks in the membrane. Since radicals can induce both, as shown in eqn (1)–(4), this differentiation is essential to really understand the underlying aging processes. The aim of our current work was hence to develop a spatially resolved analysis method based on SECM that can distinguish between the radical-induced heterogeneous change in through-plane proton conductivity and the formation of holes and cracks in the membrane. Since the number of acid groups is closely related to proton conduction, which itself is a function of proton activity, it is possible to investigate the acid group strength and distribution in the membrane by measuring the proton activity dependent current of the proton reduction reaction at the tip of the SECM electrode. To trigger the proton diffusion and conduction through the membrane, we combined the SECM with a Franz diffusion cell and a proton concentration gradient to accomplish proton diffusion from the lower part of the cell (donor reservoir) through the membrane to the upper part of the cell (acceptor reservoir). A similar utilization of the SECM/diffusion cell combination also enables the detection of cracks and holes when ferrocyanide is used as a redox mediator in the donor reservoir. Ferrocyanide cannot diffuse through an intact membrane. The detection of this species upon application of a positive bias at the SECM tip is hence an indicator for a crack or hole in the membrane. As a result, the combined utilization of ferrocyanide and protons as mediators should make it possible to distinguish between through-plane proton conductivity and mechanical membrane failures. To test this approach, a pristine membrane, a pristine membrane with pinhole and a membrane artificially aged using Fenton's reagent were examined.
2 Materials and methods
2.1 Membrane preparation
All investigated Nafion™ membranes of type N-115 (FuelCell Store) with 125 μm thickness were first activated by placing the membrane for 30 minutes under stirring in 80 °C hot ultrapure water (Milli-Q Integral 3 system, 18.3 MΩ). For the deactivation with Fenton's reagent, the membrane was afterwards placed for 8 hours in a beaker containing a solution consisting of 16 mg L−1 iron(II) ions (iron(II) chloride hydrate, extra pure, Carl Roth) in 30 wt% hydrogen peroxide (for analysis, Carl Roth). The solution was annealed to 70 °C. After 4 hours the solution was replaced by a fresh solution. Finally, the membrane was rinsed with ultrapure water. All membranes were stored in ultrapure water after the respective treatments before the measurements.2.2 Scanning electrochemical microscopy (SECM)
For SECM measurements, an M 470 scan station equipped with an SP-300 potentiostat (all from BioLogic) were used. The working electrode was a Pt-wire ultra-microelectrode (UME) with 25 μm diameter, the reference electrode an Ag/AgCl electrode, and the counter electrode a platinum sheet. The SECM measurements were performed using a Franz diffusion cell (PermeGear) in direct current (DC) SECM mode. For the through-plane proton conductivity experiment, the lower part of the cell (donor reservoir) was filled with 0.01 M sulfuric acid (for analysis, Bernd Kraft) and the upper part of the cell (acceptor reservoir) was filled with pH 7 buffer solution (Merck). The membranes were placed between the upper and lower part of the cell and the whole cell was finally screwed together using a cell clamp. The electrodes for the SECM measurement were then positioned in the upper part of the cell. Before the start of the area scan, linear sweep voltammograms were recorded in the potential range between 0 and −1.3 V with a sweep rate of 100 mV s−1. For the area scan, the potential of the electrode was set to −0.5 V. The scan velocity was 100 μm s−1 with a step size of 50 μm.For the detection of pinholes and cracks, the lower part of the cell was filled with 0.1 M potassium ferrocyanide (for analysis, Carl Roth) and 0.1 M potassium chloride (for analysis, Carl Roth) solution and the upper part was filled with 0.1 M potassium chloride solution. Before the start of the area scan, cyclic voltammograms were recorded in the potential range between +0.7 and −0.5 V with a sweep rate of 10 mV s−1. For the area scan, the tip potential was set to +0.5 V. The scan velocity was 100 μm s−1 with a step size of 50 μm.
2.3 Ion exchange capacity (IEC)
First, the membranes were immersed in 0.5 M sulfuric acid at 70 °C for 8 hours. Then, all membranes were placed in a saturated sodium chloride solution and heated to 80 °C for 8 hours. The solution was then titrated with 0.02 M NaOH (for analysis, Carl Roth) solution. Afterwards, the membranes were dried at 72 °C for 8 hours and weighted to calculate the IEC.2.4 Attenuated total reflection – infrared (ATR-IR) spectroscopy
First, the investigated membranes were dried for 8 hours at 72 °C in a muffle furnace (Nabertherm, B410). ATR-IR spectra were measured with a Nicolet 6700 (Thermo Scientific) spectrometer using a diamond crystal. The spectra were normalized to the peak at 1058 cm−1 wavenumbers.2.5 Scanning electron microscopy (SEM)
First, the investigated membranes were dried for 8 hours at 72 °C in a muffle furnace (Nabertherm, B410). Then, the samples were sputtered (Quorum, Q 150R ES plus) with gold as sputtering target and measured using a Jeol JCM-6000 SEM.3 Results and discussion
3.1 Combination of DC-SECM with a Franz diffusion cell
The measurement of the through-plane proton conductivity and the detection of cracks or holes in polymer electrolyte membranes is based on the combination of DC-SECM with a Franz diffusion cell. The principal assembly of such a diffusion cell is shown in Fig. 1. The Franz diffusion cell, or simply Franz cell, is an apparatus typically used for testing the diffusion (or release) of active ingredients through (or by) a membrane. It consists of a donor reservoir and an acceptor reservoir which are separated by the membrane. The donor chamber can contain an active ingredient that can diffuse through the membrane into the acceptor chamber.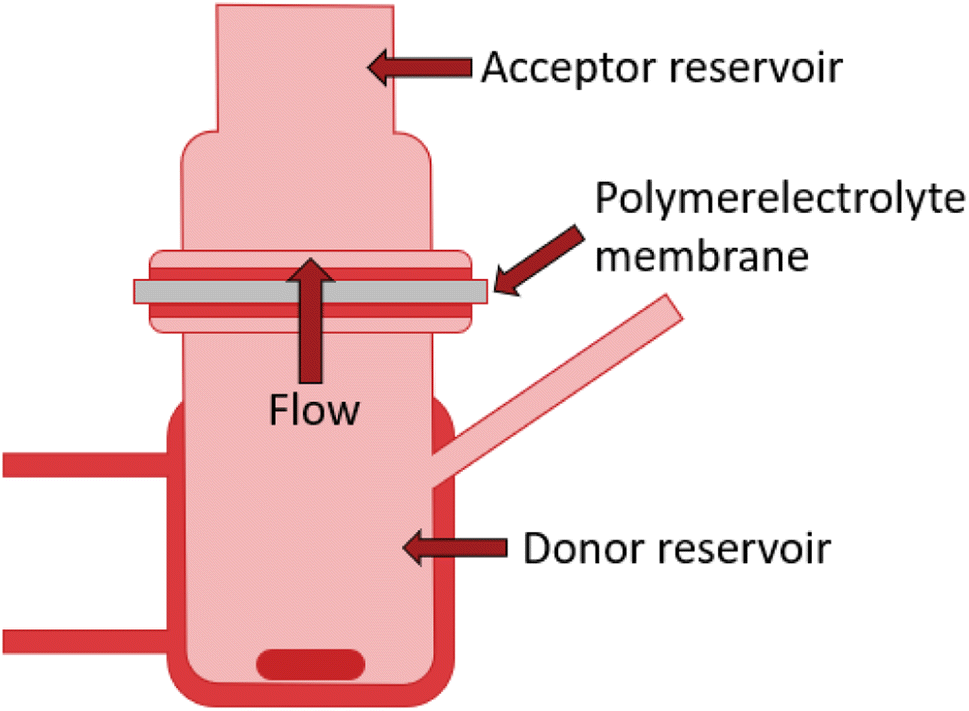 | ||
| Fig. 1 Principle assembly of a Franz diffusion cell used for the SECM investigation of polymer electrolyte membranes. | ||
In this work, the donor reservoir contains a redox mediator, which can diffuse through the to be tested polymer electrolyte membrane into the acceptor reservoir with a standard solution. By using DC-SECM, the current flow at a set tip potential above the membrane depends on the amount of redox mediator that can diffuse through the membrane at the specific local position of the SECM tip. With this approach, we aimed to measure the diffusion of protons from the donor reservoir containing sulfuric acid into the acceptor reservoir containing a pH 7 buffer solution through the membrane, i.e. the through-plane proton conductivity. If a sufficient cathodic potential is applied at the SECM tip, the tip current should increase while approaching the membrane (positive feedback28) due to the reduction of protons to hydrogen (Fig. 3 black curve). The magnitude of this signal could hence be interpreted as a measure for the through-plane proton conductivity. However, if the membrane contains cracks or holes, the protons will directly flow through these holes and also induce a high current and positive feedback at the SECM tip as schematically shown in Fig. 2a. This approach alone can therefore not discriminate between a high proton conductivity and a broken membrane structure, as shown by the comparable approach curves over an intact and a pierced membrane (Fig. 3).
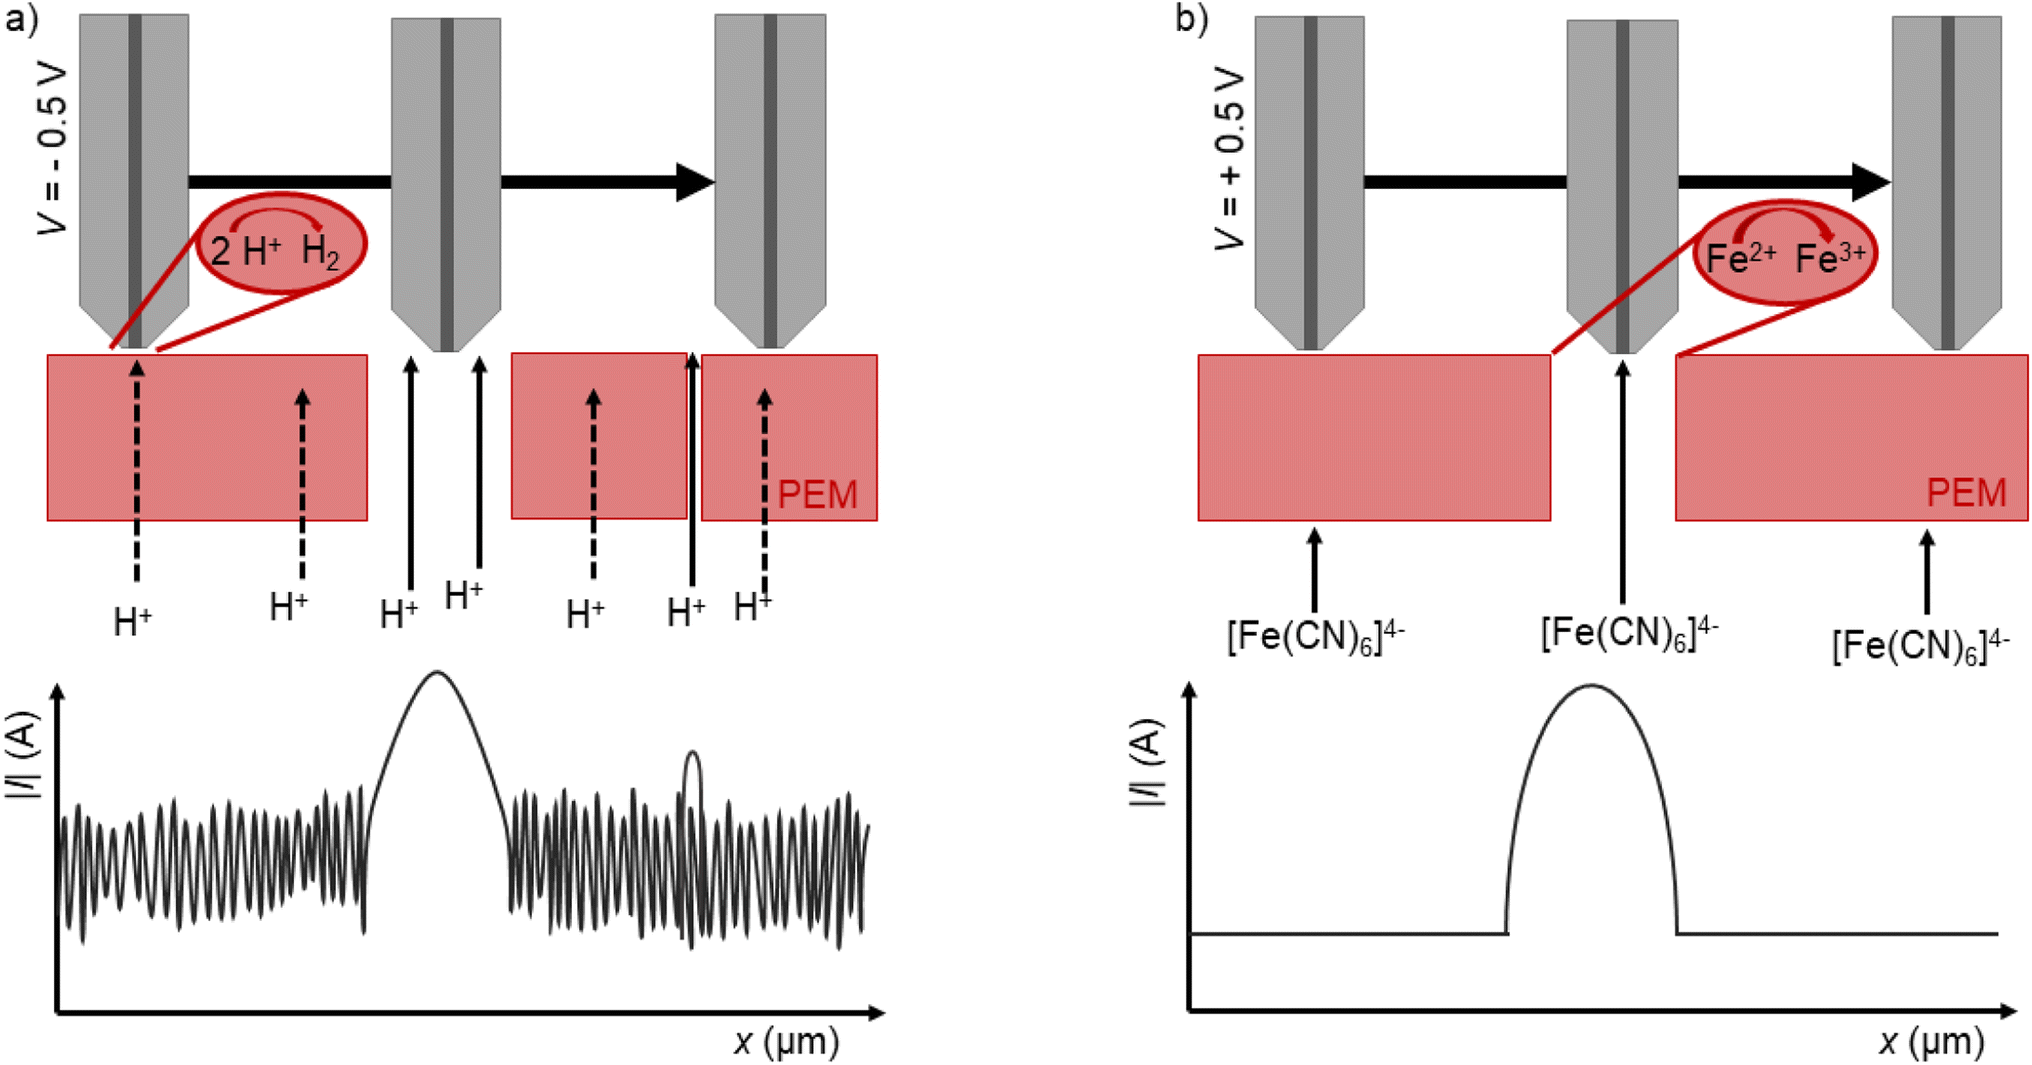 | ||
| Fig. 2 Schematic representation of the two applied SECM measurement methods: (a) determination of the through-plane proton conductivity with protons as redox mediator. (b) Detection of cracks and holes with [Fe(CN)6]4− as redox mediator. | ||
 | ||
| Fig. 3 Approach curves for the Franz cell/DC-SECM measurement with protons as redox mediator (for proton conductivity measurements) over the pristine membrane (black curve) and over the pierced pinhole (red curve). | ||
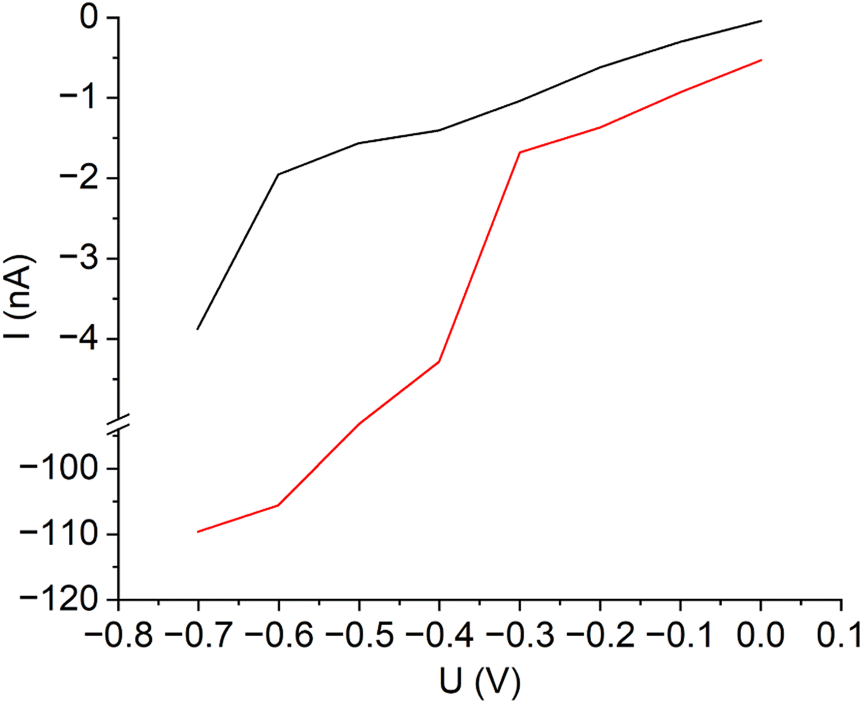
In order to detect the actual presence of holes and cracks, we applied a second complementary method. Now, the donor reservoir in the Franz cell contains as redox mediator ferrocyanide. It is assumed that this metal complex cannot diffuse through the intact membrane. If the SECM tip is set at a sufficient anodic potential, the tip current above a pristine membrane without holes should decrease while approaching the sample surface. This is called negative feedback, since the redox mediator cannot diffuse through the intact membrane and because the Nafion™ membrane is an electrical insulator.29,30 However, if there are holes or cracks in the membrane, the redox mediator can directly diffuse through these holes into the acceptor reservoir. If the working electrode now scans over the hole, the redox mediator gets oxidized at the electrode and a positive feedback is measured (Fig. 2b). For this approach, it is important that a negative feedback is measured above the intact membrane and a positive feedback above the hole. The approach curves in Fig. 4 cleary show, how a pristine and a pierced membrane can be distinguished with this approach. Since our goal is to characterize the radical-induced deactivation of polymer electrolyte membranes, a combination of the two presented SECM methods should allow the discrimination between the degeneration of acidic side chains or of the fluoropolymeric backbone of the membrane. Due to the opposite potentials needed for the detection of the two different redox mediators, a cross-talk between these two species can be also excluded.
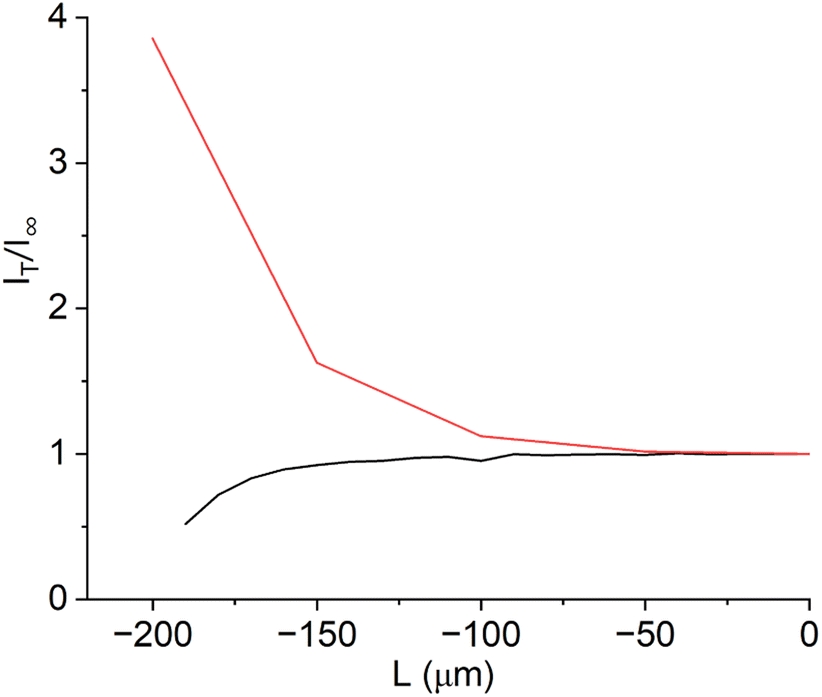 | ||
| Fig. 4 Approach curves for the Franz cell/DC-SECM measurement with ferrocyanide as redox mediator (for hole detection) over the pristine membrane (black curve) and over the pierced pinhole (red curve). | ||
3.2 Franz cell/DC-SECM investigations of pristine and aged polymer electrolyte membranes
First, linear sweep (LSV) and cyclic voltammograms (CV) were recorded to select suitable potentials for the redox mediators (Fig. 5). The CV for ferrocyanide shows a clear increase in current from 0.2 V on. In order to be within the diffusion-limited range, a potential of 0.5 V was chosen for the later SECM measurements. In comparison, the CV of the acceptor potassium chloride solution only shows a very small current at 0.5 V (Fig. 5). Thus, a significant increase in current should be visible when the redox mediator ferrocyanide can diffuse (through a hole) to the tip at a potential of 0.5 V.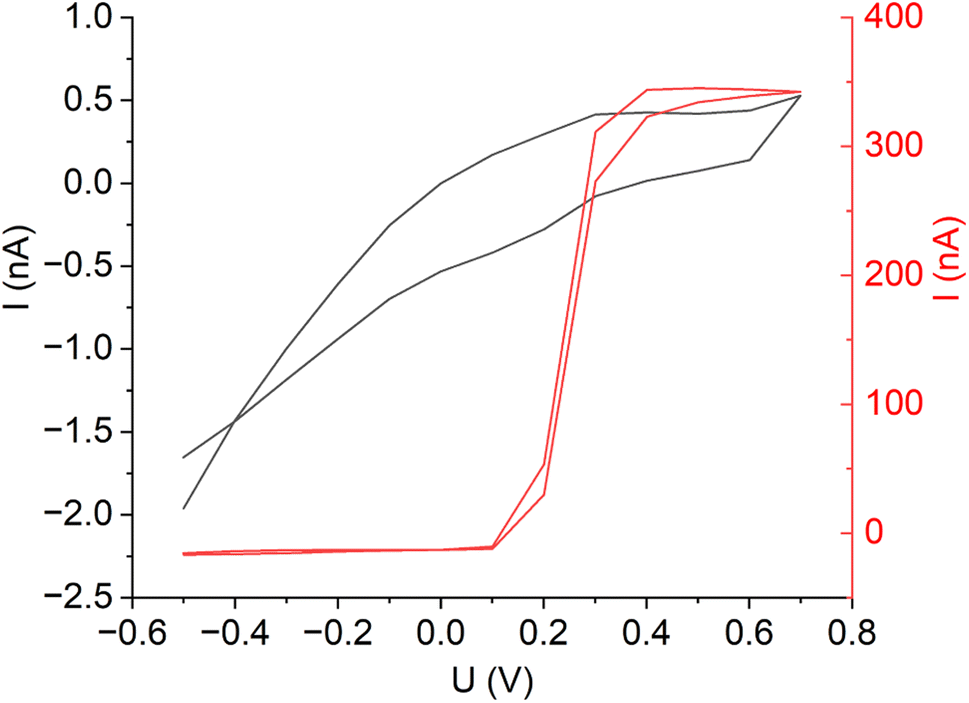 | ||
| Fig. 5 Cyclic voltammograms of 0.1 M ferrocyanide solution (red curve) and of 0.1 M potassium chloride solution (black curve) for the determination of the optimum SECM tip potential. | ||
In a next step, it was determined whether the redox mediator ferrocyanide can diffuse through an intact membrane, i.e. without cracks or holes. For this purpose, CVs were measured in a Franz cell, where a pristine Nafion™ membrane separated the donor reservoir from the acceptor reservoir. Fig. 6 shows the trend of the CVs over a time of 5 hours. Obviously, no increase in current was measurable in the oxidation range of ferrocyanide. It can therefore be concluded that the diffusion of ferrocyanide through the intact membrane can be neglected. The approximate measurement duration for a typical Franz cell/DC-SECM sample scan including preparation of the cell is about two hours. The long-term test therefore ensures that ferrocyanide does not diffuse through the intact membrane during the entire measurement period. The fact that the redox mediator cannot diffuse through the intact membrane is essential for the functionality of the experiment. If ferrocyanide could diffuse through the undamaged membrane, the intact membrane could no longer be distinguished from cracks and holes, as an increase in current would be measurable across the intact membrane (positive feedback).
 | ||
| Fig. 6 Cyclic voltammograms of the potassium chloride acceptor solution in a Franz diffusion cell containing a pristine Nafion™ membrane and ferrocyanide solution in the donor reservoir in a longterm diffusion test, recorded after the indicated times (in minutes). | ||
As for the measurement of the through-plane proton conduction, LSVs were recorded from both the donor and acceptor solutions (Fig. 7). The LSV of the acceptor pH 7 buffer solution illustrates an increase in negative current at potentials below −0.65 V, which is due to proton reduction. The LSV of the sulfuric acid donor solution, on the other hand, shows a significant increase in negative current already at potentials below −0.3 V. To ensure that the difference in current between the curves is large enough and that no bubble formation occurs at the working electrode, a potential of −0.5 V was chosen for the later SECM measurements.
 | ||
| Fig. 7 Linear sweep voltammograms of 0.01 M sulfuric acid (red curve) and of the pH = 7 buffer solution (black curve) for the determination of the optimum SECM tip potential. | ||
To prove the functional principle of this novel approach, the method was tested with a pristine Nafion™ membrane into which a small hole was drilled with a needle. This membrane should be characterized by a high proton conductivity over the intact area and a very high proton diffusion at the location of the hole. In Fig. 8a the area scan of the Franz cell/DC-SECM measurement using protons as redox mediator is shown. It can be clearly seen that at position y = 250 μm, x = 500 μm the negative current increased by more than four times. The increase in the negative current is due to the unhindered diffusion of the protons through the hole. As a result, more protons are reduced to hydrogen at the working electrode compared to the intact membrane, so the maximum current is measured at this position. In the immediate vicinity of the hole, the current is also higher, since the increased diffusion through the hole results in a higher proton concentration there. Moreover, a second region at y = −1000 μm, x = 0–200 μm is noticeable where the proton diffusion is increased. Since the rest of the membrane is supposed to be intact, the increased current could be ascribed to a higher concentration of acid groups.
 | ||
| Fig. 8 DC-SECM area scans of a membrane with pierced pinhole (a) with protons as redox mediator, (b) with ferrocyanide as redox mediator. | ||
The same membrane was also studied by the second approach using ferrocyanide as donor solution. The respective area scan is depicted in Fig. 8b. Consistent with the measurement of the proton conductivity, a current maximum is measured at position y = 250 μm, x = 500 μm. Through the pierced hole, the redox mediator can diffuse into the acceptor solution and thus give a positive feedback at the working electrode, because ferrocyanide gets oxidized at the polarized working electrode. Due to the ongoing diffusion of the redox mediator through the hole, the boundaries around the hole are blurred.
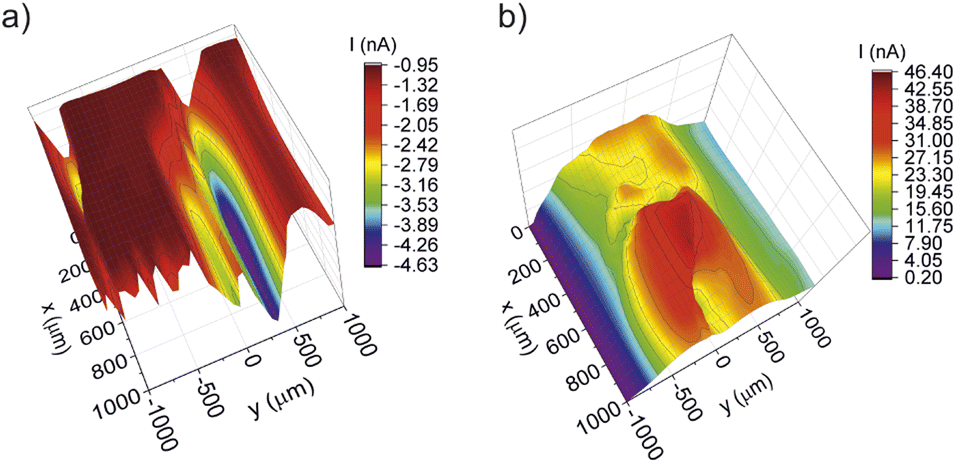
Finally, the Franz cell/DC-SECM approach was tested with a Nafion™ membrane deactivated by Fenton's reagent in order to simulate a radical attack as typically observed for membrane aging in hydrogen fuel cells and water electrolyzers. It is well known that the Fenton reaction produces radicals that attack both main and side chains of the polymer structure.31 As a consequence, areas of relatively inhomogeneous proton conductivity should be measurable due to the radical attack on the sulfonic acid groups. The heavy reaction which results in the formation of gas bubbles is typically characterized by a very inhomogeneous deactivation of the membrane. In addition, the radicals also attack the C–F bonds of the polymer structure, which can lead to the formation of holes and cracks. The DC-SECM area scan depicted in Fig. 9a shows that the through-plane proton conductivity as measured with protons as redox mediators varies strongly over the surface. Particularly noticeable is the area between y = 0–500 μm and x = 0–2500 μm. Here, the proton diffusion is largest relative to the rest of the surface and reaches very high negative currents at y = 250–500 μm in two points at about x = 500 μm and x = 1500 μm, respectively. A very broad plateau of high negative currents is also observable at y = 0–250 μm. Moreover, proton diffusion is increased at the locations −500 to −250 μm in y-direction and at 0–1000 and 2000–2500 μm in x-direction. However, with this measurement alone it cannot be concluded if this is due to the heterogeneous distribution of acidic sulfonate groups or due to the presence of holes and cracks.
 | ||
| Fig. 9 DC-SECM area scans of a membrane aged with Fenton's reagent (a) with protons as redox mediator, (b) with ferrocyanide as redox mediator. | ||
The DC-SECM area scan in Fig. 9b shows the results of the respective measurement of the membrane treated with Fenton's reagent while using ferrocyanide as redox mediator. In this figure there are two prominent maxima at y = 250–500 μm with current peaks of about 1.5 nA at about x = 500 μm and x = 1500 μm. Furthermore, a rather broad plateau of high positive currents can be observed at y = 0–250 μm. Since this method is sensitive for the presence of cracks or holes and since diffusion through the intact membrane could be excluded, these peaks can be attributed to holes in the membrane. A comparison of the two methods for examining the membrane aged with Fenton's reagent shows that both a higher proton diffusion and a higher diffusion of the redox mediator ferrocyanide occur roughly in the location between y = 0–500 μm and x = 0–2500 μm. The two SECM area scans fit in this area nearly perfectly together. This leads to the conclusion that this is an area with many cracks and holes. The holes appear to be smaller than the drilled hole in the pristine membrane examined before, since the measured currents are significantly smaller.
It is also worth mentioning that the increased negative current in the range −500 to 0 μm (y-direction) in Fig. 9a can be attributed to an increased number of acid groups, as the ferrocyanide measurement (Fig. 9b) showed no increased current at this specific point, i.e. no oxidation of the redox mediator took place. Hence, a crack or hole in this region can be excluded and the high positive proton feedback can be ascribed to a relatively high density and strength of acid groups at this site.
To make this even clearer, the two area scans of the approaches after Fenton deactivation were normalized to the respective currents at coordinates x = 750 μm and y = 500 μm, since Fig. 9b indicates that there is a hole or crack at this position. The normalized scans were subtracted from each other to obtain the difference image shown in Fig. 10. As a result, the direct influence of cracks and holes on proton diffusion through the membrane has been eliminated and the now observed local differences do directly reflect changes in proton conduction due to the different density and strength of acidic groups in the membrane. It can be seen that the area between y = −250 μm to −500 μm differs strongly from the other parts of the membrane exhibiting a significantly higher proton conductivity. A very likely explanation is that the acidic groups at the areas with the strongest radical attacks, i.e. close to the holes, were damaged preferentially, whereas the proton conductivity farther away from these attacks is still rather high due to less damaged acidic groups. However, this inhomogeneous distribution of acidic groups would likely have a negative impact on the function of a PEMWE or PEMFC, as proton and water transport would be limited to the highly proton conductive parts of the membrane (and – undesirably – to the holes), while the other parts with lower acidity would become ineffective, reducing the overall performance of the system. In general, with this difference image the heterogeneous proton conductivity induced by Fenton deactivation can be visualized beyond hole formation, proving the additional value of this novel Franz cell/DC-SECM methodology.
 | ||
| Fig. 10 Absolute difference image of both DC-SECM area scans (i.e. with protons and ferrocyanide as redox mediator) after the degradation of the membrane with Fenton's reagent. | ||
3.3 SEM investigation of pristine and aged polymer electrolyte membranes
All investigated membranes were examined with SEM in order to investigate their morphology. As a result, the surface of the pristine membrane (Fig. 11a) shows no obvious bubbles, cracks, holes or other irregularities. In the SEM image of the pristine membrane pierced with a needle, the pinhole with a length of approximately 500 μm can be clearly recognized (Fig. 11b). As for the membrane treated with Fenton's reagent, the surface now shows a large number of bubbles, some of which are relatively large and have a diameter of approximately 1 mm. Moreover, some of the bubbles have ruptured forming cracks or holes (Fig. 11e and f). The radical attack was apparently very effective, since also a larger crack was created that runs through the entire membrane (Fig. 11c). Overall, the SEM examinations clearly proof the formation of cracks or holes and thus also confirm the results of the Franz cell/DC-SECM measurements.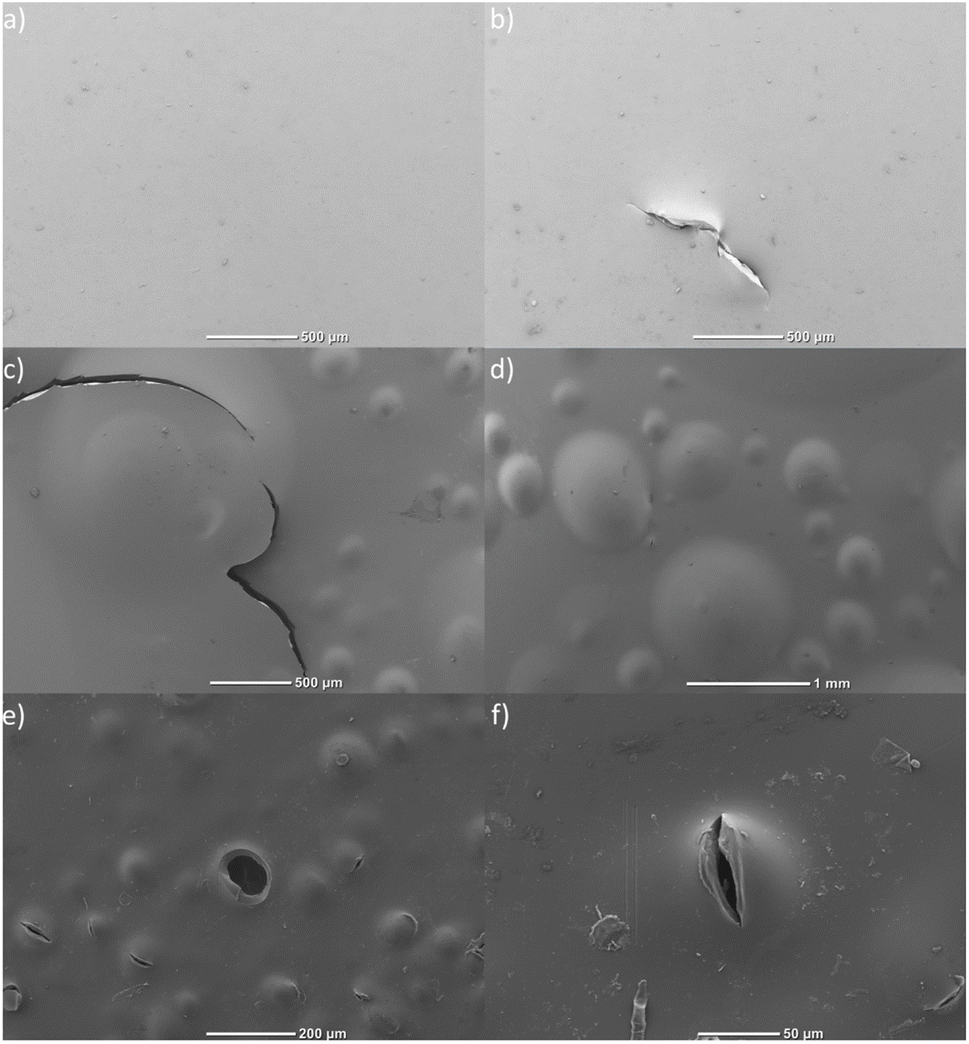 | ||
| Fig. 11 SEM images of (a) the pristine membrane, (b) the pristine membrane with artificial pinhole, and (c)–(f) of the membrane aged with Fenton's reagent. | ||
3.4 IEC determination of pristine and aged polymer electrolyte membranes
The ion exchange capacity (IEC) is a frequently used measure to quantitatively assess the proton conductivity of polymer electrolyte membranes. We therefore determined the IEC of the pristine membrane and of the membrane treated with Fenton's reagent in order to obtain an indication of a reduced number of acid groups due to the radical attack. However, we obtained for both membranes the same IEC of 0.91 meq. g−1. The degradation of the sulfonic acid groups could hence not be confirmed by this method. Regarding the IEC after Fenton deactivation, Hongsirikarn et al. have already mentioned contradictory results in the literature.32 They speculated that especially the treatment before the determination of the IEC has an influence on the result. They also figured out that despite the same IEC before and after Fenton deactivation, a decrease in the peak intensity associated with sulfonate acid groups was visible in the FT-IR spectra. It was concluded that the degradation of the Nafion™ membrane at the side chains leads to the formation of carboxylic acid end groups32,33 and carbonyl functional groups.32,34 Subsequently, these new acidic groups could be replaced by sulfonate groups during the pretreatment with sulfuric acid to prepare the IEC measurements.32,353.5 ATR-IR spectroscopy of pristine and aged polymer electrolyte membranes
In order to analyze the predicted deactivation of the membrane by the Fenton's reagent with another independent spectroscopic method, the membranes were examined using ATR-IR spectroscopy. ATR-IR spectra of the pristine and of the aged membrane are shown in Fig. 12. The spectra were normalized to the peak at 1058 cm−1. The two most intense peaks at 1150 cm−1 and 1213 cm−1 can be assigned to the antisymmetric stretching mode of the C–F bonds. The symmetric stretching mode of SO−3 corresponds to the peak at 1058 cm−1, while the double peak at 978 cm−1 and 983 cm−1 represents the symmetric stretching mode of the C–O–C groups.31,36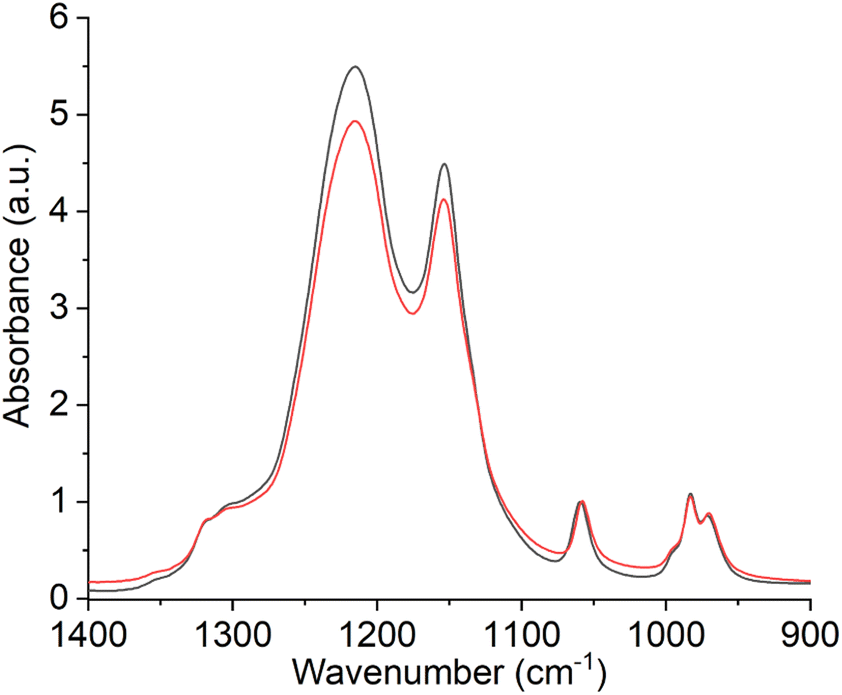 | ||
| Fig. 12 ATR-IR spectra of a pristine (red curve) and Fenton (black curve) deactivated Nafion™ membrane. The spectra were normalized to the respective peak at 1058 cm−1. | ||
When comparing the spectra of the fresh and the degraded membrane, it is noticeable that the relative intensity of the C–F peaks is higher after the Fenton treatment. Similar observations were made by Teixeira et al. It was concluded that the side chains are more affected by aging than the C–F bonds.3 The severe degradation of the SO−3 groups by the Fenton reaction has also been demonstrated in our previous work.27 In this study, electrical impedance spectroscopy was used to show that the proton conductivity of the membrane was lower after the Fenton treatment as compared to the pristine membrane.
4 Conclusion
A spatially resolved method based on SECM was developed to investigate and differentiate the two important radical-induced aging phenomena of polymer electrolyte membranes – reduction of proton conductivity and formation of holes and cracks. This was achieved by combining DC-SECM with a Franz diffusion cell and the use of ferrocyanide and protons (sulphuric acid), respectively, as redox mediators. This working principle could be exemplarily shown by the investigation of a pristine Nafion™ membrane, a pristine Nafion™ membrane with pierced hole and a Nafion™ membrane deactivated with the Fenton reagent. The artificial hole induced both an increased through-plane proton diffusion and an increased diffusion of the ferrocyanide ion, respectively.As for the measurement of the membrane treated with Fenton's reagent to simulate the attack with radicals, it could be proven that the proton conduction and hence likely the sulfonate groups are distributed considerably more inhomogeneously than in the pristine membrane. This can be attributed to the radical attack on the SO−3 groups, as this assumption is also confirmed by the ATR-IR measurement as a decrease in the corresponding relative peak intensity associated with this group. Overall, however, due to the constant proton diffusion through small holes in the membranes, the assignment of the SECM current to the abundance of acid groups is not unambiguous. The selective detection of cracks and holes with the redox mediator ferrocyanide therefore proved to be a very helpful complementary method to distinguish between altered proton conductivity due to radical-initialized deactivation of sulfonic acid groups and the formation of holes and cracks due to the radical attack of the fluorohydrocarbon backbone of the membrane.
SEM examinations clearly confirmed the formation of holes and cracks as a result of the radical attack of the main chains. In addition, the relative decrease in ATR-IR peak intensities related to sulfonate groups support the attack of the side chains. In summary, we could prove that with our new Franz cell/DC-SECM approach the aging and degeneration of polymer electrolyte membranes can be studied and different aging mechanisms can be visualized with rather high spatial resolution. The spatial resolution in this work can be further improved, for example, by using a flow-through cell. Since the protons accumulate in this setting due to the continuous diffusion, the pH value of the acceptor solution changes and the measurement is strongly time-dependent. Therefore, a lower resolution was chosen due to the shorter measurement duration. If, on the other hand, the acceptor solution is continuously exchanged, the measurement time has no longer any impact on the measurement and the resolution can easily be reduced to a few micrometers. In principle, a resolution in the nanometer range can also be achieved by using suitable working electrodes, so that even the smallest changes can be made visible. The sensitivity in detecting aging phenomena proved to be very high compared to routine measurement methods such as the determination of the IEC by titration. This method can hence accelerate the development of more robust and sustainable membranes that are urgently needed for the new generation of better fuel cells and electrolyzers with longer lifetimes.
Future work will focus on investigating complete membrane electrode assemblies (MEA) using both approaches. The advantage here would be that the acid groups and the holes can be investigated without having to separate the individual MEA layers from each other and thus damaging the MEA. This would offer the possibility of a non-destructive method that can detect spatial changes in the acid groups and the formation of cracks and holes. Other common methods that can also be used for this task, such as SEM-EDX and variants of AFM, have the disadvantage that either the different layers of the MEA have to be separated for the measurement or that entire MEAs with their sample size of several square centimetres might be difficult to be analyzed. With the Franz cell/SECM combination, larger samples such as entire MEAs can be examined with high local resolution.
Author contributions
S. T. conceived and conducted the experiments, M. E. and S. T. analysed the results. M. E. and S. T. wrote the main manuscript text, S. T. prepared all figures. All authors reviewed the manuscript.Conflicts of interest
There are no conflicts to declare.Acknowledgements
The presented work is part of the project “Smart Monitoring of Aging and Regeneration of Truck H2 Fuel Cells with Neuronal Networks and Impedance Tomography (SMART-H2)” funded by the German Federal Ministry of Education and Research (Fkz: 13FH549KX0). S. T. acknowledges financial support from the BayWISS Joint Academic Partnership Ressource Efficiency and Materials. The authors thank Dominik Eitel for supporting the SEM measurements and Roland Gross (both from Nuremberg Insitute of Technology) for supporting the ATR-IR measurements.References
- X.-Z. Yuan, H. Li, S. Zhang, J. Martin and H. Wang, J. Power Sources, 2011, 196, 9107–9116 CrossRef CAS.
- P. Frühwirt, A. Kregar, J. T. Törring, T. Katrašnik and G. Gescheidt, Phys. Chem. Chem. Phys., 2020, 22, 5647–5666 RSC.
- F. C. Teixeira, A. P. Teixeira and C. Rangel, Int. J. Hydrogen Energy, 2023, 48, 37489–37499 CrossRef CAS.
- M. Zatoń, J. Rozière and D. J. Jones, Sustainable Energy Fuels, 2017, 1, 409–438 RSC.
- D. A. Cullen, K. Neyerlin, R. K. Ahluwalia, R. Mukundan, K. L. More, R. L. Borup, A. Z. Weber, D. J. Myers and A. Kusoglu, Nat. Energy, 2021, 6, 462–474 CrossRef CAS.
- A. Ajanovic and R. Haas, Int. J. Hydrogen Energy, 2021, 46, 10049–10058 CrossRef CAS.
- Y. Wang, D. F. Ruiz Diaz, K. S. Chen, Z. Wang and X. C. Adroher, Mater. Today, 2020, 32, 178–203 CrossRef CAS.
- L. Fan, Z. Tu and S. H. Chan, Energy Rep., 2021, 7, 8421–8446 CrossRef.
- J. Marcinkoski, R. Vijayagopal, J. Adams, B. James, J. Kopasz and R. Ahluwalia, DOE Advanced Truck Technologies: Subsection of the Electrified Powertrain Roadmap Technical Targets for Hydrogen-Fueled Long-Haul Tractor-Trailer Trucks, 2019 Search PubMed.
- R. L. Borup, K. L. More and D. J. Myers, FC-PAD: Fuel Cell Performance and Durability Consortium Update to USCAR Analysis of Toyota Mirai Components Provided by USCAR, 2018 Search PubMed.
- R. L. Borup, A. Kusoglu, K. C. Neyerlin, R. Mukundan, R. K. Ahluwalia, D. A. Cullen, K. L. More, A. Z. Weber and D. J. Myers, Curr. Opin. Electrochem., 2020, 21, 192–200 CrossRef CAS.
- Y. Honsho, M. Nagayama, J. Matsuda, K. Ito, K. Sasaki and A. Hayashi, J. Power Sources, 2023, 564, 232826 CrossRef CAS.
- Z. Zakaria and S. K. Kamarudin, Int. J. Energy Res., 2021, 45, 18337–18354 CrossRef CAS.
- H. A. Miller, K. Bouzek, J. Hnat, S. Loos, C. I. Bernäcker, T. Weißgärber, L. Röntzsch and J. Meier-Haack, Sustainable Energy Fuels, 2020, 4, 2114–2133 RSC.
- M. Di Virgilio, A. Basso Peressut, V. Arosio, A. Arrigoni, S. Latorrata and G. Dotelli, Clean Technol., 2023, 5, 74–93 CrossRef.
- H. Nguyen, J. Stiegeler, H. Liepold, C. Schwarz, S. Vierrath and M. Breitwieser, Energy Technol., 2023, 11, 2300202 CrossRef CAS.
- M. Adamski, N. Peressin and S. Holdcroft, Mater. Adv., 2021, 2, 4966–5005 RSC.
- S. Kundu, L. C. Simon and M. W. Fowler, Polym. Degrad. Stab., 2008, 93, 214–224 CrossRef CAS.
- J. Mitzel, J. Sanchez-Monreal, D. Garcia-Sanchez, P. Gazdzicki, M. Schulze, F. Häußler, J. Hunger, G. Schlumberger, E. Janicka, M. Mielniczek and L. Gawel, Fuel Cells, 2020, 20, 403–412 CrossRef CAS.
- K. Jiao, B. Zhou and P. Quan, J. Power Sources, 2006, 157, 226–243 CrossRef CAS.
- J. Mitzel, E. Gülzow, A. Kabza, J. Hunger, S. S. Araya, P. Piela, I. Alecha and G. Tsotridis, Int. J. Hydrogen Energy, 2016, 41, 21415–21426 CrossRef CAS.
- D. Polcari, P. Dauphin-Ducharme and J. Mauzeroll, Chem. Rev., 2016, 116, 13234–13278 CrossRef CAS PubMed.
- S. Ben Jadi, A. El Guerraf, E. Bazzaoui, R. Wang, J. Martins and M. Bazzaoui, J. Solid State Electrochem., 2019, 23, 2423–2433 CrossRef CAS.
- S. Ben Jadi, A. El Guerraf, A. Kiss, A. El Azrak, E. Bazzaoui, R. Wang, J. Martins and M. Bazzaoui, J. Solid State Electrochem., 2020, 24, 1551–1565 CrossRef CAS.
- W. Shi and L. A. Baker, RSC Adv., 2015, 5, 99284–99290 RSC.
- T. Kallio, C. Slevin, G. Sundholm, P. Holmlund and K. Kontturi, Electrochem. Commun., 2003, 5, 561–565 CrossRef CAS.
- S. Thiel, V. Seiß and M. Eichelbaum, 2022 International Workshop on Impedance Spectroscopy (IWIS), 2022, pp. 14–19 Search PubMed.
- J. Santana Rodríguez, J. Izquierdo and R. Souto, Coatings, 2022, 12, 637 CrossRef.
- D. Polcari, P. Dauphin-Ducharme and J. Mauzeroll, Chem. Rev., 2016, 116, 13234–13278 CrossRef CAS PubMed.
- P. Bertoncello, Energy Environ. Sci., 2010, 3, 1620–1633 RSC.
- T. Kinumoto, M. Inaba, Y. Nakayama, K. Ogata, R. Umebayashi, A. Tasaka, Y. Iriyama, T. Abe and Z. Ogumi, J. Power Sources, 2006, 158, 1222–1228 CrossRef CAS.
- K. Hongsirikarn, X. Mo, J. G. Goodwin and S. Creager, J. Power Sources, 2011, 196, 3060–3072 CrossRef CAS.
- T. Xie and C. A. Hayden, Polymer, 2007, 48, 5497–5506 CrossRef CAS.
- C. Chen, G. Levitin, D. W. Hess and T. F. Fuller, J. Power Sources, 2007, 169, 288–295 CrossRef CAS.
- M. A. Malik, Ind. Eng. Chem. Res., 2009, 48, 6961–6965 CrossRef CAS.
- A. Gruger, A. Régis, T. Schmatko and P. Colomban, Vib. Spectrosc., 2001, 26, 215 CrossRef CAS.
| This journal is © The Royal Society of Chemistry 2024 |