DOI:
10.1039/D4RA01049C
(Paper)
RSC Adv., 2024,
14, 11849-11861
Alkaline earth modified activated carbon supported Cu catalysts with enhanced selectivity in the hydrogenation of dimethyl oxalate to methyl glycolate
Received
10th February 2024
, Accepted 6th April 2024
First published on 12th April 2024
Abstract
In this work, the effect of alkaline earth metal modification on the catalytic performance of activated carbon supported Cu was investigated. The experimental results showed that the introduction of Ca and Sr improved the selectivity of methyl glycolate (MG) during hydrogenation of dimethyl oxalate (DMO) in gas phase. The optimal loading amount of Ca was 0.1 wt%, and under the optimal conditions (temperature 240 °C, pressure 2 MPa, hydrogen–ester ratio of 80, feedstock 15% DMO methanol solution, and WLHSVDMO = 0.9 h−1) the selectivity of MG was as high as 94%, and the conversion of DMO was 97%. The optimal loading of Sr was 0.2 wt% with MG selectivity up to 89% and DMO conversion of 98%. The results of catalyst characterization showed that both Ca and Sr modifications were beneficial to further reduce the particle size of Cu, improve the dispersion of Cu, increase the basicity of the catalyst, and improve the stable presence of Cu+ during the reaction process. Cu+ was beneficial to the stabilization of the MG species, in which Cu+ accounted for more in the Ca-modified catalysts Cu+/(Cu+ + Cu0) = 0.65, and in the Sr-modified ones Cu+/(Cu+ + Cu0) = 0.51. Therefore, both Ca and Sr modified catalysts showed improvement in the selectivity of MG.
1 Introduction
Methyl glycolate (MG), as an important chemical intermediate with rich functional groups, is of great value in the chemical synthesis field. Glycolic acid can be prepared by hydrolysis of MG, and polymerization of glycolic acid produces a new generation of biodegradable material – polyglycolic acid (PGA). MG can also be used to prepare dimethyl malonate. Besides that, MG is widely applied in paints, glues, detergents and food additives.1
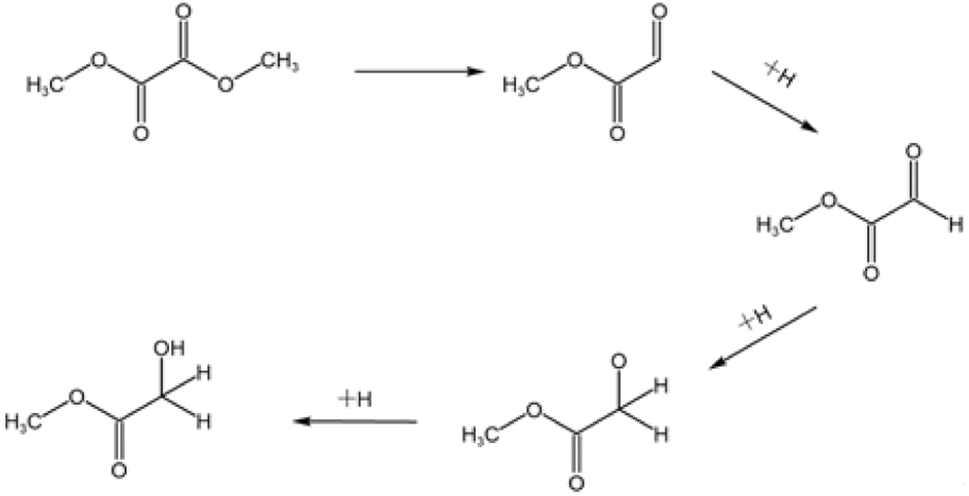
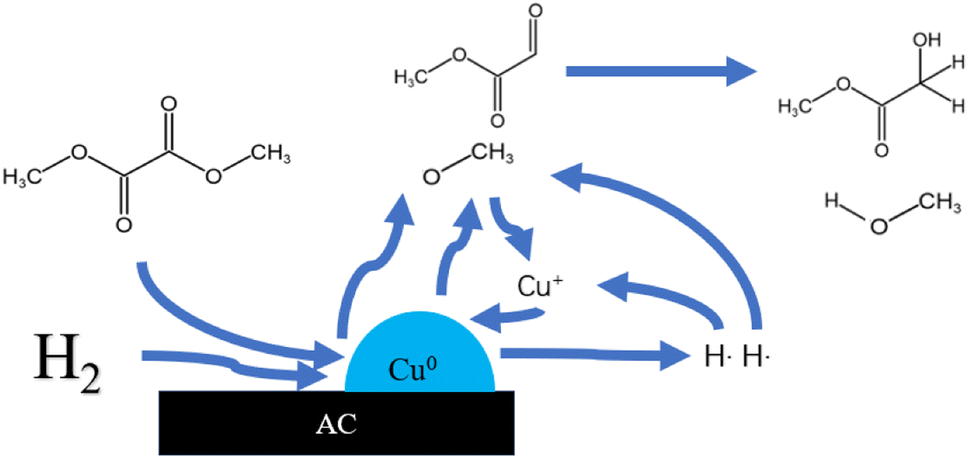
There are many methods for the synthesis of MG. Formic acid or formaldehyde coupled with methyl formate has the advantages of high conversion and easy separation, but the need to use a strong acid catalyst has many bad-points as corroding the reactor, heavy pollution and poor safety, which restricts its wide application. Even if the subsequent improvement, the use of solid acid catalyst to solve the problem of corrosive, its reaction pressure still needs 6 MPa. The chloroacetic acid hydrolysis method is easy to obtain raw materials, low cost and high yield, but also use the strong acid as reactant which is corrosive to the equipment.2 The formaldehyde carbonylation esterification method has low production cost and high yield, but the strict reaction conditions are demanding, the improved process of this method still needs 6 MPa of reaction pressure.3,4 The one-step synthesis method of glyoxal and methanol has mild reaction conditions and high product yield, but the toxicity and the high cost of the reactants make it difficult for industrial production.5 The dimethyl oxalate (DMO) hydrogenation method has many benefits such as easy obtaining of raw materials, simple reaction, mild reaction conditions.6 DMO can be obtained directly from syngas reaction, and the reaction process does not require high temperature and high pressure conditions. The syngas can be obtained from a wide range of sources, such as coal, natural gas and other fossil energy sources or renewable energy sources, such as biomass, reducing the consumption of energy and resources. So the syngas synthesis of MG via hydrogenation of DMO is a sustainable development method of converting non-fossil energy sources into high value-added products. And the reaction pressure is greatly reduced, basically around 2.5–3 MPa.9–14 Fig. 1 shows the reaction pathway of MG by gas-phase hydrogenation of DMO.7 The reaction requires only a simple hydrogenation to convert DMO into MG. It is well known that Cu-based catalysts are widely used for selective catalysis of carbon–oxygen bonding and are inactive for carbon–carbon bond cleavage. The key to the industrialization of this process lies in the development of high-performance catalysts. Fig. 2 is a schematic diagram of a possible principle for the hydrogenation of DMO to MG over Cu-based catalysts.8
 |
| | Fig. 1 Reaction pathway of MG by gas-phase hydrogenation of DMO. | |
 |
| | Fig. 2 Principle for the hydrogenation of dimethyl oxalate to MG over Cu-based catalysts. | |
In recent researches, the supported silver and copper were the main catalysts in hydrogenation of DMO to MG. The Ag-based catalyst has low catalytic activity for hydrogenation. Therefore, it can avoid the occurrence of by-products due to excessive hydrogenation to achieve high selectivity for MG. Ouyang9 et al. investigated an silica supported Ag catalyst with 90.2% MG yield in this reaction. Beside low conversion of DMO, the high cost of Ag also limits their industrialization as well as further development. Most of the currently studied Cu-based catalysts used silica as support, but the silica-supported catalyst was more prone to hydrogenation to ethylene glycol or ethanol during DMO hydrogenation. The MG selectivity was improved on the catalysts of Cu supported on activated carbon (AC),10 hydroxyapatite–graphite,11 ZrO2–SiO2,12 MgO,13 and Reduced graphene oxide14 in DMO hydrogenation. Huang15 et al. found that the MG selectivity reached 99.8% and the yield reached 83% in the DMO hydrogenation to MG after the Cu/SiO2 catalyst was modified with Na2SiO3. According to the characterization, the addition of Na2SiO3 caused the collapse of some micropores on the catalyst, while the mesoporous pores on the catalyst were retained. Larger pores could enable the generated MG to be quickly transferred to the outer surface, thus preventing further hydrogenation of MG to generate EG. Similarly, Abbas11 et al. prepared a catalyst with a novel structure using Cu species as the active component, transition metal (Fe, Ni, Co) as the additive, and HAP-G as the support for DMO hydrogenation. The results showed that the selectivity of Cu/HAP-G catalyst to MG can reach 94% at high copper content (20 wt%). It was found that HAP-G support has a unique composite structure containing a large pore size, which promotes the desorption of MG products from the catalyst surface and inhibits the subsequent deep hydrogenation. Therefore, Cu/HAP-G has better catalytic performance and higher MG selectivity. Cui10 et al. investigated the performance of AC supported Cu catalyst. The results showed that the surface of AC was rich in functional groups, and the catalyst undergoes reduction of Cu species and high dispersion of Cu species during the roasting process. The ratio between Cu0 and Cu+ species was balanced during the reaction. The best catalyst showed 83% DMO conversion and 92% MG selectivity, exhibiting as high catalytic selectivity to MG as that of silver catalysts.
The introduction of additives into Cu-based catalysts can adjust both the support-metal interactions and the ratio of Cu+ to Cu0 in the catalysts. Most researchers believe that the chemical state of Cu plays a key role in the hydrogenation process of DMO, and that Cu0 species dissociate and adsorb hydrogen molecules, whereas Cu+ species can act as an electrophilic reagent and an L-acid center to polarize and activate ester groups. They synergistically promote the hydrogenation of ester groups. Therefore, the suitable Cu+/Cu0 ratio and its synergistic effect determine the catalytic performance in hydrogenation of DMO. Wang12 et al. introduced ZrO2 into silica to increase the disperse of active Cu species, and the electron transfer between Zr and Cu could increase the Cu+ content, which improved the hydrogenation stability of the catalysts. Abbas11 et al. introduced ZrO2 into the supports of hydroxyapatite (HAP) and a composite type of graphite (G). The introduction of Ni increased the dual active center sites on the catalyst surface and also increased the concentration of Cu0 species, enhancing the mutual synergistic effect between Cu0 and Cu+. In the Cu/HAP/G catalyst with high Cu content (20 wt%), the selectivity of MG was 94%, and the introduction of Ni and Co increased the selectivity of MG to 95.1% and 99.3%, respectively.
In the hydrogenation of DMO to MG in gas-phase, an appropriate increase in the ratio of Cu+/Cu0 is beneficial to the generation of MG, and the above work shows that it is a feasible way to add metal additives to Cu-based catalysts to regulate the ratio of Cu+/Cu0 in the reaction to achieve the high selectivity of MG. Hao Y.16 et al. used hydrothermal method to prepare the single-atom Pt1-HAP catalyst for selective oxidation of C2–C4 polyols to corresponding primary hydroxy acids. It has remarked selectivity and stability due to the presence of single-atom Pt on HAP. This is because Ca precursor added during the preparation process, which forms a large amount of Ca2+ that can be replaced by partial positively charged Pt, thus maintaining a balance of charge and space structure. Therefore, the single-atom Pt can stably exist on HAP. It also shows that Ca can equally stabilize the presence of Cu. Considering the deactivation of Cu-based catalysts due to agglomeration sintering and other reasons17 and the special electron-donating ability of alkaline earth metals, alkaline earth metal additives was used for modification of Cu-based catalysts in order to improve the stability and selectivity of the catalyst. A series of Cu-based catalysts were prepared by urea-assisted precipitation and ammonia evaporation method using Cu as the active component, AC as the support, and alkaline earth metal as the additives. The effects of alkaline earth metal additives on the catalytic performance were investigated. The experimental results demonstrated that the introduction of alkaline-earth metals could effectively increase the stabilized amount of Cu+ present and significantly improve the selectivity of MG.
2 Experimental
2.1 Materials
Dimethyl oxalate (DMO, AR), methyl glycolate (MG, AR), ethylene glycol (EG, AR) were purchased from Shanghai Titan Technology Co., Ltd. Methanol (CH3OH, AR), copper nitrate trihydrate (Cu(NO3)2·3H2O, AR), calcium nitrate tetrahydrate (Ca(NO3)2·4H2O, AR), strontium nitrates (Sr(NO3)2, AR) were provided by Sinopharm Chemical Reagent Co., Ltd. Activated carbon (AC) was obtained from Shanghai Aladdin Biochemical Technology Co., Ltd. All other required drugs are from Shanghai Chuansai Technology Co., Ltd.
2.2 Catalyst preparation
Alkaline earth metal (Ca, Sr) modified Cu-based catalysts were prepared using urea-assisted precipitation by ammonia evaporation. Ca modification as an example, the specific steps are as follow. 5 g of activated carbon and 10 g of urea in a 250 ml three-necked flask, added 100 g of deionized water and stirred for 30 min at 25 °C. 1.51 g of Cu(NO3)·3H2O was dissolved into deionized water. Then, ammonia of 28% of mass fraction was added to the Cu(NO3)·3H2O solution until it became clarified. The formed copper–ammonia complex solution was stirred for 30 min with pH of 10–11. 0.07 g, 0.14 g, 0.42 g and 0.7 g of Ca(NO3)2·4H2O was then dissolved into deionized water. The clarified copper–ammonia solution and calcium nitrate solution was added together into the above three-necked flask at the temperature of 80 °C with stirring, and ammonia was evaporated until the pH of the solution was 6–7. The solid product was filtered at hot state and washed three times with deionized water, then dried in an oven at 80 °C for 12 h, and finally calcined in a muffle furnace under nitrogen atmosphere at 350 °C for 3 h. The catalyst was recorded as Ca–Cu/AC, wherein the number in front of the element represented the mass fraction of the metal loading, e.g., 0.1Ca–8Cu/AC represented a loading of Ca of 0.1 wt% and a loading of Cu of 8 wt%. The loaded amount of Ca was in the range of 0.05–0.5 wt%. The preparation method and recorded name of Sr modified catalyst were the same as the Ca catalyst. The loaded amount of Sr was in the range of 0.1–1 wt%. The catalysts of other additives were also made to be used for the reaction, and the preparation method and nomenclature were the same as above.
2.3 Catalytic tests
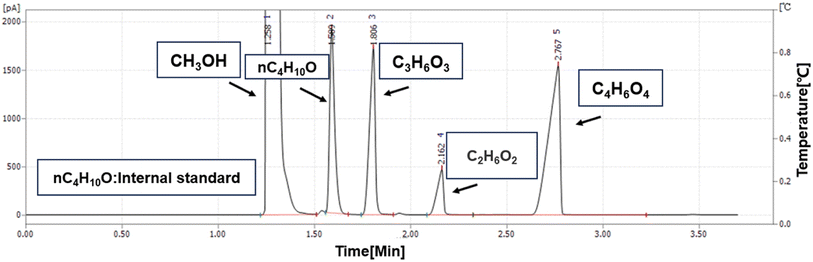
Selective hydrogenation of DMO to MG was carried out in a high-pressure fixed-bed reactor. 1.2 g of catalyst (40–60 mesh) was set into a tube reactor with the filling sequence of quartz sand (40–60 mesh)-catalyst-quartz sand. Prior to catalyst evaluation, the catalyst was reduced in 5% H2–95% N2 flow under atmospheric pressure at 350 °C for 4 h. After the reduction, the reactor was cooled down to the reaction temperature. The pressure was increased by a hydrogen cylinder. When the temperature and pressure reached the reaction conditions, the solution of 15% DMO in methanol was pumped into the reactor at a flow rate of 0.1 ml min−1 using a high-pressure advection pump. The use of methanol as a solvent was considered that methanol will be produced in the process of DMO hydrogenation. Methanol was chosen in order to avoid introducing new substances. On the other hand, it has been reported in the literature that during the hydrogenation of DMO to ethylene glycol, the acidic sites on the surface of the catalyst will promote the etherification of ethylene glycol in methanol solution, and the ethylene glycol product in this paper has low selectivity and fewer acidic sites on the surface of the catalyst.18 As shown in Fig. 3, no ethers appeared on the result of gas-chromatography.
 |
| | Fig. 3 GC chromatograms. | |
In addition, it has been pointed out that in the reaction of selective hydrogenation of unsaturated aldehydes C![[double bond, length as m-dash]](https://www.rsc.org/images/entities/char_e001.gif) O over Cu/MgO catalysts, ethanol as a solvent will cause Cu agglomeration and reduce the catalytic efficiency. In this experiment, although methanol and ethanol are similar in nature, there is no serious deactivation of the catalyst in this paper.19 Therefore, methanol as a solvent can dissolve the raw material without reacting with the reactants and affecting the product yield.
O over Cu/MgO catalysts, ethanol as a solvent will cause Cu agglomeration and reduce the catalytic efficiency. In this experiment, although methanol and ethanol are similar in nature, there is no serious deactivation of the catalyst in this paper.19 Therefore, methanol as a solvent can dissolve the raw material without reacting with the reactants and affecting the product yield.
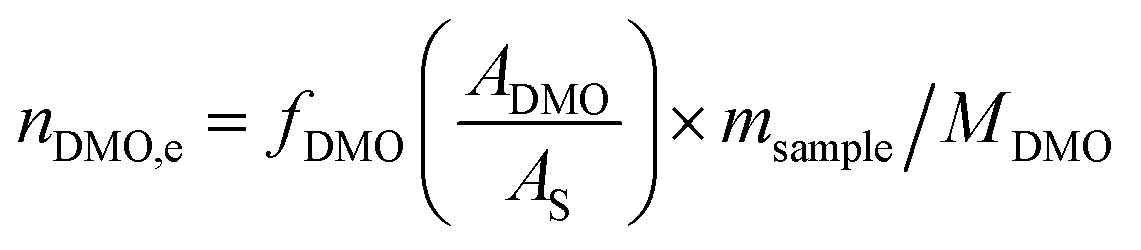
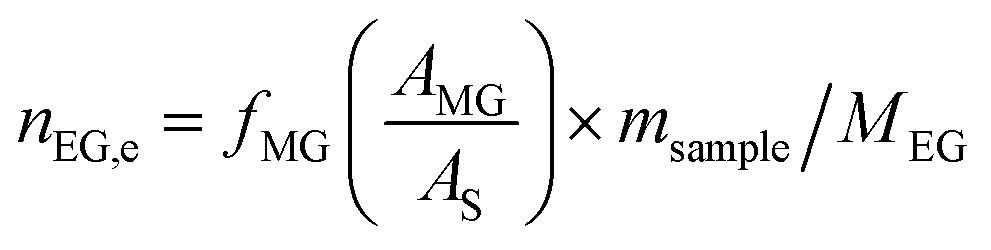
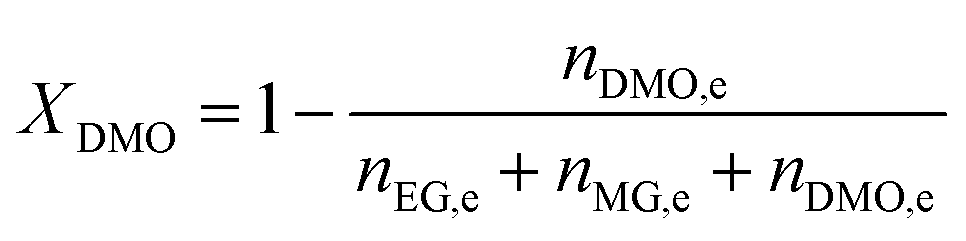
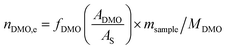
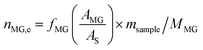
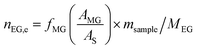
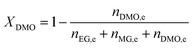
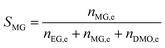
The catalyst evaluation conditions were as follows: reaction temperature of 240 °C, reaction pressure of 2.0 MPa, feedstock of 15% DMO methanol solution, WLHSVDMO = 0.9 h−1, hydroxyl ester ratio of 80, and catalyst loading of 1.2 g. The samples were taken once every 2 h, and quantitatively analyzed by GC2060 gas chromatography equipped with a DB-1701 column (size: 30 m × 0.53 mm × 0.5 μm). The DMO hydrogenation products were mainly MG and EG, in addition to a small amount of EtOH, 1,2-propanediol (1,2-PDO), 1,2-butanediol (1,2-BDO).20 During the pre-analysis of the reaction solution, only peaks of MG and EG were found on the GC chromatograms, as shown in Fig. 3. So MG and EG were used as the main products in this experiment. We also accounted for the total carbon before and after the reaction, and the carbon balance was calculated to be greater than 99%. The products were quantified by the internal standard method, and the formula was calculated as follows:
| |
 | (1) |
| |
 | (2) |
| |
 | (3) |
| |
 | (4) |
| |
 | (5) |
| |
 | (6) |
The meaning of the above symbols is as follows:
Ai: chromatographic peak area of component i, i= DMO, MG, EG.
As: chromatographic peak area of the internal standard
n-butanol.
fi (−): standard curve formulae involved in DMO hydrogenation reactions, i = DMO, MG, EG.
Mi: molar mass of component i, (g mol
−1), i = DMO, MG, EG.
ms: amount of internal standard added, (g).
sample: sample size, (g).
ni,e: mass fraction of component i in the reacted stock, i= DMO, MG, EG.
Xi: conversion rate of component i, i = DMO.
Si: selectivity of component i, i= MG, EG.
2.4 Catalyst characterization
2.4.1 X-ray diffraction (XRD). XRD was used to determine crystalline phases of the composites and the average particle sizes of Cu in the catalysts. It was carried out using a polycrystalline/D8 Advance type X-ray diffractometer manufactured by Bruker AXS, Germany, with a radiation source of Cu Kα1, a tube voltage of 40 kV, a tube current of 100 mA, a scanning range of 2θ = 10–80°, a scanning speed of 10° min−1 and a step size of 0.02° per step. Scherrer's formula was used to calculate the average particle sizes of Cu.
2.4.2 Transmission electron microscopy (TEM). The JEM-2100 high-resolution transmission electron microscope manufactured by JOEL Corporation of Japan was used with an operating voltage of 200 kV. After obtaining the corresponding TEM image, the particle size of the metal particles was counted by using Nano measurer analysis software.
2.4.3 Hydrogen temperature-programmed reduction (H2-TPR). H2-TPR was carried out on VDSorb-91i programmed temperature chemisorption instrument manufactured by Quzhou VODO Instrument Co. of China to determine the reducing properties of copper oxide in calcined catalysts. 0.05 g of sample was heated up to 100 °C and kept for 60 min under argon atmosphere to remove the surface impurities and moisture. After that, the temperature was cooled down to 40 °C. Then it was switched to a 10% H2/Ar with flow rate of 20 ml min−1, and the temperature was increased to 600 °C at 10 °C min−1 for TPR. The signal of H2 was detected by a thermal conduct detector.
2.4.4 Temperature-programmed desorption (TPD). TPD of ammonia and TPD of CO2 was used to test the acidity and alkalinity of the catalyst surface, respectively. These tests were performed on the same instrument as H2-TPR. 0.05 g of catalyst was first reduced by passing 10% H2/Ar mixture at 300 °C for 2 h and then cooled to room temperature in argon. Then 20% NH3/Ar or CO2/Ar was introduced until the sample was saturated with adsorption, and then switched to pure helium for 30 min to sweep out all the physically adsorbates. The temperature was then increased to 600 °C with a heating program of 10 °C min−1 to desorb the samples.
2.4.5 X-ray photoelectron spectroscopy (XPS). XPS was used to analyze and study the chemical states of Cu on the catalyst surface. ESCALAB 250Xi X-ray photoelectron spectroscopy manufactured in the UK was used with a standard AlKα as the source of ray with a resolution of >3 μm. C 1s (284.6 eV) was used as reference for charge correction.
3 Results and discussion
3.1 Catalytic activity and stability
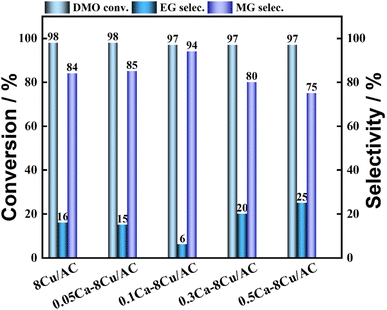
The effect of different metal modifications on catalytic property was investigated. The results are shown in Table 1. It indicated that the addition of Mn reduced the hydrogenation activity of the catalyst, and the conversion of DMO was only 31%. The introduction of La, Zn, V, W and Ca metal additives still maintained the high DMO conversion, but the selectivity to MG appeared to be decreased, where V and W modified catalysts were not calculated for MG and EG selectivity because of over hydrogenation to ethanol, among which the Ca metal additives showed the smallest reduction.
Table 1 Effect of catalyst with different metal on hydrogenation of DMOa
| Catalyst |
Conversion/% |
Selectivity/% |
| EG |
MG |
| Reaction conditions: T = 240 °C, P(H2) = 2.0 MPa, H2/DMO molar ratio = 80. WLHSVDMO = 0.9 h−1. |
| 8Cu/AC |
98 |
16 |
84 |
| 0. 5Mn–8Cu/AC |
31 |
14 |
86 |
| 0.5La–8Cu/AC |
98 |
43 |
57 |
| 0.5Zn–8Cu/AC |
98 |
37 |
63 |
| 0.5V–8Cu/AC |
100 |
— |
— |
| 0.5W–8Cu/AC |
100 |
— |
— |
| 0.5Ca–8Cu/AC |
97 |
25 |
75 |
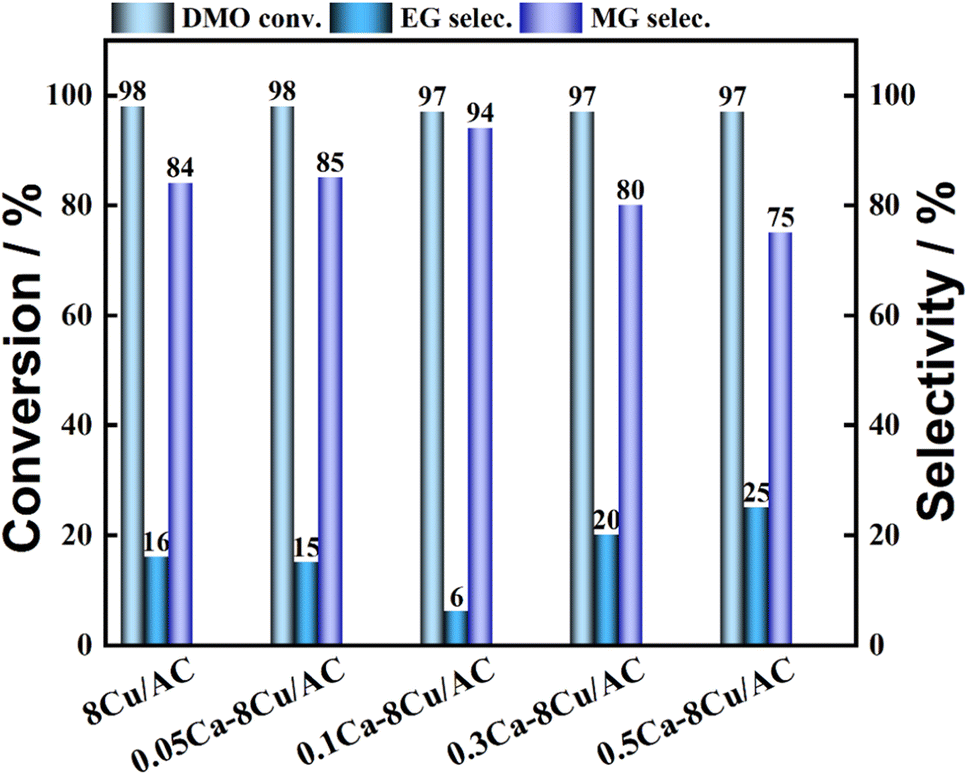
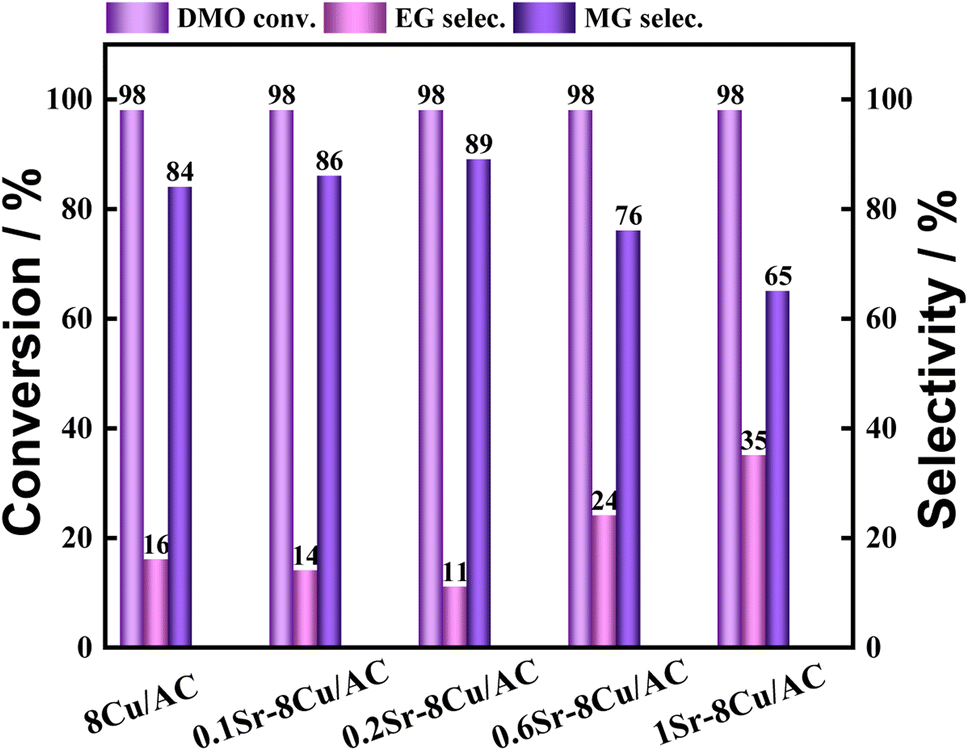
The loading amount of Ca was further investigated, and the experimental results are shown in Fig. 4. When a small amount of Ca was introduced, it was favorable for the production of MG. The highest selectivity of MG was 94% when the Ca loading was 0.1 wt%. When the Ca loading amount continued to increase, the selectivity of MG began to decrease. The selectivity of MG showed a volcano pattern with the increase of Ca loading. The effect of Sr, which is located in the same main group as Ca, as an additive on the catalytic activity of the catalyst was also investigated (shown in Fig. 5). The results showed that the highest selectivity of MG was 89% when the loading of Sr was 0.2 wt%. Interestingly, the hydrogenation effect of 0.1Sr–8Cu/AC catalyst was approximate to the hydrogenation activity of 0.05Ca–8Cu/AC catalyst. It can be approximated that the same amount of base is introduced when loading equal molar amounts of metals, and the 0.1Sr–8Cu/AC catalyst and the 0.05Ca–8Cu/AC catalyst can be regarded as introducing similar amounts of base (MSr = 87 and MCa = 40), so we speculate that the Sr-modified catalysts can obtain the same as the Ca-modified catalysts when the same amount of base is introduced as the Ca catalytic activity. Several other sets of experimental data show that although the catalytic activity pattern of Sr–Cu/AC catalysts is similar to that of Ca–Cu/AC catalysts, the overall selectivity to MG is poorer than that of Ca. Therefore, the amount of alkali alone cannot determine the catalytic activity of the catalysts, and it is only one of the possible reasons.
 |
| | Fig. 4 Hydrogenation performance of Ca–8Cu/AC catalysts. | |
 |
| | Fig. 5 Hydrogenation performance of Sr–8Cu/AC catalysts. | |
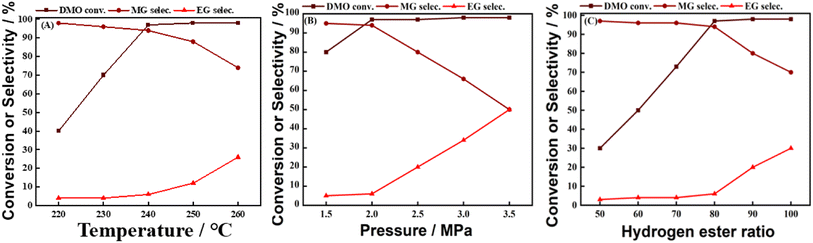
There are many factors affecting the reaction of DMO gas-phase hydrogenation to MG, such as temperature, pressure, hydrogen–ester ratio. In this work, the effects of temperature, pressure, and hydrogen ester ratio on the MG selectivity were sequentially explored using 0.1Ca–8Cu/AC catalysts (Ca loading of 0.1 wt% and Cu loading of 8 wt%), and the results are shown in Fig. 6(A–C). Fig. 6(A) explores the effect of reaction temperature on the catalytic activity of 0.1Ca–8Cu/AC catalysts from 220 °C to 260 °C. At 220 °C, the catalysts had low hydrogenation activity, and the conversion of DMO was only 40%, and the product was mainly MG, with an MG selectivity of 98%. With the increase of temperature, the conversion of DMO started to increase up to 97% (at 240 °C), followed by a rapid increase in the selectivity of ethylene glycol and a decrease in the selectivity of MG. It shows that the temperature has a great influence on the distribution of the products and favors the generation of MG at low temperatures. Fig. 6 (B) explored the effects of pressure on the catalytic activity of 0.1Ca–8Cu/AC catalysts, respectively. With the increasing pressure and hydrogen–ester ratio, the selectivity of MG appeared to be decreasing and the selectivity of EG increased, which indicated that the low pressure and low hydrogen–ester ratio favored the generation of MG. At the same time, the hydrogenation reaction releases more reaction heat, increasing the bed temperature, the temperature rises improves the reaction rate, which further promotes the reaction; on the other hand, the increase of the pressure reduces the volumetric flow rate of the feed gas stream, increases the residence time of the feed gas, and encourages the reaction to proceed adequately. But the low pressure resulted in a slow rate of the hydrogenation of DMO and a low conversion of DMO. Fig. 6(c) explored the effects of hydrogen–ester ratio on the catalytic activity of 0.1Ca–8Cu/AC catalysts. Excessive hydrogenation can be seen from Fig. 6(B) when the hydrogen–ester ratio is too high, resulting in lower selectivity of MG. But the low hydrogen–ester ratio leads to difficulties in the complete conversion of DMO. After comprehensively considering the DMO conversion and MG selectivity, the reaction conditions were selected in this work as follows, the reaction temperature of 240 °C, the reaction pressure of 2 MPa, the hydrogenation ratio of 80, the feedstock of 15% DMO methanol solution, and WLHSVDMO = 0.9 h−1.
 |
| | Fig. 6 The effect of reaction conditions on catalysts. (A) Temperature; (B) pressure; (C) hydrogen–easter ratio. | |
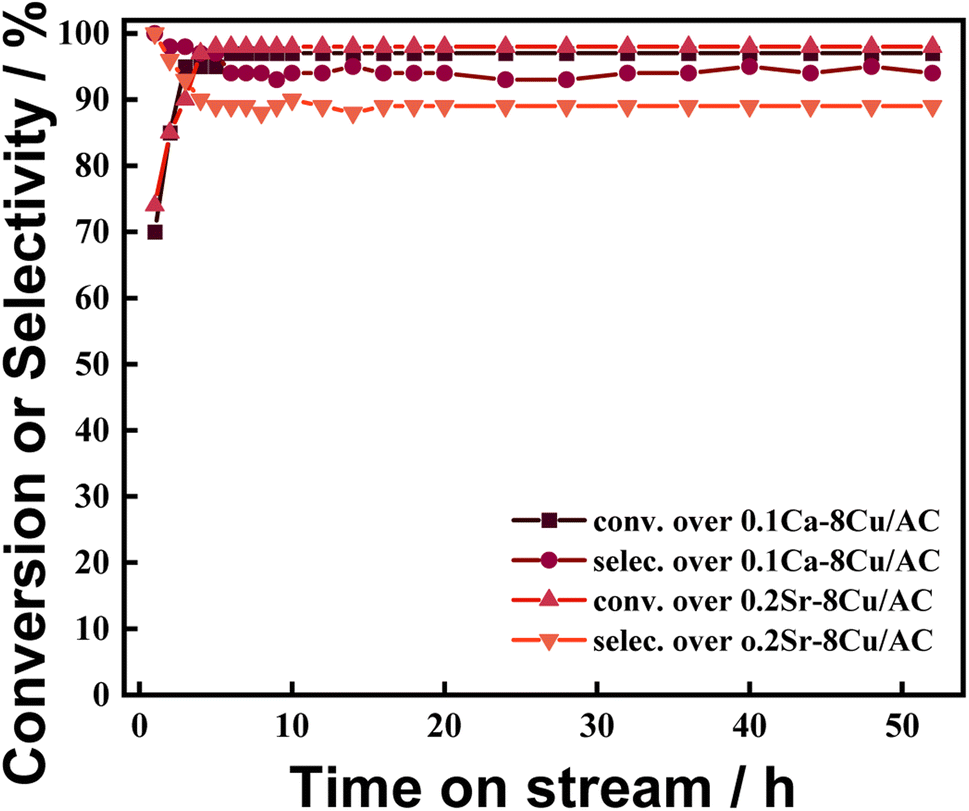
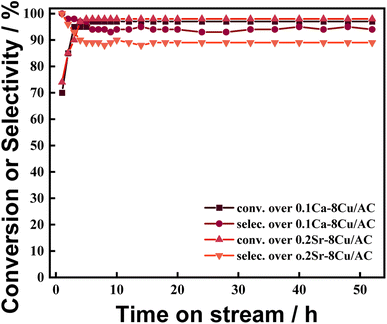
The changes of catalytic activities of 0.1Ca–8Cu/AC catalyst and 0.2Sr–8Cu/AC catalyst with reaction time are shown in Fig. 7. The results show that the reaction is basically stable at 8 h and the catalytic activity remains basically unchanged within 50 hours, which indicates that the catalysts have good stability.
 |
| | Fig. 7 Time on stream of 0.1Ca–8Cu/AC and 0.2Sr–8Cu/AC. Reaction conditions: T = 240 °C, P(H2) = 2.0 MPa, H2/DMO molar ratio = 80, WLHSVDMO = 0.9 h−1. | |
3.2 TPD analysis
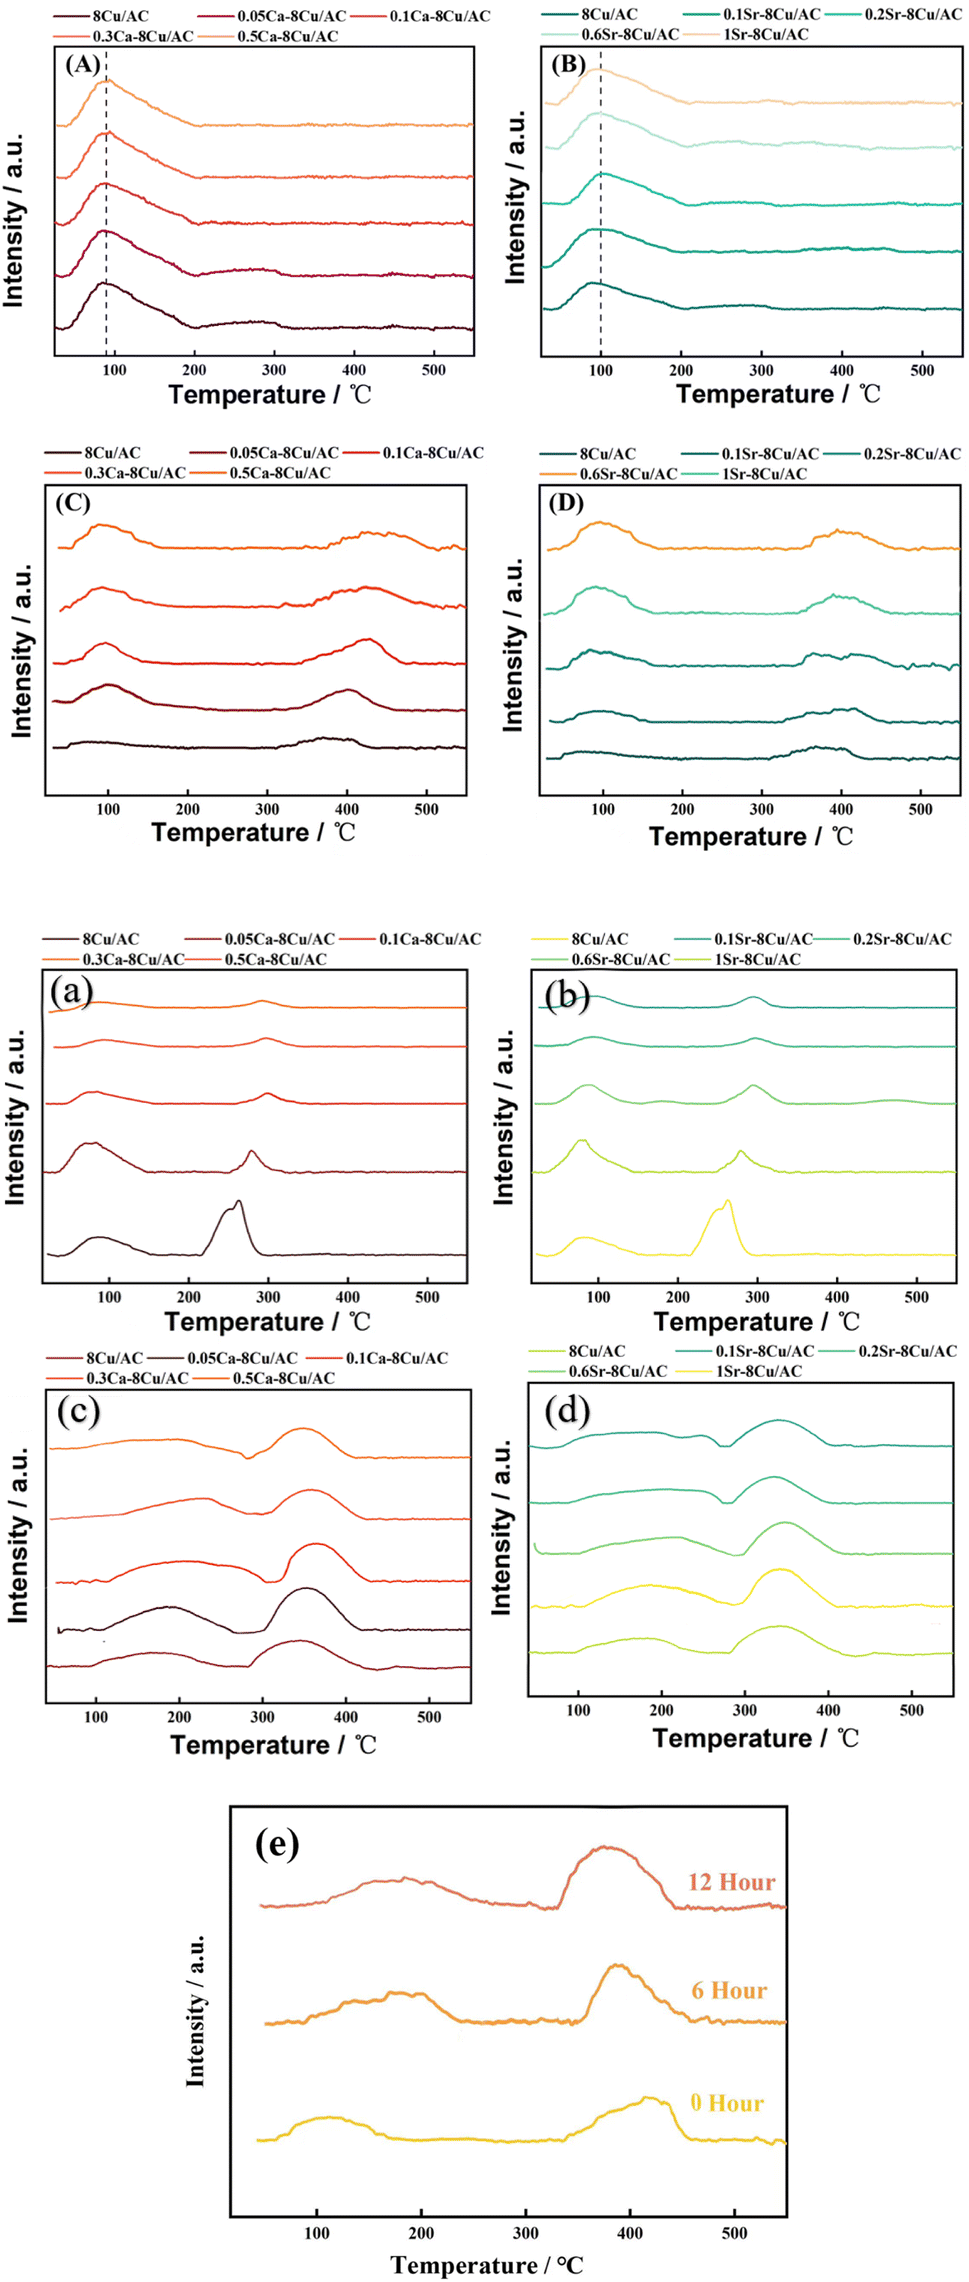
In order to investigate the effect of the introduction of alkaline earth metals on the acidity and alkalinity of the catalyst surface, CO2-TPD and NH3-TPD of the catalysts were carried out, respectively, and the results are shown in Fig. 8. From the Fig. 8(A and B) the results of NH3-TPD, it was concluded that the introduction of either Ca or Sr had no significant effect on the acidity of the catalyst surface. Li21 investigated the effect of three basic metals (Mg, Ca, Mn) modification of Ru/MCM-49 catalyst on the hydrogenation reaction of acetyl propionic acid, and they pointed out that the basic metals were more likely to bind to the strong acidic sites, which leads to the reduction of the amount of strong acidity of the catalyst. In this work, from NH3-TPD, it is observed that there is only one desorption peak of weak acid sites, and there is a small but insignificant decrease in the amount of acid site after the introduction of Ca, probably because there are no strong acid sites on the surface of the support that can be bound to Ca, and the weak acid sites are unable to bind to Ca because of their weak adsorption capacity. Thus, there is no effect on the acidity of the catalyst surface22 with the additive of alkaline earth metal. On Fig. 8(C and D) CO2-TPD, all the samples have weakly basic sites around 100 °C and moderately strongly basic sites around 390 °C. The addition of alkaline earth metal increases the desorption temperature of the moderately strongly basic sites, which may be since the introduction of Ca has changed the adsorption strength of some adsorption sites on the surface, and the adsorption capacity of some weakly adsorbed sites has become stronger, which leads to the more difficult desorption of CO2 and the desorption peak shifts to the right. At the same time, the area of the desorption peak at low temperature becomes larger, which may be due to the increase in the amount of base after introducing Ca. Edwards23 et al. pointed out that the surface of AC treated under alkaline conditions would be more favorable for the dispersion of metal Pd on the surface, which would lead to a higher catalytic activity of the catalyst in the reaction of Pd/AC catalyst in the hydrogenation of nitrobenzene. To verify whether the introduction of Ca has a similar effect on this catalyst, XRD and TEM were continued to explore whether the introduction of alkaline can play a good role in the dispersion of Cu. From Fig. 8(a–d), the acidity and alkalinity of the surface of all catalysts changed after the reaction, but the change in acidity and alkalinity of the surface of the Ca or Sr modified catalysts was smaller than that of the unmodified catalysts. It indicates that modification with Ca or Sr greatly improves the stability of the catalyst. Fig. 8(e) shows the CO2-TPD of 0.1Ca–Cu/AC catalyst after different reaction times. It can be seen that the change of the surface alkaline site of the catalyst with reaction time of 6 hours and 12 hours is no longer. obvious. It can be seen from Fig. 7 that DMO conversion and MG selectivity can remain stable for 50 hours after 10 hours of reaction. Therefore, we conclude that the Ca–Cu/AC catalyst presented in this paper has good stability.
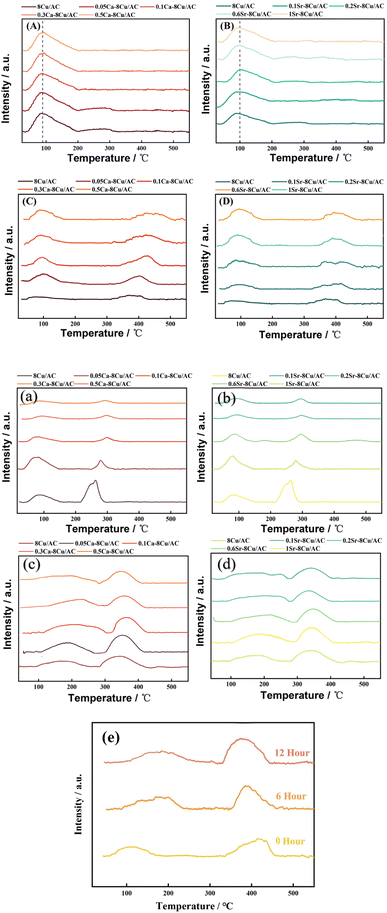 |
| | Fig. 8 TPD profiles of catalyst (A–D) (a–d), (A) NH3-TPD-Ca before reaction; (B) NH3-TPD-Sr before reaction; (C) CO2-TPD-Ca before reaction; (D) CO2-TPD-Sr before reaction; (a) NH3-TPD-Ca after reaction; (b) NH3-TPD-Sr after reaction; (c) CO2-TPD-Ca after reaction; (d) CO2-TPD-Sr after reaction; (e) CO2-TPD (reaction time)-0.1Ca–Cu/AC. | |
3.3 XRD and TEM analysis
XRD characterization gives the initial particle size and dispersion of Cu after reduction, as shown in Fig. 9(A and B). Fig. 9(A) shows the XRD patterns of the catalysts after reduction with different loadings content of Ca. All the samples showed a bun peak at 2θ = 26.603°, which is a characteristic diffraction peak belonging to the AC. 8Cu/AC-4 showed characteristic diffraction peaks of zero-valent Cu at 2θ = 43.316°, 50.448°, and 74.124°, which corresponded to the three crystalline surfaces of copper – (111), (200), and (220), respectively, indicating that Cu was completely reduced to zero-valent monomeric copper.24 With the increase of Ca content, the intensities of these three copper peaks are decreasing, and the widths of the diffraction peaks are gradually widening, indicating that the addition of Ca increases the dispersion of Cu on the surface. Calculations by Scherrer's formula revealed that the particle size of Cu species is gradually becoming smaller with the addition of Ca, indicating that the introduction of the additive Ca helps to reduce the particle size of Cu particles. Especially when the Ca loading is 0.3 wt%, a very obvious change in the diffraction peak of Cu at 2θ = 43.316° can be observed. At Ca contents from 0.05 wt% to 0.5 wt%, no peaks about Ca appeared on the XRD pattern, which may be because the content of Ca is too small to be measured by XRD. Fig. 9(B) shows the XRD pattern of the catalysts after reduction with different loadings of Sr, which shows a consistent pattern with Ca. With the increase of Sr, the particle size of Cu particles decreased and the dispersion increased.
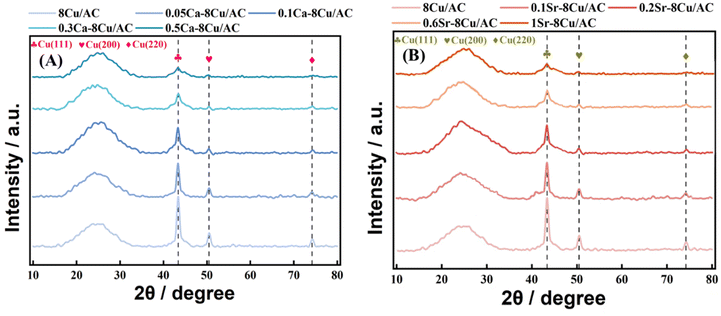 |
| | Fig. 9 Wide-angle XRD patterns of catalysts, (A) Ca; (B) Sr. | |
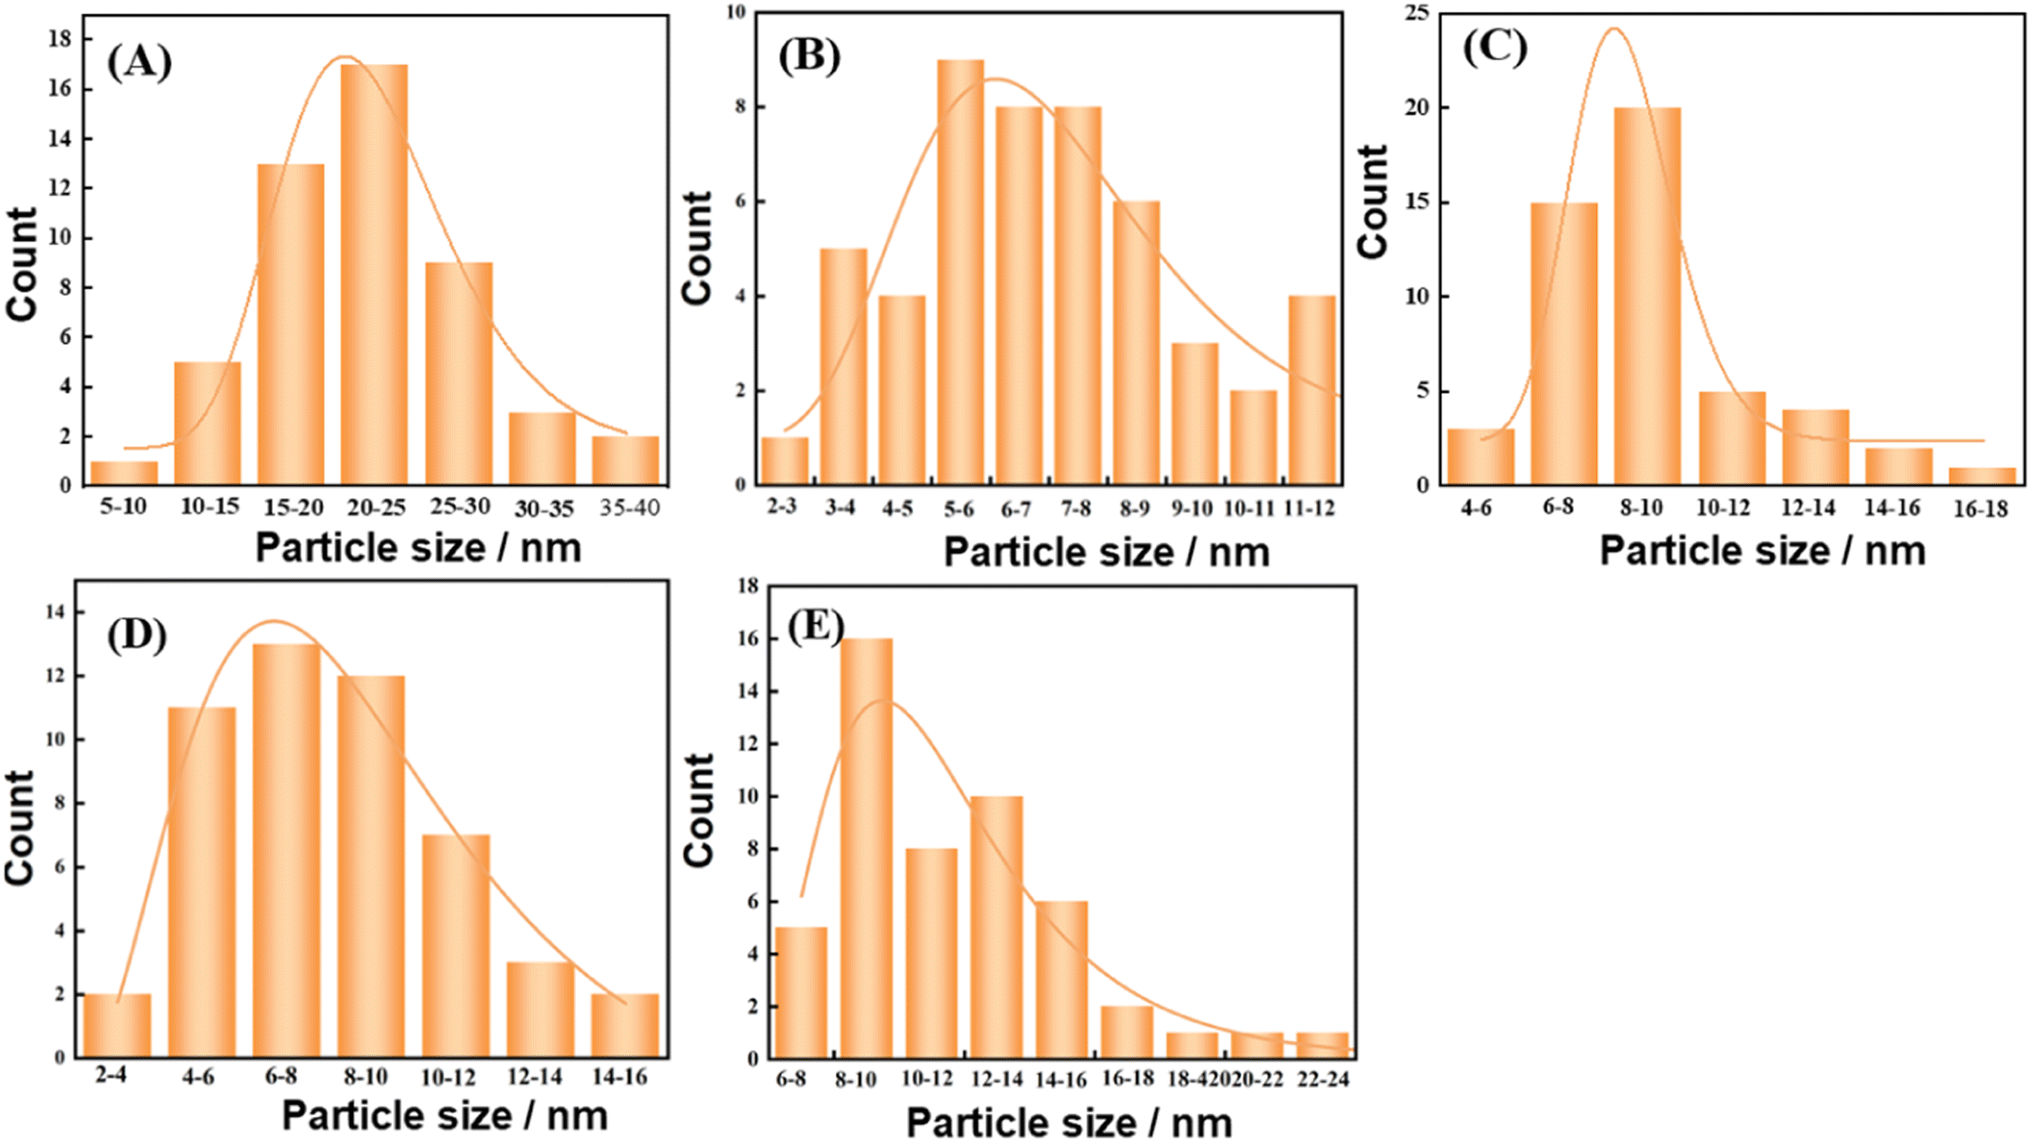
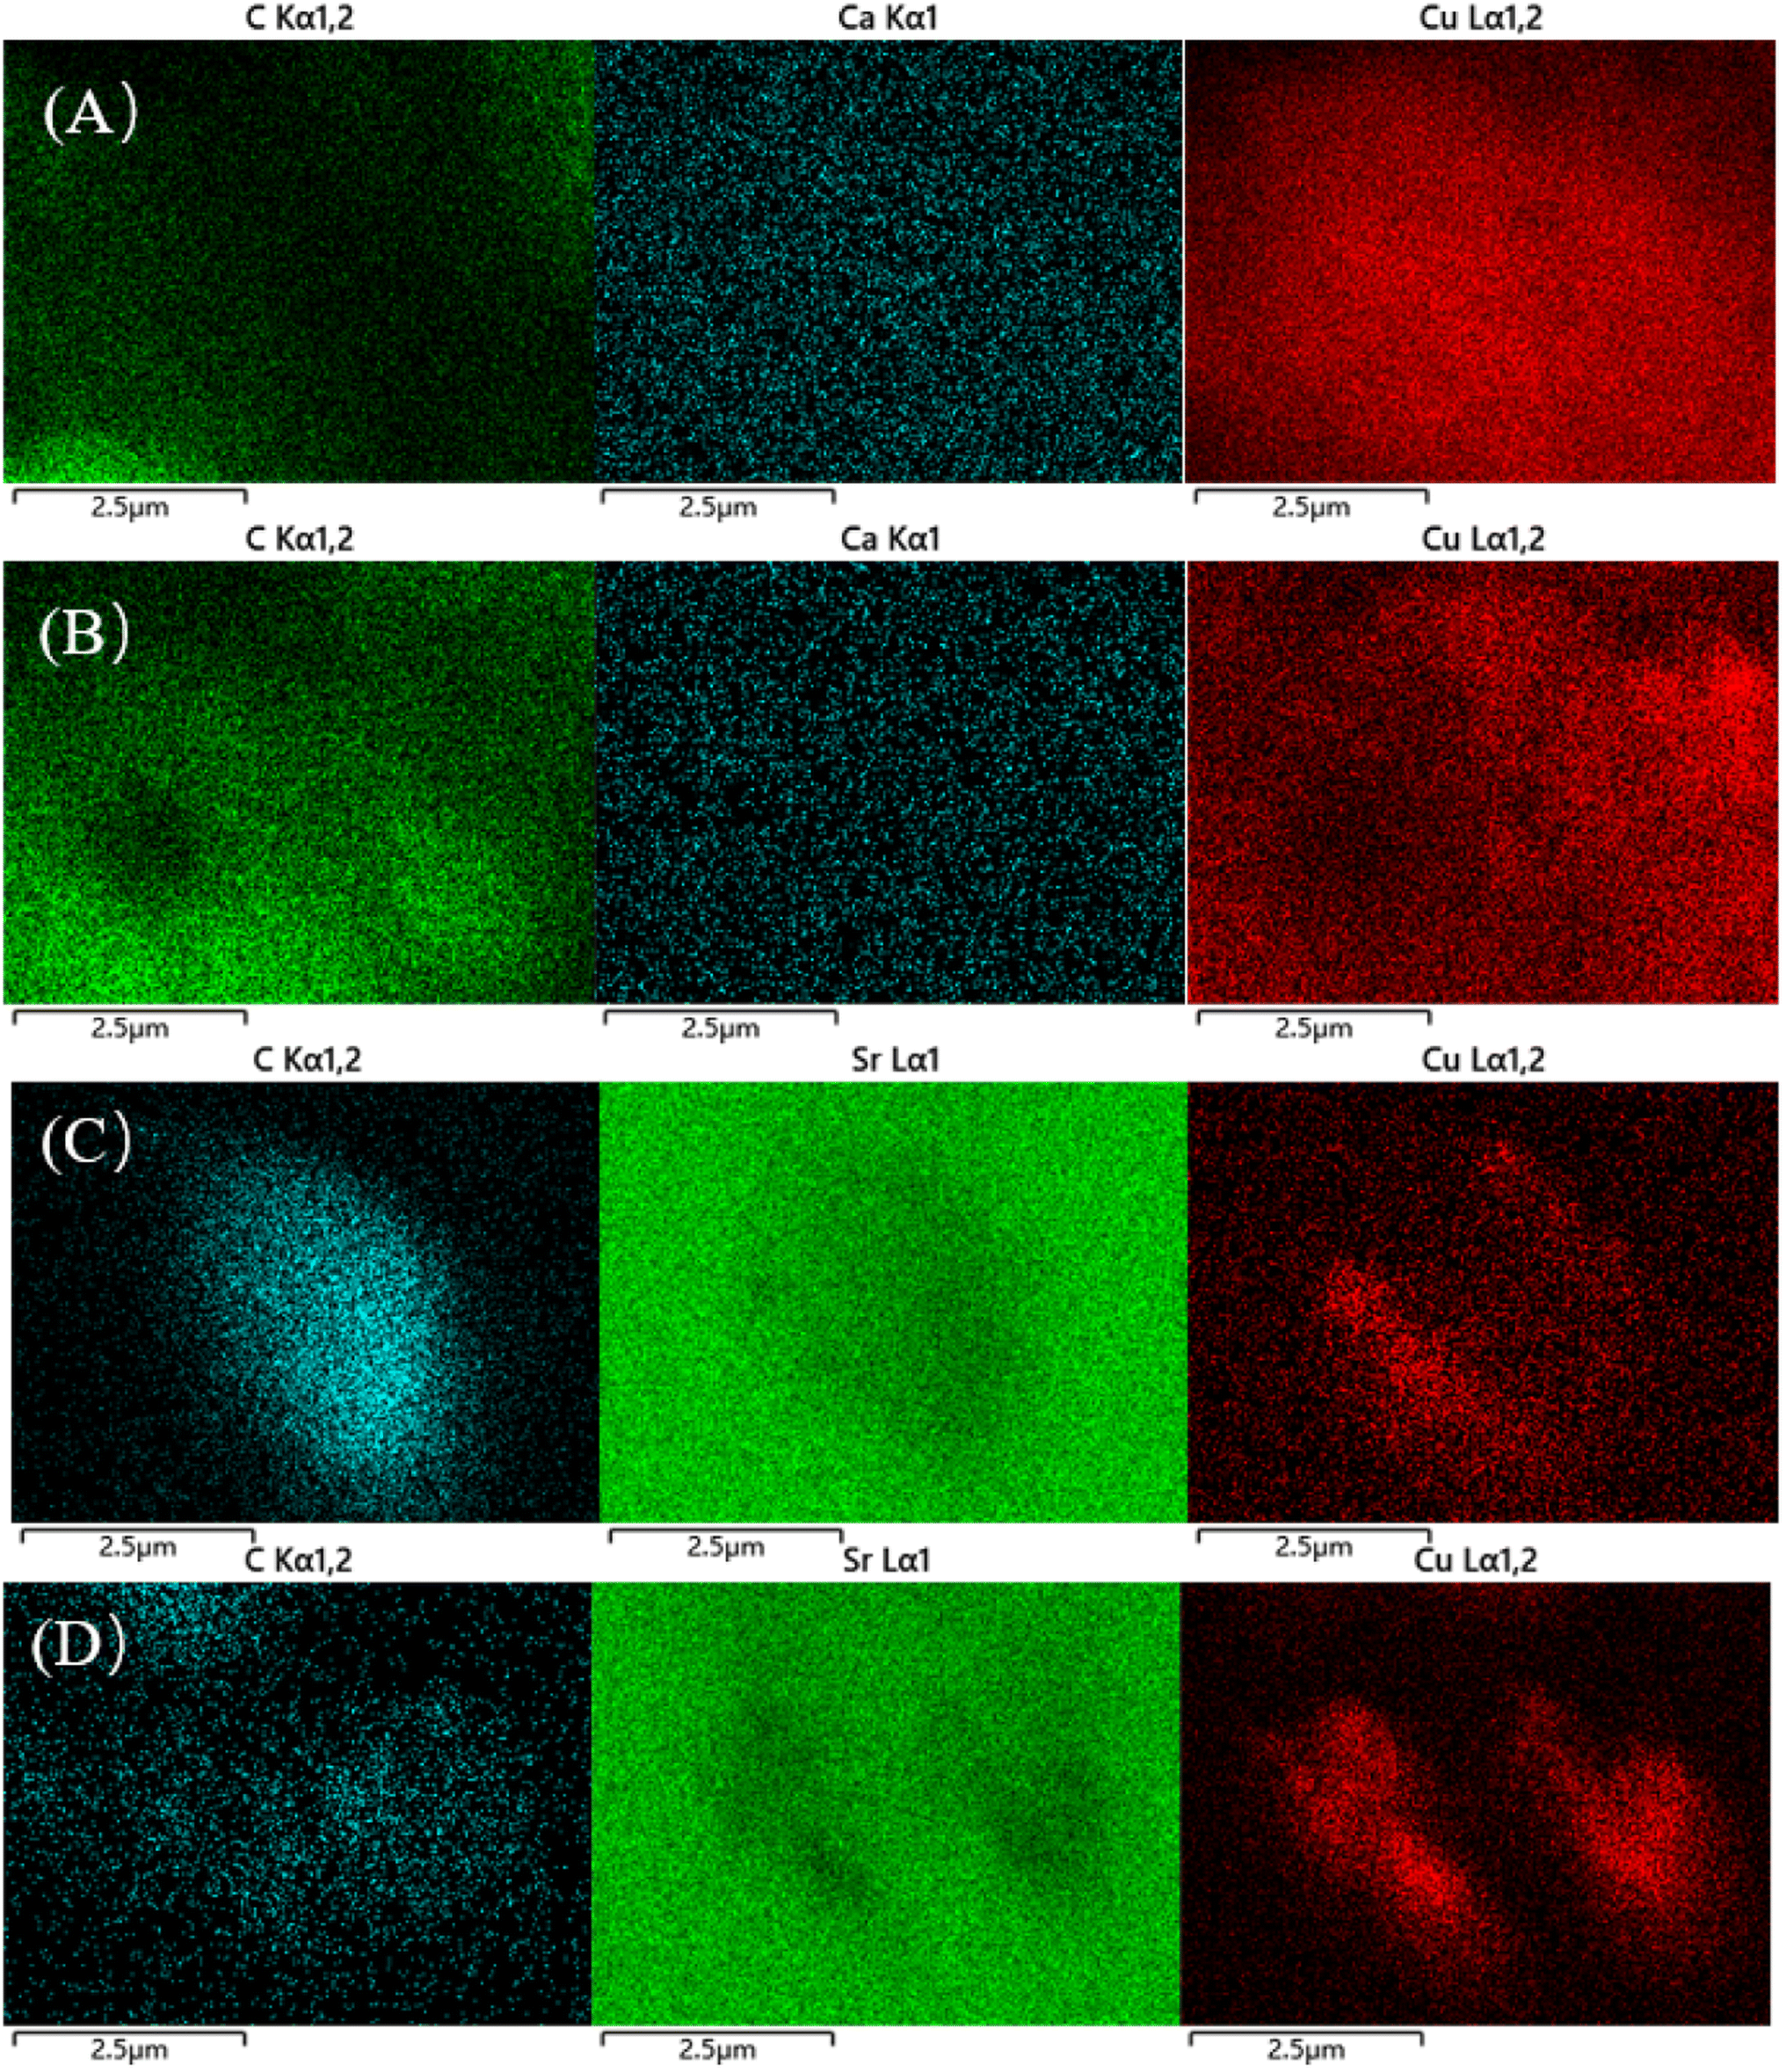
The catalyst structure was continued to be analyzed by TEM. And Fig. 10(A–F) shows the TEM images of the catalyst after reduction and after reaction. Fig. 11(A–E) shows the Cu particle size distribution calculated statistically using Nano measurer software. The TEM analysis obtained that most of the particle sizes of 8Cu/AC after reduction were distributed in 20–25 nm, and the average particle size was 21 nm. The Cu particle sizes of the modified catalysts after reduction were obviously reduced, and it was calculated statistically that the initial Cu particle sizes of the 0.1Ca–8Cu/AC catalysts were mostly distributed in 5–6 nm, with an average particle size of 6.78 nm, The initial particle size of the 0.2Sr–8Cu/AC catalyst Cu was mostly distributed in 6–8 nm, and the average particle size was 8.32 nm. After the reaction, the average Cu particle size of the 0.1Ca–8Cu/AC catalyst was 8.35 nm, and that of the 0.2Sr–8Cu/AC catalyst was 10.2 nm. Those results indicate that the incorporation of Ca or Sr drastically reduce the particle size of the Cu particles. And the Ca-modified catalyst possessed a smaller Cu particle size than the Sr-modified catalyst. Meanwhile, on the TEM image after catalyst reduction, the Cu of the catalyst modified by alkaline earth metals has better dispersion on the support. The results of TEM maps of catalyst after the reaction showed that a large number of Cu particles agglomerated in the 8Cu/AC catalyst after the reaction while the agglomeration phenomenon of 0.1Ca–8Cu/AC catalyst or 0.2Sr–8Cu/AC catalyst after the reaction was not obvious, and Cu particles attached on the surface of the supports with a smaller particle size could be seen, which could be attributed to the fact that the incorporation of alkaline-earth metals enhanced the interaction between Cu and AC. The SEM mapping results showed that the reduced catalysts were more enriched with Cu on the 0.1Ca–8Cu/AC catalysts, which indicated that Ca was more effective than Sr as an additive and helped Cu adsorption on the activated carbon more. By comparing the mapping before and after the reaction, we can observe that the dispersion of Cu is better before either Ca or Sr reaction (Fig. 12).
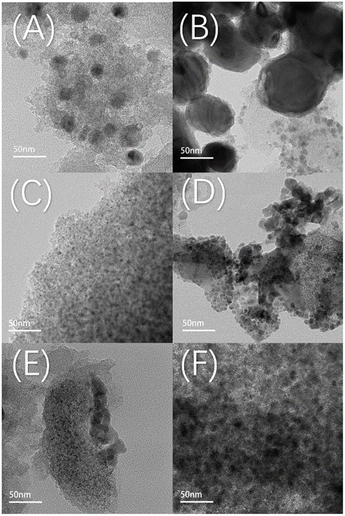 |
| | Fig. 10 TEM images of catalyst (A–F), (A) reduced catalyst-8Cu/AC; (B) reduced catalyst-0.1Ca–8Cu/AC; (C) reduced catalyst-0.1Ca–8Cu/AC; (D) after-reaction catalyst-0.1Ca–8Cu/AC; (E) reduced catalyst-0.2Sr–8Cu/AC; (F) after-reaction catalyst-0.2Sr–8Cu/AC. | |
 |
| | Fig. 11 Particle size distribution of catalyst, (A) reduced catalyst-8Cu/AC; (B) reduced catalyst-0.1Ca–8Cu/AC; (C) after-reaction catalyst-0.1Ca–8Cu/AC; (D) reduced catalyst-0.2Sr–8Cu/AC; (E) after-reaction catalyst-0.2Sr–8Cu/AC. | |
 |
| | Fig. 12 SEM mapping images of catalyst (A–D), (A) reduced catalyst-0.1Ca–8Cu/AC; (B) after reaction catalyst-0.1Ca–8Cu/AC; (C) reduced catalyst-0.2Sr–8Cu/AC; (D) after reaction catalyst-0.2Sr–8Cu/AC. | |
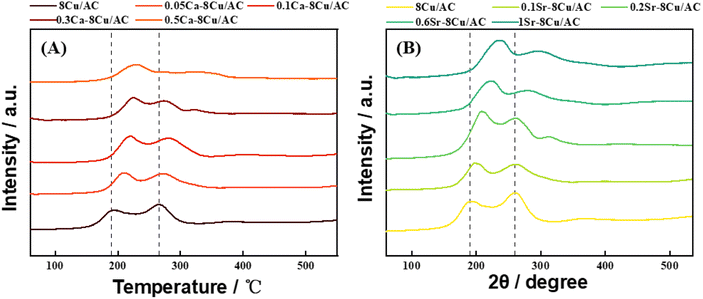
3.4 H2-TPR analysis
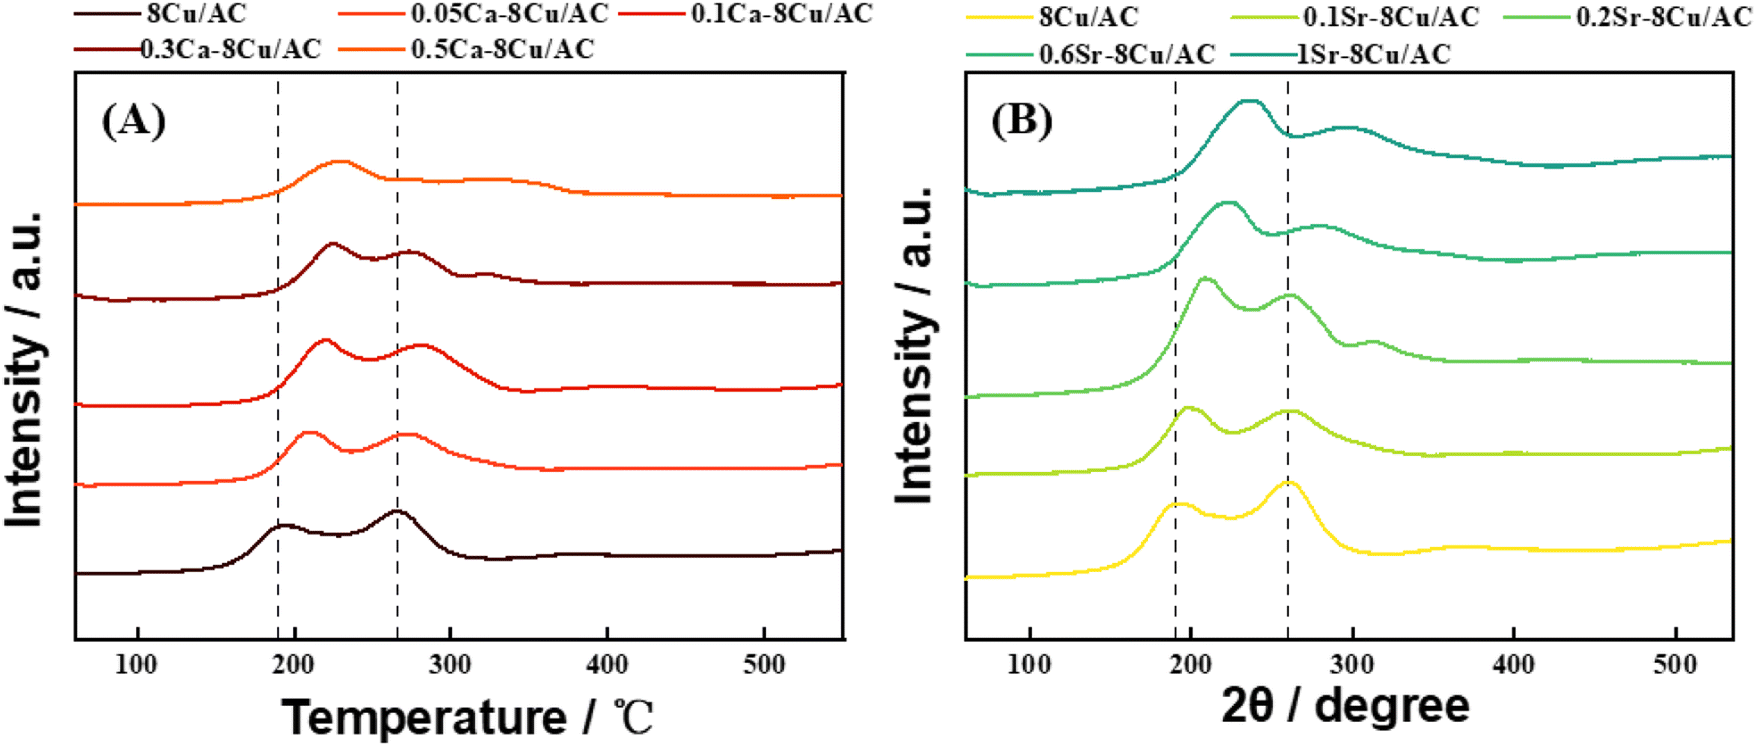
Fig. 13(A) shows the H2-TPR plots of the Ca-modified catalysts with different loadings, and Fig. 13(B) shows the H2-TPR plots of the Sr-modified catalysts with different loadings. Two reduction peaks existed in all the samples, taking 8Cu/AC-4 catalyst as an example, the reduction peak around 190 °C belongs to the reduction peaks from Cu2+ to Cu+, and the reduction peaks around 268 °C belong to the reduction peaks from Cu+ to Cu0.25 The H2-TPR plots showed that the addition of alkaline earth metals increased the reduction temperature of Cu species, and with the increase of alkaline earth metal content, the reduction temperature of Cu species increased, and the more difficult Cu was reduced, indicating that the addition of alkaline earth metals increased the interaction force between Cu and the support. Therefore, the Cu species of modified catalyst are more resistant to migrate and aggregate during the reaction process,26 which is in accordance with the results of the TEM.
 |
| | Fig. 13 H2-TPR profiles of catalysts, with addition of (A) Ca; (B) Sr. | |
3.5 XPS analysis
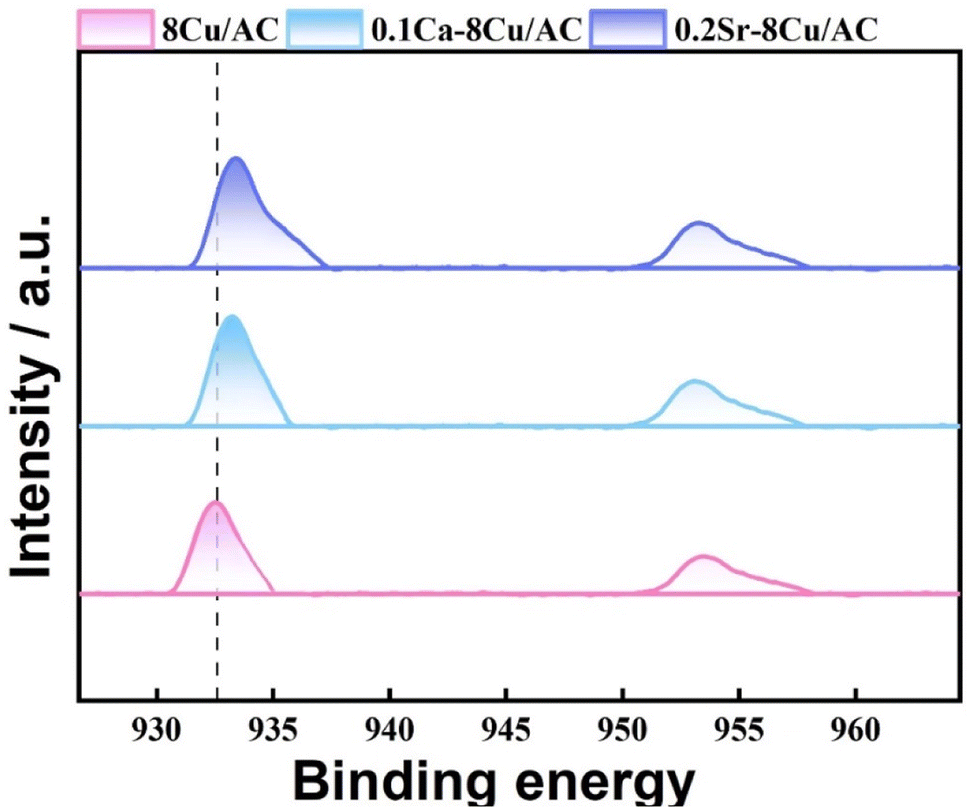
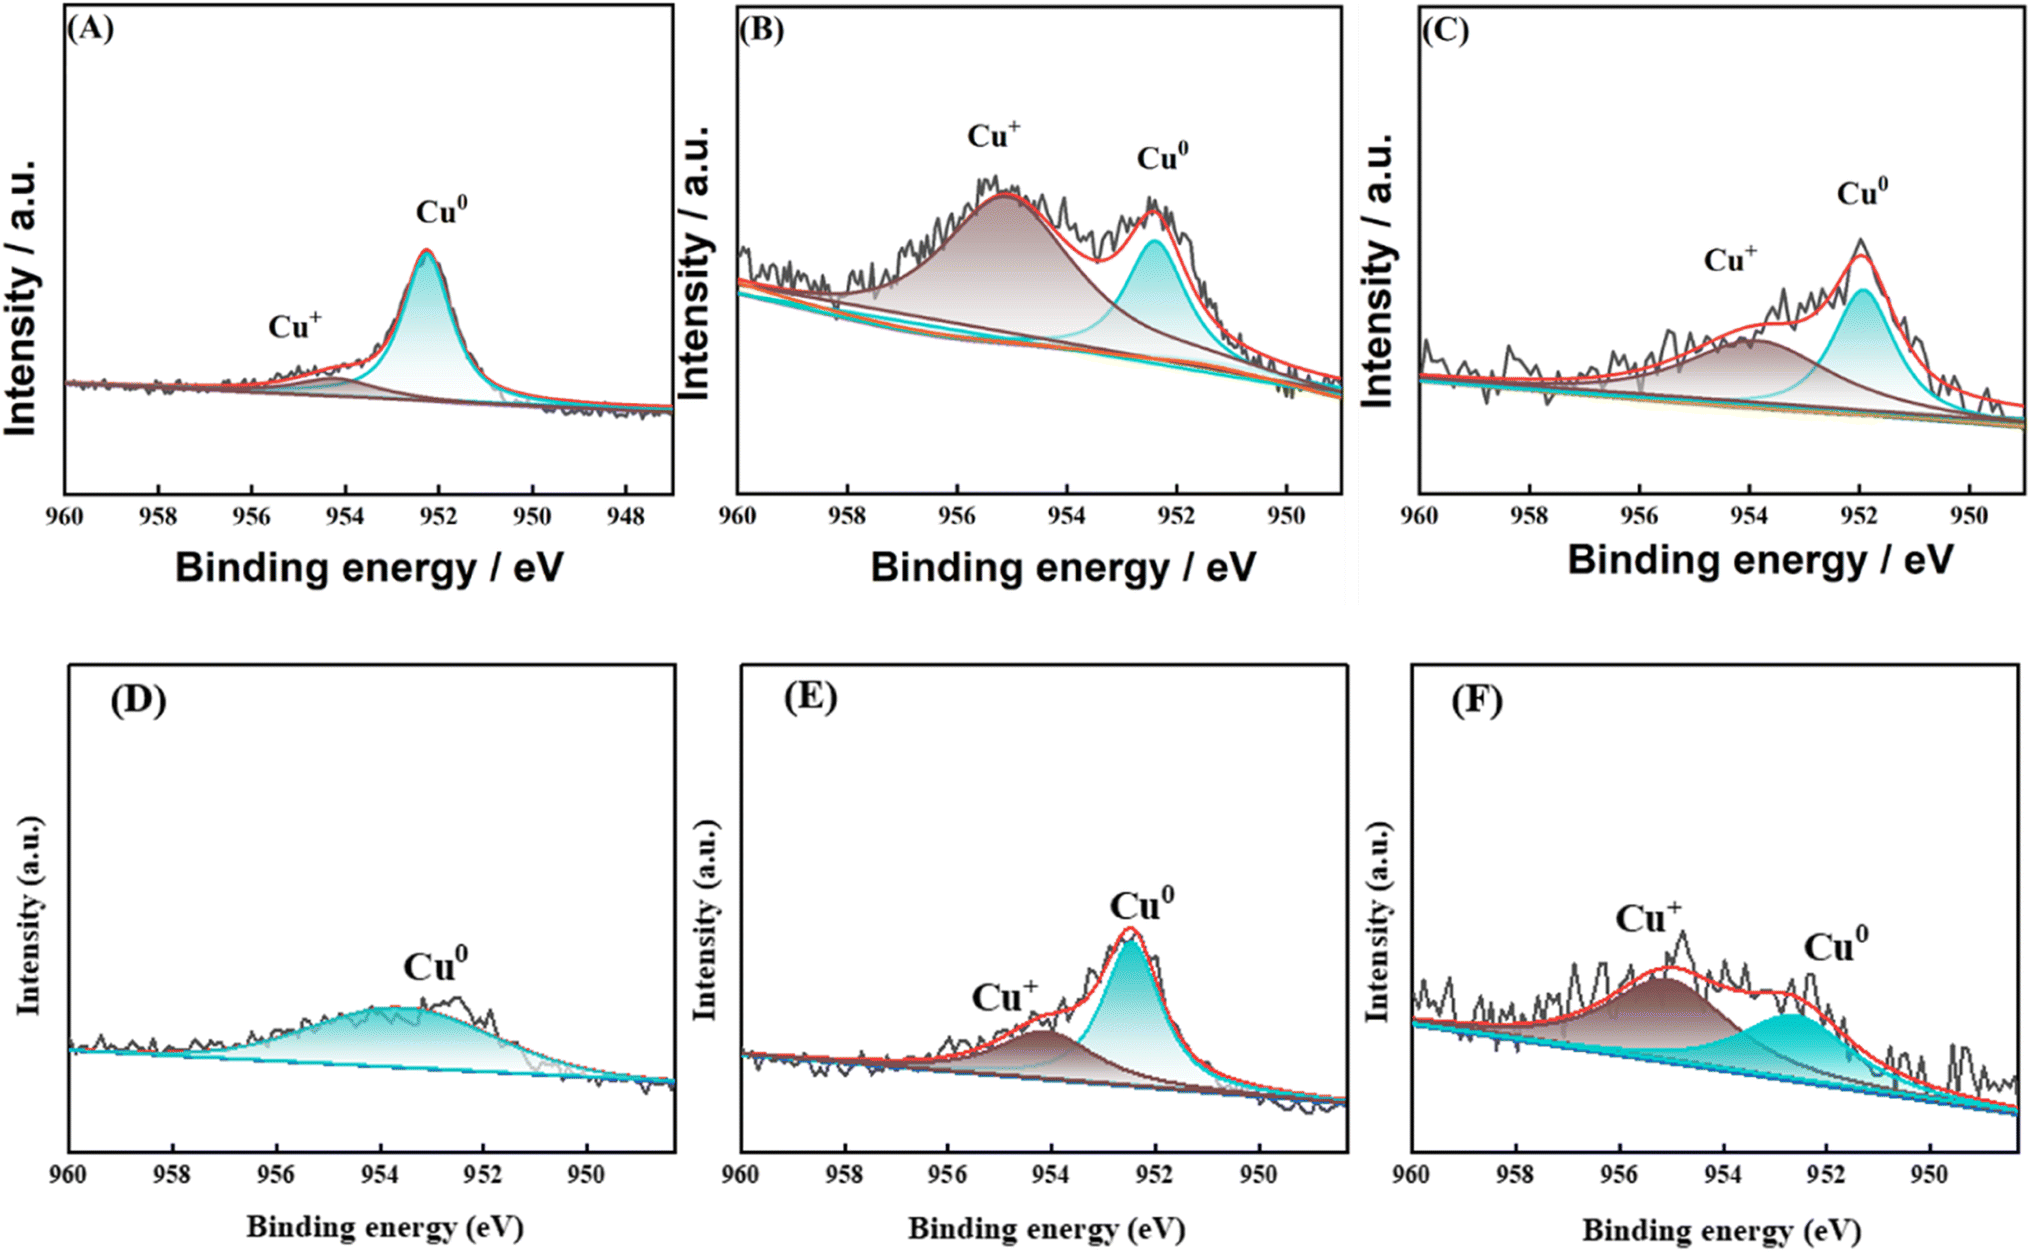
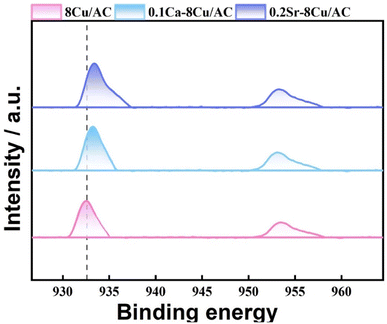
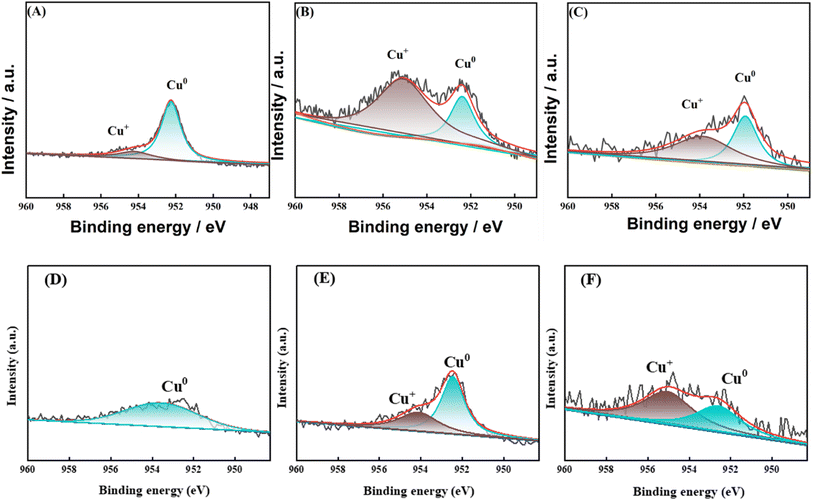
In order to investigate the effect of the valence state of the surface Cu species on the reaction, XPS characterization was carried out for the catalysts after reaction. In the reaction using Cu-based catalysts, many studies have demonstrated the synergistic effect of Cu0 and Cu+.27–29 As shown in Fig. 14, two characteristic peaks belonging to Cu 2p3/2 and Cu 2p1/2 (ref. 30) appeared near 933.3 eV and 952.8 eV for all samples in the Cu 2p mapping, while no characteristic peak belonging to Cu2+ appeared between 941–945 eV, which suggests that the Cu species were reduced to Cu0 or Cu+31 on all samples. For the 8Cu/AC catalyst, 0.1Ca–8Cu/AC catalyst and 0.2Sr–8Cu/AC catalyst were compared, the binding energies of Cu 2p changed significantly for the 0.1Ca–8Cu/AC catalyst and 0.2Sr–8Cu/AC catalyst, suggesting that the introduction of alkaline-earth metals indeed affects the electronic structure of Cu species. Since the binding energies of Cu+ and Cu0 are very similar, they cannot be distinguished from Cu 2p alone. The valence states of Cu species on the catalyst surface were further analyzed by XAES with peak splitting,32 and the results are shown in Fig. 15(A–C). It can be seen that all the samples have two Cu species valence states, in which 953.98 eV belongs to the Cu+ characteristic peak, and 951.98 eV belongs to the Cu0 characteristic peak.33 From Table 2, the Cu+ ratio in the 0.1Ca–8Cu/AC-4 catalysts increased significantly after the introduction of Ca, which indicates that the introduction of Ca as an electronic additive can increase the Cu+ ratio on the surface of Cu species. This may be due to the fact that Ca has electron-donating ability like Na and K, which provides electrons to Cu and can increase the stable presence of Cu+.34 It has been shown that the ratio between Cu0 and Cu+ has a great influence on the reaction of Cu-based catalysts in DMO gas-phase hydrogenation. Cheng35 et al., Wang36 et al., and Abbas37,38 et al. all concluded that the presence of Cu+ is beneficial to improve the stability of the catalyst against MG. In this paper, when the Ca loading is 0.1 wt% and the ratio of Cu+ is 0.65 is optimal for the MG selectivity. Similarly, Sr can also change the Cu+ ratio on the surface of Cu species, and the Cu+ ratio is slightly lower than that of Ca at 0.51,39 which may also be the reason why the 0.2Sr–8Cu/AC-4 catalyst has a slightly poorer selectivity to MG than Ca. Meanwhile, in order to verify the effect of Cu+ on the catalyst, we also did the XAES after the reaction of 0.05Ca–8Cu/AC catalyst and 0.3Ca–8Cu/AC catalyst, and the characterization results are shown in Fig. 15(E and F). According to the findings presented in Table 2, it can be observed that catalysts containing varying Ca contents exert an influence on the Cu valence state. By comparing the results of the three catalysts, we observed that the ratio of Cu+/Cu0 gradually increased with the increase of Ca content. When the amount of Ca added is 0.1, the maximum value is reached. However, after further increasing the Ca content, Cu+/Cu0 began to decrease. In general, there is a volcanic trend, which is consistent with the reaction results.
 |
| | Fig. 14 Cu 2p of after-reaction catalysts. | |
 |
| | Fig. 15 Cu LMM spectra of after-reaction catalysts. (A) 8Cu/AC; (B) 0.1Ca–8Cu/AC; (C) 0.2Sr–8Cu/AC; (D) 0.1Ca–Cu/AC before reaction; (E) 0.3Ca–Cu/AC before reaction; (F) 0.05Ca–Cu/AC before reaction. | |
Table 2 The proportion of Cu+ in the peak of the Auger spectrum of Cu species in the catalyst after the reaction
| Catalysts |
Relative area |
XCu+a (per cent) |
| Cu+ (953.98 eV) |
Cu0 (951.98 eV) |
| XCu+ (%) = Cu+/(Cu+ + Cu0) × 100 per cent. |
| 8Cu/AC |
1355 |
5543 |
0.2 |
| 0.1Ca–Cu/AC |
2466 |
1287 |
0.65 |
| 0.2Sr–Cu/AC |
1278 |
1198 |
0.51 |
| 0.05Ca–Cu/AC |
3410.71 |
6561.47 |
0.58 |
| 0.3Ca–Cu/AC |
1845.24 |
1320.34 |
0.34 |
As Fig. 15(D) shows the XAES before the reaction of 0.1Ca–Cu/AC, the characterization results show that there only exists Cu0 before the reaction. Combined with Fig. 2, we can conclude that during the hydrogenation of dimethyl oxalate, Cu+ is obtained by Cu0 oxidation during the reaction. The synergistic effect of Cu+ and Cu0 has an important influence on the catalytic effect. In order to investigate the impact of Ca addition on the Cu+/Cu0 ratio, Fig. 15(E and F) illustrates the XAES results after the reaction of 0.3Ca–Cu/AC catalyst and 0.05Ca–Cu/AC catalyst. By combining these findings with the data presented in Table 2 and it was observed that a small amount of Ca addition led to an increase in the Cu+/Cu0 ratio. Upon increasing the Ca content to 0.1 wt%, the catalyst achieved an optimal Cu+/Cu0 ratio while also exhibiting selectivity towards MG production. However, further increase in Ca content resulted in a decline of the Cu+/Cu0 ratio and a decrease in MG selectivity for this catalyst system. These observations suggest that Cu+ plays a stabilizing role in maintaining MG presence during DMO hydrogenation reaction.40
4 Conclusion
In this work, a series of AC supported Cu catalysts with different metal additive loadings were prepared by urea-assisted precipitation ammonia evaporation method, and the effects of alkaline earth metal additives on the catalysts were investigated. The optimum loading of Ca was 0.1 wt%, The DMO conversion reached 97% and MG selectivity was 94% at the Ca optimum loading of 0.1 wt%. The modification effect of Sr on the catalyst (98% DMO conversion, 89% MG selectivity) was the same as that of Ca but slightly less effective. The modification of the Cu/AC catalyst by Ca or Sr enhanced the alkalinity of the catalyst surface, further improved the dispersion of Cu species, reduced the average particle size, and reduce the agglomeration of Cu species. At the same time, the ratio of Cu+ to Cu0 during the reaction process was changed, indicated that addition of alkaline earth metal increased the stable presence of Cu species in Cu+ during the reaction process, thus improving the selectivity of the catalyst to MG. The Cu particle size, the acidity and alkalinity of the support surface, and the ratio of Cu0 to Cu+ during the reaction process had a synergistic effect on the catalytic property of AC supported Cu catalyst in the reaction of DMO hydrogenation to MG.
Author contributions
Zanji Rong: methodology, writing – original draft, writing – review & editing. Weihua Shen: writing – review & editing, supervision. Yunjin Fang: writing – review & supervision.
Conflicts of interest
Authors declare that there is no conflict of interest.
Acknowledgements
The authors are grateful for the convenience of all Characterization from the analysis and testing center of the East China University of Science and Technology.
References
- Y. Liu, J. Ding and J. Yang, et al., Stabilization of copper catalysts for hydrogenation of dimethyl oxalate by deposition of Ag clusters on Cu nanoparticles, Catal. Commun., 2017, 98, 43–46 CrossRef CAS.
- X. Ke, Handbook of Fine Organic Chemical Raw Materials and Intermediates, Chemical Industry Press, 1998 Search PubMed.
- S. H. Soumay, Carbonylation of formaldehydecatalyzed by Cu (I), Ag (I) Carbonyls at 1 atm, Nippon Kagaku Kaishi, 1982, 2, 163–166 Search PubMed.
- E. L. Yeakey, and R. S. John, Production of Alkyl goycolates, US Pat., 4602102, 1986 Search PubMed.
- T. Kiyoura, Manufacturing method of light-based acetic acid alcohol, CN:104665, 1996.
- J. Zhang, Process Development of Dimethyl Oxalate Hydrogenation to Methyl Ethanoate, East China University of Science and Technology, 2012 Search PubMed.
- J. An, X. Wang and J. Zhao, et al., Density-functional theory study on hydrogenation of dimethyl oxalate to methyl glycolate over copper catalyst: Effect of copper valence state - ScienceDirect, Mol. Catal., 2024, 482, 110667 CrossRef.
- B. Chu, Y. Deng and X. Liu, et al., Reversible interconversion and functional division of highly dispersed Cu species during CO + NO reaction, Mol. Catal., 2022, 530, 112636 CrossRef CAS.
- M. Ouyang, Y. Wang and J. Zhang, et al., Three-dimensional Ag/KCC-1 catalyst with a hierarchical fibrous framework for the hydrogenation of dimethyl oxalate, RSC Adv., 2016, 6(16), 12788–12791 RSC.
- Y. Cui, B. Wang and C. Wen, et al., Investigation of Activated-Carbon-Supported Copper Catalysts with Unique Catalytic Performance in the Hydrogenation of Dimethyl Oxalate to Methyl Glycolate, ChemCatChem, 2016, 8(3), 527–531 CrossRef CAS.
- M. Abbas, J. Wang and P. Stelmachowski, et al., Rational design of hydroxyapatite/graphite-supported bimetallic Cu–M (M = Cu, Fe, Co, Ni) catalysts for enhancing the partial hydrogenation of dimethyl oxalate to methyl glycolate, Catal. Sci. Technol., 2023, 13(11), 3270–3281 RSC.
- D. Wang, C. Zhang and M. Zhu, et al., Highly Active and Stable ZrO2 -SiO2 -Supported Cu-Catalysts for the Hydrogenation of Dimethyl Oxalate to Methyl Glycolate, ChemistrySelect, 2017, 2(17), 4823–4829 CrossRef CAS.
- M. Abbas, J. Zhang and Z. Chen, et al., Sonochemical synthesis of Zn-promoted porous MgO-supported lamellar Cu catalysts for selective hydrogenation of dimethyl oxalate to ethanol and their long-term stability, New J. Chem., 2018, 42(21), 17553–17562 RSC.
- M. Abbas, Z. Chen and J. Chen, Shape and size-controlled synthesis of Cu nanoparticles wrapped on RGO nanosheet catalyst and their outstanding stability and catalytic performance in the hydrogenation reaction of dimethyl oxalate, New J. Chem., 2018, 6(39), 19133–19142 CAS.
- H. Huang, B. Wang and Y. Wang, et al., Partial hydrogenation of dimethyl oxalate on Cu/SiO2 catalyst modified by sodium silicate, Catal. Today, 2020, 358, 68–73 CrossRef CAS.
- H. Yan, M. Zhao and X. Feng, PO43- Coordinated Robust Single-Atom Platinum Catalyst for Selective Polyol Oxidation, Angew. Chem., 2022, 21(134), e202116059 Search PubMed.
- S. H. Soumay, Carbonylation of formaldehydecatalyzed by Cu (I), Ag (I) Carbonyls at 1 atm, Nippon Kagaku Kaishi, 1982, 2, 163–166 Search PubMed.
- L. Lin, P. Pan and Z. Zhou, Cu/SiO2 Catalysts Prepared by the Sol-Gel Method for Hydrogenation of Dimethyl Oxalate to Ethylene Glycol, Chin. J. Catal., 2011, 32(6–8), 957–969 CrossRef CAS.
- M. Fan, X. Zhang and Y. Shao, Influence of solvent on aggregation of metallic Cu in Cu/MgO during hydrogenation in liquid phase, Mol. Catal., 2022, 524, 112322 CrossRef CAS.
- Y. Huang, H Ariga and X. Zheng, et al., Silver-modulated SiO2-supported copper catalysts for selective hydrogenation of dimethyl oxalate to ethylene glycol, J. Catal, 2023, 307, 74–83 CrossRef.
- F. Li and X. Ning, et al., Promotional effect of Mn doping on Ru/layered MCM-49 catalysts for the conversion of Levulinic acid to γ-Valerolactone, Carbon Resour. Convers., 2022, 5(3), 185–192 CrossRef.
- W. U. Wei, Z. Wen-Tao and L. Wen-Yong, Analysis of Effect Factors of NH_3-TPD Characterization Results, Chem. Adhes., 2004,(01), 17–19 Search PubMed.
- J. K. Edwards, J. Pritchard and M. Piccinini, et al., The effect of heat treatment on the performance and structure of carbon-supported Au-Pd catalysts for the direct synthesis of hydrogen peroxide, J. Catal., 2012, 292(4), 227–238 CrossRef CAS.
- Y. Zhu, X. Kong and H. Zheng, et al., Strong metal-oxide interactions induce bifunctional and structural effects for Cu catalysts, Mol. Catal., 2018, 458, 73–82 CrossRef CAS.
- C. Changzhen, Y. Yiquan and X. Pianpian, et al., TPD, TPO, and TPR Studies of a Modified Copper-Based Catalyst XNC208 for Methanol Synthesis, J. Xiamen Univ. Nat. Sci., 1995, 34(04), 566–571 Search PubMed.
- X. Ren, Y. Quan and W. Yang, Highly efficient super activated carbon supported ultra-low loading copper catalyst for the oxidative carbonylation of methanol to dimethyl carbonate, Mol. Catal., 2022, 531, 112694 CrossRef CAS.
- Z. He, H. Lin and P. He, et al., Effect of boric oxide doping on the stability and activity of a Cu-SiO2 catalyst for vapor-phase hydrogenation of dimethyl oxalate to ethylene glycol, J. Catal., 2011, 277(1), 54–63 CrossRef CAS.
- Y. Zhao, H. Zhang and Y. Xu, et al., Interface tuning of Cu+/Cu0 by zirconia for dimethyl oxalate hydrogenation to ethylene glycol over Cu/SiO2 catalyst, J. Energy Chem., 2020, 49, 248–256 CrossRef.
- D. Wang, C. Zhang and M. Zhu, et al., Highly Active and Stable ZrO2 -SiO2 -Supported Cu-Catalysts for the Hydrogenation of Dimethyl Oxalate to Methyl Glycolate, ChemistrySelect, 2017, 2(17), 4823–4829 CrossRef CAS.
- Z. Bian, W. Zhong and Y. Yu, et al., Cu/SiO2 derived from copper phyllosilicate for low-temperature water-gas shift reaction: role of Cu+ sites, Int. J. Hydrogen Energy, 2020, 45(51), 27078–27088 CrossRef CAS.
- A. José and J. Kim, et al., Reduction of CuO in H: In Situ Time-Resolved XRD Studies, Catal. Lett., 2003, 85(3–4), 247–254 Search PubMed.
- D. Hong, X. Ma and M. Jiang, et al., Highly efficient Cu/SiO2 catalyst derived from ethanolamine modification for furfural hydrogenation, Appl. Catal., A, 2020, 598, 117598 CrossRef.
- J. Gong, H. Yue and Y. Zhao, et al., Synthesis of ethanol via syngas on Cu/SiO2 catalysts with balanced Cu0 -Cu+ sites, J. Am. Chem. Soc., 2012, 134(34), 13922–13925 CrossRef CAS PubMed.
- B. Liu and X. Zhou, et al., Enhancing polyol/sugar cascade oxidation to formic acid with defect rich MnO2catalysts, Nat. Commun., 2023, 14(1), 4509 CrossRef PubMed.
- S. Cheng, T. Meng and D. Mao, et al., Selective Hydrogenation of Dimethyl Oxalate to Methyl Glycolate over Boron-Modified Ag/SiO2 Catalysts, ACS Omega, 2022, 7(45), 41224–41235 CrossRef CAS PubMed.
- D. Wang, C. C. Zhang and M. Zhu, et al., Highly Active and Stable ZrO2 -SiO2 -Supported Cu-Catalysts for the Hydrogenation of Dimethyl Oxalate to Methyl Glycolate, ChemistrySelect, 2017, 2(17), 4823–4829 CrossRef CAS.
- M. Abbas, J. Wang and P. Stelmachowski, et al., Rational design of hydroxyapatite/graphite-supported bimetallic Cu-M (M = Cu, Fe, Co, Ni) catalysts for enhancing the partial hydrogenation of dimethyl oxalate to methyl glycolate, Catal. Sci. Technol., 2023, 13(11), 3270–3281 RSC.
- M. Abbas, Z. Chen and J. Zhang, et al., Highly dispersed, ultra-small, and noble metal-free Cu nanodots supported on porous SiO2 and their excellent catalytic hydrogenation of dimethyl oxalate to methyl glycolate, New J. Chem., 2018, 42, 10290–10299 RSC.
- Y. Xi, Y. Hai and D. Yao, et al., Zn-modified copper silicate nanotube-assembled hollow sphere as a high-performance nanoreactor for the hydrogenation of methyl acetate to ethanol, Mol. Catal., 2022, 532, 112708 CrossRef CAS.
- M. Zhao, H. Yan and R. Lu, et al., Insight into the Selective Oxidation Mechanism of Glycerol to 1,3-Dihydroxyacetone over AuCu-ZnO Interface, AIChE J., 2022, 11(68), e17833 CrossRef.
|
| This journal is © The Royal Society of Chemistry 2024 |

 Open Access Article
 This Open Access Article is licensed under a Creative Commons Attribution-Non Commercial 3.0 Unported Licence
 ,
Weihua Shen* and
Yunjin Fang*
,
Weihua Shen* and
Yunjin Fang*