
 Open Access Article
 This Open Access Article is licensed under a Creative Commons Attribution-Non Commercial 3.0 Unported Licence
Enhanced microwave absorption performance of Fe3Al flakes by optimizing the carbon nanotube coatings†
Xixi Luo *a,
Hui Xie*a,
Jing Caoa,
Yaru Luab,
Shiping Taoa,
Zhixing Menga,
Lingna Pua,
Liyang Suna,
Pengjia Hea and
Ziyan Liua
*a,
Hui Xie*a,
Jing Caoa,
Yaru Luab,
Shiping Taoa,
Zhixing Menga,
Lingna Pua,
Liyang Suna,
Pengjia Hea and
Ziyan Liua
aSchool of Materials Engineering, Xi'an Aeronautical University, Xi'an 710077, China. E-mail: luoxixi@xaau.edu.cn; xiehui@xaau.edu.cn
bSchool of Chemistry and Chemical Engineering, Northwestern Polytechnical University, Xi'an 710072, China
First published on 2nd April 2024
Abstract
Fe3Al is a good magnetic loss absorber for microwave absorption. However, due to the relatively high density and poor impedance matching ratio, the potential of Fe3Al cannot be fully released. Herein, a dielectric loss absorber of carbon nanotubes (CNTs) is coupled with Fe3Al to form Fe3Al/CNTs composite absorbers. CNTs are randomly tangled and coated on the surface of the Fe3Al flakes, forming a connecting conductive network. By carefully tuning the content of CNTs, the optimized Fe3Al/CNTs composite absorber with 1.5% of CNTs can combine both magnetic loss and dielectric loss mechanisms, thus achieving an impedance matching ratio close to 1 while keeping strong attenuation for enhanced microwave absorption. As a result, an effective absorption bandwidth (RL ≤ −10 dB) of 4.73 GHz at a thickness of 2 mm is achieved.
1. Introduction
The development of efficient electromagnetic (EM) wave absorption materials is of significance in both military and civil applications.1–4 Magnetic loss absorbers such as metals, alloys, and spinel ferrites have shown great potential as efficient EM wave absorption materials.5–10 In particular, Fe3Al-based intermetallic compounds have attracted increasing attention as good magnetic loss absorbers due to their high permeability, low electrical conductivity, excellent oxidation resistance, and good corrosion resistance.11–15 Tuning the morphology and order degree of Fe3Al can significantly affect its EM wave absorption performance. For example, annealing Fe3Al flakes at 500 °C generated the most DO3 superlattice structure, exhibiting an effective absorption bandwidth (RL ≤ −10 dB) of 7.2 GHz with a thickness of 1.35 mm.16 Nevertheless, some issues such as relatively high density and unsatisfied EM wave absorption properties should be properly addressed for possible scale-up applications. To achieve excellent EM wave absorption performance, effective impedance matching and strong attenuation are important. Generally, magnetic loss absorbers exhibit good attenuation but poor impedance matching.17–19 A proper combination of magnetic loss absorbers and dielectric loss absorbers is an efficient approach to increase the EM wave absorption performance.However, light weight is also important for practical applications specially in the aeronautic and astronautic fields.20–23 In this regard, carbon nanotubes (CNTs) are one of the good candidates as dielectric loss absorbers to be coupled with magnetic loss absorbers due to the low density, high aspect ratio, and interesting electrical properties.24 For example, a composite absorber composed of mesoporous carbon hollow sphere (MCHS)@Co@carbon nanotubes (CNTs) was fabricated, and the CNTs functioned as electron transportation channels to reinforce conductive loss, leading to a strong absorption intensity of −37.3 dB and a wide effective absorption bandwidth of 8.0 GHz.25 Coiled carbon nanotubes (CCNTs) were coated using CoFe2O4 (CFO) nanoparticles to form CCNTs/CFO composites, which exhibited a minimum reflection loss of −14 dB in the frequency range of 2–18 GHz, and an effective absorption bandwidth of 4.0 GHz.26 In another example, nano-Fe3O4 compact-coated CNTs (FCCs) and Fe3O4 loose-coated CNTs (FLCs) were fabricated by a solvothermal method, and the FCCs with the optimized CNT to Fe3+ ratio exhibited a minimum reflection loss of −28.7 dB with a thickness of 1 mm and an effective absorption bandwidth of 8.3 GHz.27 CoNi nanoparticles encapsulated within the nitrogen-doped CNT (NCNT) arrays were grown on ultrathin rGO sheets (3D CoNi/NGCT), which showed excellent microwave absorption properties.28 N-doped carbon hollow spheres supported on N-doped carbon nanotubes (Ni@NCNT/NCHSs) with a thickness of 1.6 mm, showed an RLmin of − 64.75 dB and an effective absorption bandwidth of 4.17 GHz.29 Similarly, N-doped carbon fibers (NCF) with N-doped carbon nanotubes (NCNTs) vertically grown on the surface of NCF exhibited an absorption bandwidth of 4.0 GHz and a minimum reflection loss of − 49.56 dB at a thickness of 1.5 mm.30 Hierarchical nitrogen-doped carbon hollow microspheres assembled with loose and porous magnetic carbon sheets were prepared by a facile two-step method, exhibiting an effective absorption bandwidth of ∼4.00 GHz at a thickness of 2.5 mm and an RLmin of −39.87 dB.31 Inspired by these previous studies, the incorporation of CNTs may be an effective strategy to address the high density issue of Fe3Al while enhancing the EM wave absorption performance.
Herein, we report a facile mechanical blending method for the fabrication of Fe3Al/CNT composite absorbers with different CNT contents. The CNTs can form a connecting conductive network coated on the surface of Fe3Al flakes. With the optimized mass content of 1.5% of CNTs, the Fe3Al-1.5%CNT composite absorber can take advantage of both dielectric-loss and magnetic-loss mechanisms to promote microwave absorption, demonstrating an effective absorption bandwidth (RL ≤ −10 dB) of 4.73 GHz at a thickness of 2 mm. The excellent EM wave absorption performance is attributed to the proper impedance matching ratio and strong attenuation. The low absorber thickness, high reflection loss and relatively broad absorption bandwidth of the Fe3Al/CNT composite absorber demonstrate great potential for practical applications.
2. Experimental section
2.1 Synthesis of Fe3Al/CNT composite absorbers
Fe3Al flakes were prepared according to our previous study.16 A mechanical alloying method was used to prepare a Fe(Al) solid solution. More specifically, Fe and Al metal powders with an atomic ratio of 7![[thin space (1/6-em)]](https://www.rsc.org/images/entities/char_2009.gif) :3 were mixed in a 500 mL zirconium oxide ball milling tank, which was then located in a QM-3SP2 high-energy ball milling machine (Nanjing University). Zirconium oxide grinding balls with sizes of 1–10 mm were used, and the ball-to-powder weight ratio was 15:1. The ball milling time was 50 h, and the rotation speed was 400 rpm. To avoid the oxidation of the samples during the ball milling process, the ball milling tank was vacuumed and filled with Ar as the protective gas. When the ball milling process was finished and cooled to room temperature, the ball milling tank was transferred to a glove box filled with Ar. Then, the ball milling tank was opened in the glove box and the obtained powder was taken out to avoid any possible oxidation.
:3 were mixed in a 500 mL zirconium oxide ball milling tank, which was then located in a QM-3SP2 high-energy ball milling machine (Nanjing University). Zirconium oxide grinding balls with sizes of 1–10 mm were used, and the ball-to-powder weight ratio was 15:1. The ball milling time was 50 h, and the rotation speed was 400 rpm. To avoid the oxidation of the samples during the ball milling process, the ball milling tank was vacuumed and filled with Ar as the protective gas. When the ball milling process was finished and cooled to room temperature, the ball milling tank was transferred to a glove box filled with Ar. Then, the ball milling tank was opened in the glove box and the obtained powder was taken out to avoid any possible oxidation.
A vacuum tube furnace (OTF-1200X, Hefei Kejing) was used to anneal the above-obtained powder. Before the annealing process, the tube furnace was firstly vacuumed to 10−3 Pa and then filled with Ar as the protective gas. The annealing temperature was 500 °C, and maintained for 2 h. After naturally cooling to room temperature, the ordered Fe3Al powder was obtained.
Then, a mechanical blending method was used to prepare the Fe3Al/carbon nanotubes (CNTs) composite powders, and the contents of CNTs were controlled as 0%, 0.5%, 1% and 1.5% (mass ratio) of Fe3Al. According to the amount of CNTs added, the obtained four Fe3Al/CNTs composite powders were denoted as Fe3Al, Fe3Al-0.5%CNT, Fe3Al-1%CNT, and Fe3Al-1.5%CNT. To ensure the homogeneous dispersion, sodium dodecylbenzene sulfonate (SDBS) was selected as the dispersant and dissolved in a water bath at 80 °C. Fe3Al and CNT suspensions were prepared with the ratios of SDBS:Fe3Al = 1:10 and SDBS:CNTs = 10:1. The above suspensions were mixed under ultrasonication and mechanical stirring together for 2 h. The obtained powders were centrifuged and dried in a vacuum oven, and Fe3Al/CNTs composite powders were obtained.
All the synthesis samples were repeated three times and scanning electron microscopy was conducted to confirm the morphology of the samples.
2.2 Characterization
The morphology of the powders was characterized by scanning electron microscopy (TESCAN MIRA LMS). The crystal structure and phase composition of the powders were analyzed by a Bruker D8-Advance X-ray electron diffractometer (Cu Kα radiation with an accelerating voltage of 40 kV and a current of 35 mA). The CNT signals in the composite powders were characterized by a Thermo Scientific Nicolet iS5 infrared spectrometer. For measurement of the microwave absorption properties, the Fe3Al/CNTs composite powder was mixed in paraffin wax at the mass ratio of 4:1, which was then pressed into a ring specimen with an inner diameter of φ 3.04 mm and an outer diameter of φ 7.00 mm.32 For comparison, other samples were prepared with the Fe3Al-1.5%CNT composite/paraffin wax mass ratios of 3:2, 2:3, and 1:4, respectively. The electromagnetic parameters in the range of 2–18 GHz were determined using a vector network analyzer (N5225B) and a coaxial line test method. To collect more reliable results, three samples were prepared for each Fe3Al/CNTs composite with the same CNT content. Data would be selected only if all 3 samples showed similar results.
3. Results and discussion
3.1 Morphology analysis
The morphologies of Fe3Al/CNTs composite absorbers at different CNT additions are shown in Fig. 1. It can be clearly seen that Fe3Al powder obtained after high-energy ball milling and ordering treatment is a lamellar-like structure with a thickness of about 100 nm, and the size of each flake is around 600 nm (Fig. 1a). CNTs have a tubular structure with smooth walls, which are randomly distributed on the surfaces of the Fe3Al flakes. As shown in Fig. 1b, when the addition amount of CNTs is 0.5%, CNTs are coated on the surface of the Fe3Al flakes. In addition, CNTs are tangled together to form a relatively loose connecting conductive network. When the CNT content is 1%, more CNTs can be observed, the intermolecular van der Waals forces cause the aggregation of the CNTs, as shown in Fig. 1c. When the CNT content is increased to 1.5%, a thicker CNT coating can be observed, and the Fe3Al flake is fully covered by CNTs (Fig. 1d). To understand the interfacial interaction between Fe3Al flakes and CNTs, the Fe3Al-1.5%CNT sample was characterized by transmission electron microscopy (TEM). As shown in Fig. 1e, CNTs are tangled together and well-coated on the Fe3Al flakes. The tube structures of the surface CNTs can be clearly observed in Fig. 1f.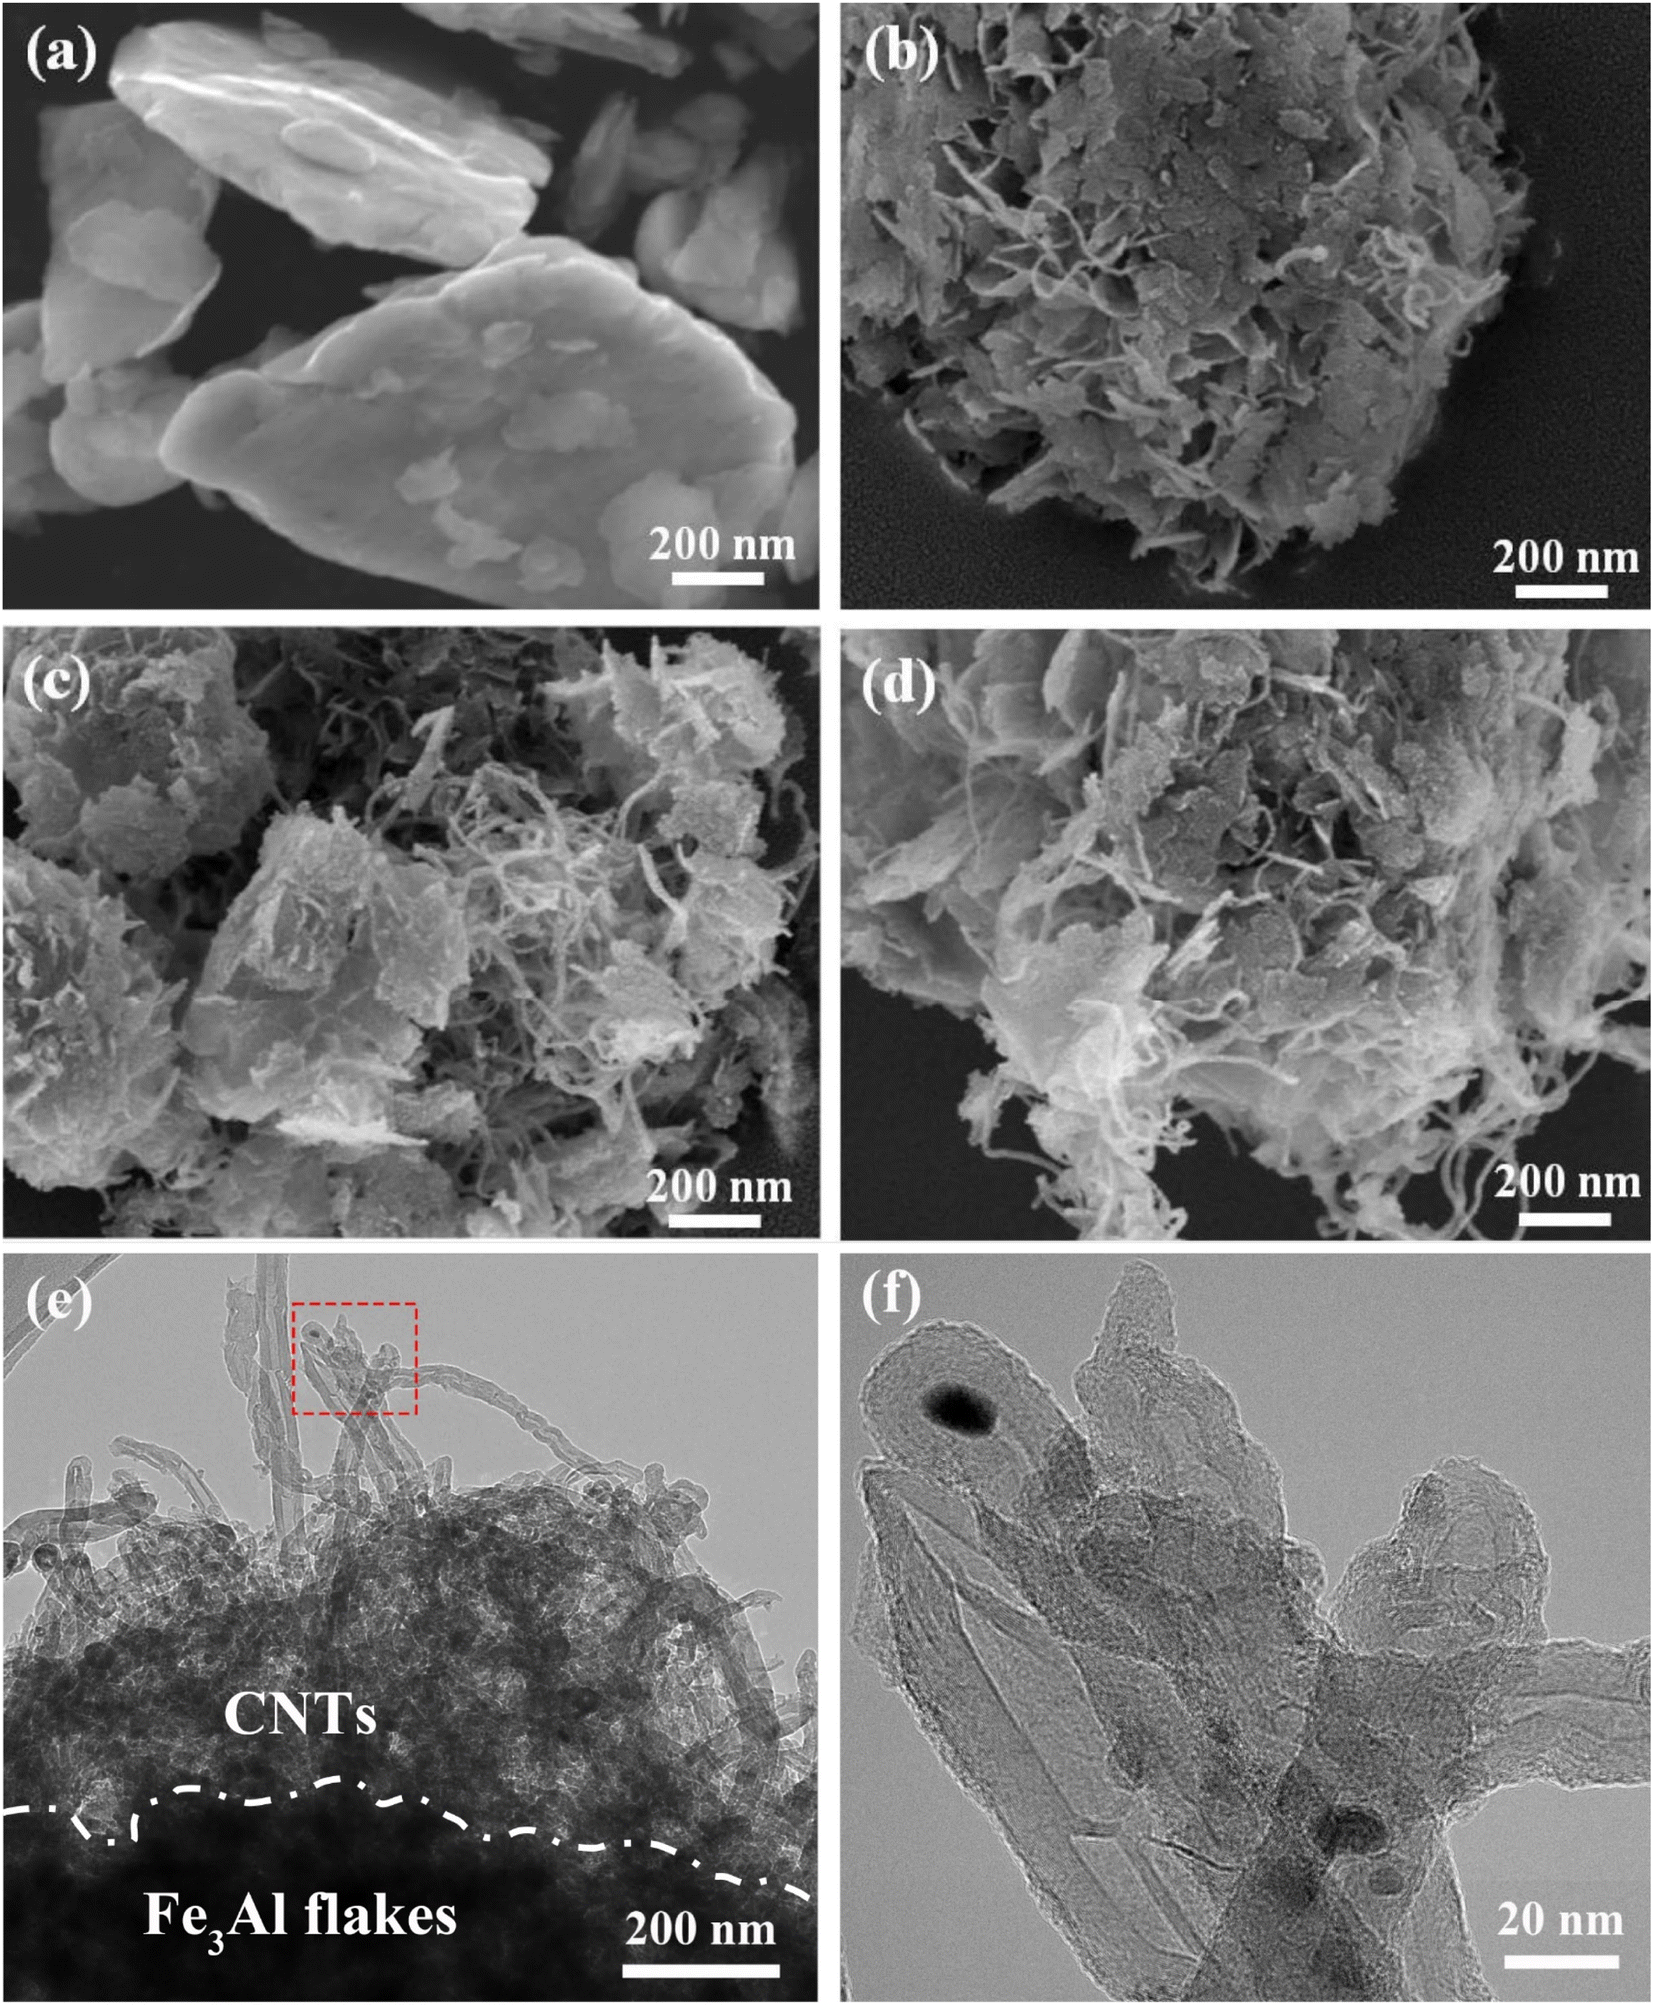 | ||
| Fig. 1 Microstructure of Fe3Al/CNTs composite absorbers obtained at different levels of CNT additions. (a) Fe3Al, (b) Fe3Al-0.5%CNT, (c) Fe3Al-1%CNT, and (d) Fe3Al-1.5%CNT. (e) TEM image of Fe3Al-1.5%CNT. (f) Enlargement of (e) in the selective area (red square). | ||
3.2 Phase analysis
Crystal structures of the Fe3Al/CNTs composite absorbers were characterized by X-ray diffraction (XRD). As can be seen from Fig. 2, the XRD patterns of the Fe3Al/CNTs composite absorbers with four different additions of CNTs were very similar. The characteristic diffraction peaks appeared at 2θ of 47.16°, 67.53° and 84.81°, which can be assigned to the Fe3Al phase.33 It should be mentioned that the CNT signal cannot be observed in the XRD patterns, possibly due to the very small content that is out of the detection limit of the instrument. However, the one-dimensional morphology of CNTs can be clearly observed in the SEM images (Fig. 1b–d), indicating the successful loading of CNTs in the Fe3Al/CNTs composite absorbers.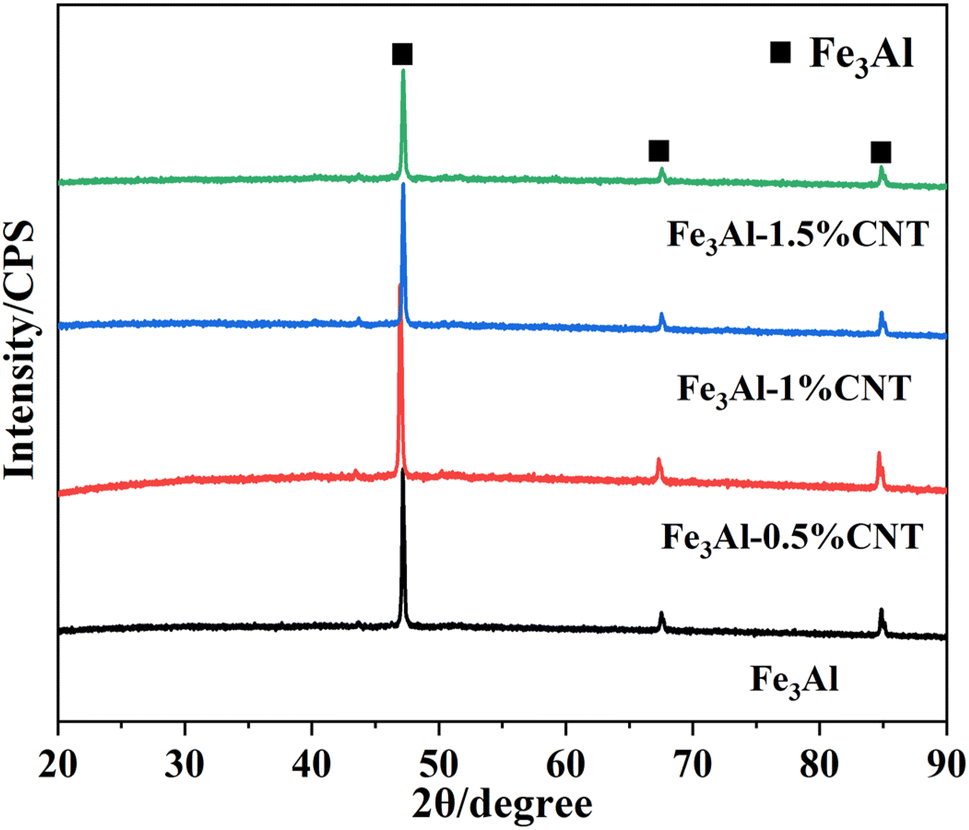 | ||
| Fig. 2 XRD patterns of the Fe3Al/CNTs composite absorbers obtained with different CNT additions. | ||
3.3 Fourier transform infrared spectroscopy analysis
Since CNTs cannot be accurately determined by XRD, Fourier transform infrared (FTIR) spectra of the samples were collected for further characterization of CNTs. As shown in Fig. 3, the FTIR spectra of the Fe3Al/CNTs composite absorbers show significant changes in the peaks at the wavenumber ranges of 1500–1700 cm−1, 2800–3000 cm−1, and 3400–3500 cm−1, compared to the pristine Fe3Al powder. With the increased content of CNTs, these signals become stronger. Compared to the standard FTIR spectrum of CNTs,34–36 it was found that the positions of the enhanced peaks are those of carbon nanotubes, which proves the presence of carbon nanotubes in the Fe3Al/CNTs composite absorbers.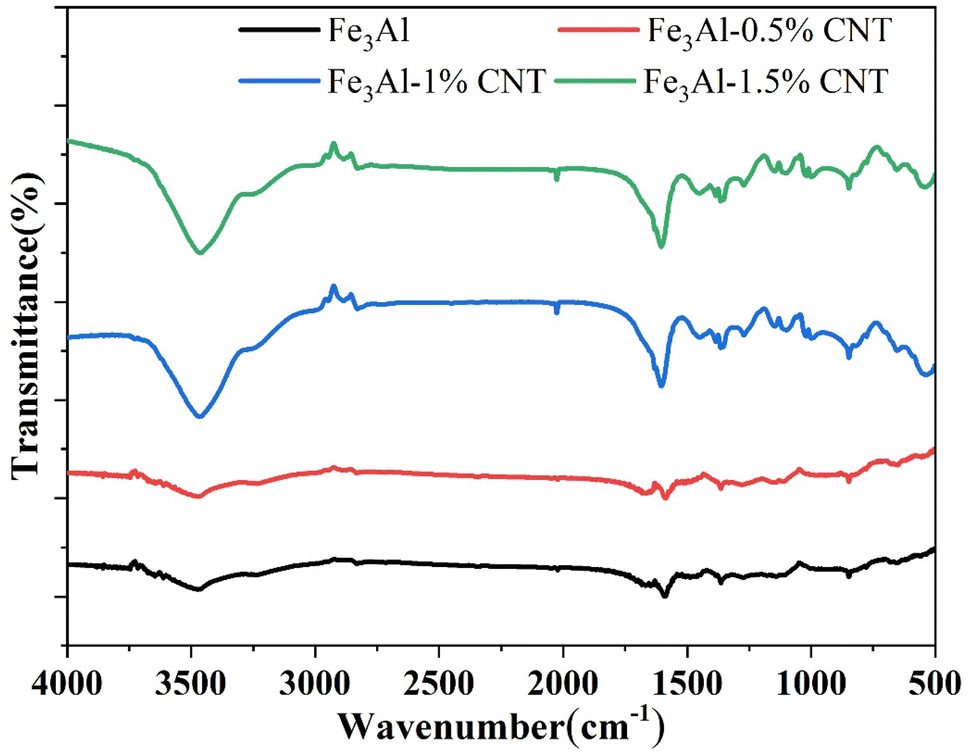 | ||
| Fig. 3 FTIR spectra of the Fe3Al/CNTs composite absorbers. | ||
3.4 The complex permittivity and permeability spectra
Fig. 4 shows the curves of four electromagnetic parameters of the Fe3Al/CNTs composite absorbers obtained at different levels of CNT additions with respect to frequency. As shown in Fig. 4a, the real part of the dielectric constant (ε′) of Fe3Al starts at 2 GHz with a value of 9.4, then slightly increases to 9.8 at 8.8 GHz with some fluctuations, and decreases to 9 at 10.8 GHz, then slightly increases to 9.9 at around 17.5 GHz with some fluctuations. While for the Fe3Al/CNTs composite absorbers, the real part of the dielectric constant (ε′) shows a decreasing trend with the increase of frequency. In particular, the ε′ values of the Fe3Al-0.5%CNT and Fe3Al-1%CNT samples significantly decrease in the frequency range of 2–18 GHz compared to that in their Fe3Al counterpart. The addition of highly conductive CNTs will increase the conductivity of the absorber, and thus reduce the dielectric properties of the absorber, leading to a significant decrease of the ε′ values.23,24 However, when the CNT content is further increased to 1.5%, the CNTs will form a conductive network in the Fe3Al-1.5%CNT sample, thus inducing strong interfacial polarization, leading to the increase of the ε′ values.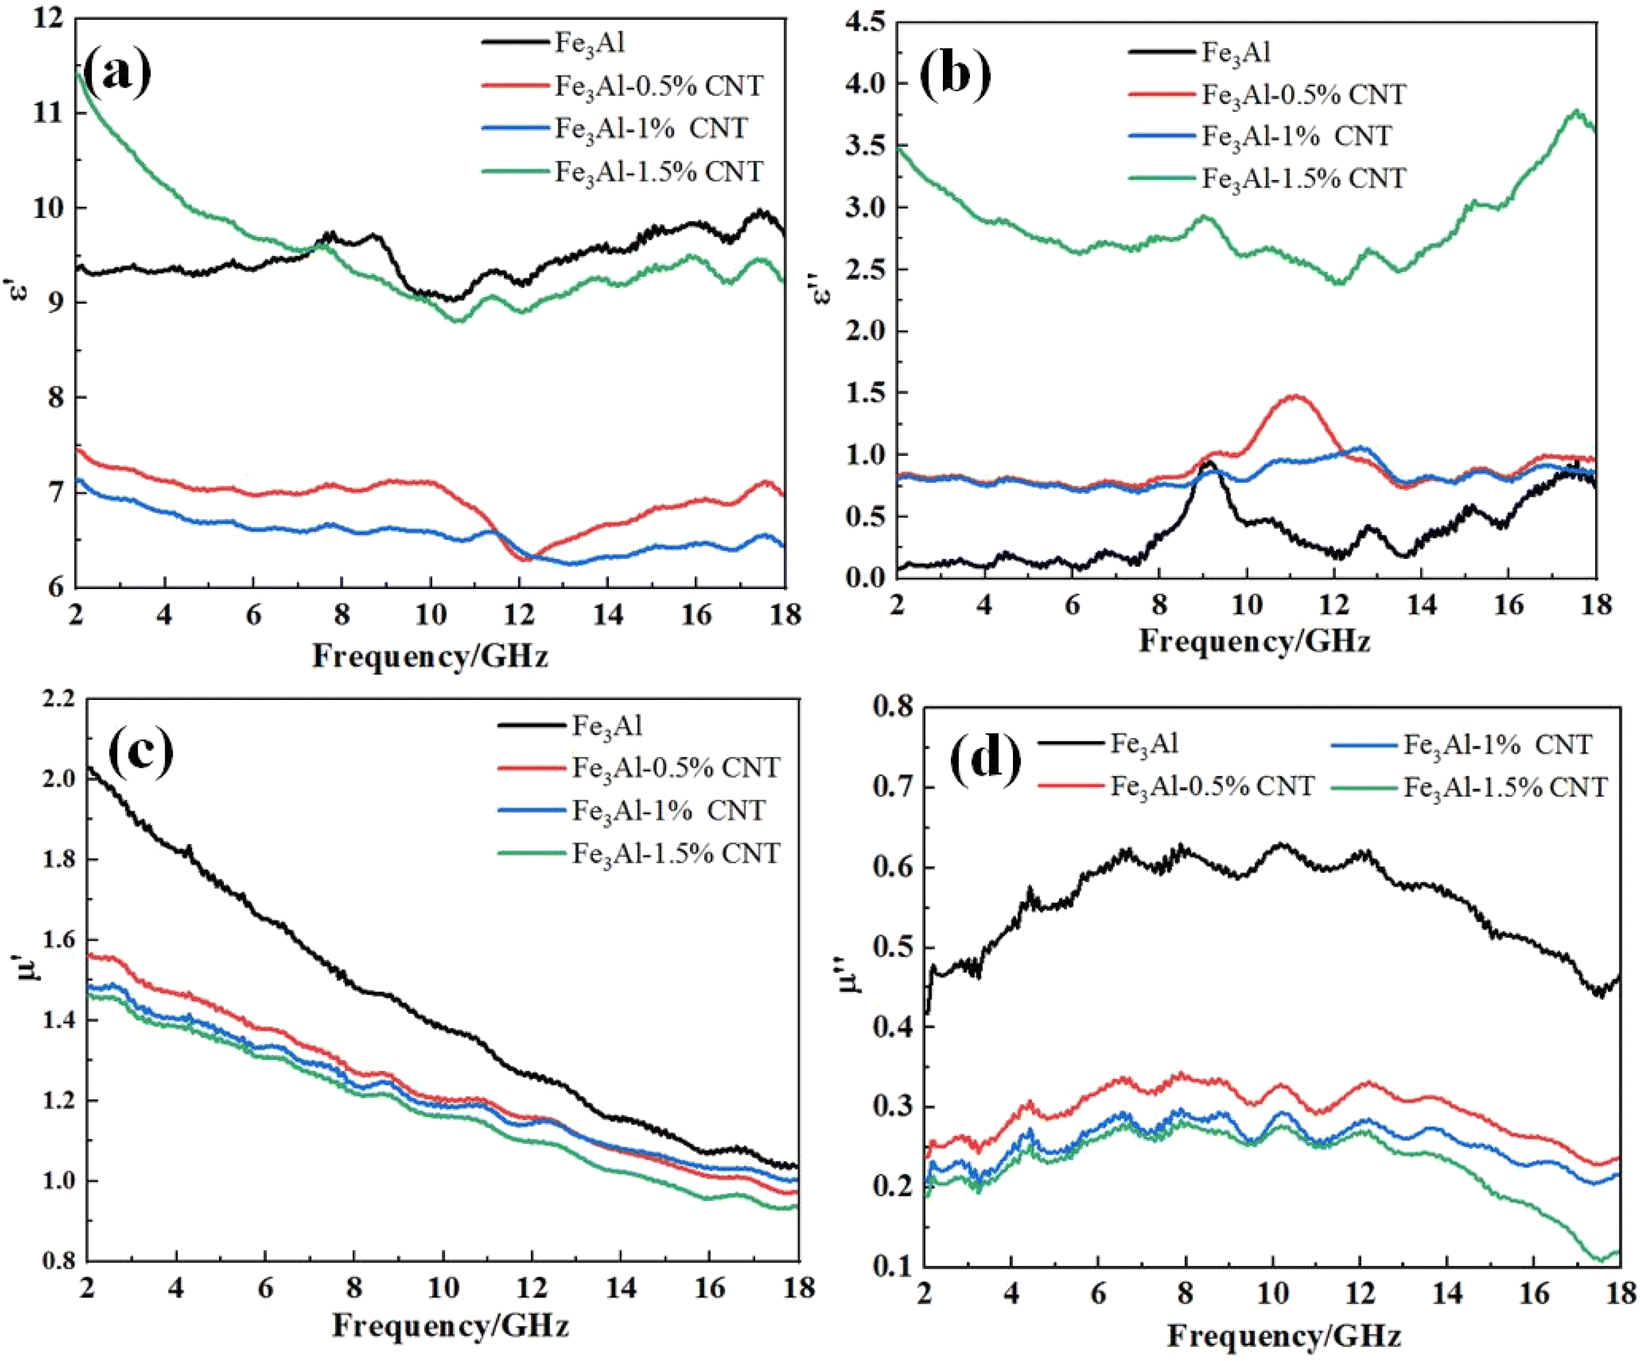 | ||
| Fig. 4 Frequency dependence of (a) real and (b) imaginary parts of complex permittivity, frequency of dependence of (c) real and (d) imaginary parts of complex permeability curves of the Fe3Al/CNTs composite absorbers. | ||
As revealed in Fig. 4b, the imaginary part (ε′′) of the dielectric constant of the Fe3Al/CNTs composite absorber increases with the increase of CNTs from 2 to 18 GHz, compared with that of the pristine Fe3Al. Since the imaginary part reflects the ability to lose electromagnetic waves,37 the addition of CNTs improves the overall dielectric loss capability of the composite absorbers. The imaginary part of the dielectric constant of the Fe3Al-1.5%CNT composite absorber is the largest, and its value is in the range of 2.4–3.8. The significant increase of the ε′′ values in Fe3Al-1.5%CNT is attributed to the strong interfacial polarization induced by the conductive network formed by the surface CNTs. Therefore, the addition of 1.5% of CNTs can exhibit the largest dielectric loss capability for microwave absorption.
Fig. 4c and d are the magnetic permeability real part μ′ and magnetic permeability imaginary part μ′′ versus frequency curves of the Fe3Al/CNTs composite absorbers. It can be observed that the real part of the complex permeability (μ′) of Fe3Al is around 2.02 at 2 GHz, and then gradually decreases to 1.04 at 18 GHz. With the addition of CNTs, the Fe3Al-0.5%CNT, Fe3Al-1%CNT, and Fe3Al-1.5%CNT samples show substantially decreased μ′ values of 1.58, 1.49, and 1.47, respectively. Since CNTs are not magnetic materials, the addition of CNTs will decrease the magnetic properties of the composite absorber, leading to a decreased capacity to store and dissipate magnetic energy.38–40 Combined with the morphology characteristics shown in Fig. 1, the tubular CNT-coated Fe3Al flake structure weakens the magnetic properties of Fe3Al to some extent. Thus, with the increase of the CNT content, both the real part of magnetic permeability μ′ and the imaginary part of magnetic permeability μ′′ decrease. In addition, both μ′ and μ′′ change with the change of the frequency is caused by the frequency dispersion effect.41
Fig. 5 shows the curves of dielectric loss tangent (tanδε) and magnetic loss tangent (tanδμ) versus the frequency of the CNTs/Fe3Al composite absorbers obtained after different levels of CNT additions. It is commonly accepted that tanδε = ε′′/ε′ and tanδμ = μ′′/μ′ represent the dielectric loss capability and magnetic loss capability of an absorber, respectively. The larger value indicates the stronger attenuation capability of the material for electromagnetic waves. As demonstrated in Fig. 5a, the dielectric loss tangent (tanδε) of the samples shows a wave-like increase with the increase in frequency. To summarize, the addition of CNTs makes the tanδε value of the composite absorbers increase. The main dielectric loss mechanisms of the Fe3Al/CNTs composite absorbers include the polarization effect generated by the unsaturated dangling bonds on the surface of the carbon nanotubes, and the conductive network formed by the connection of the CNTs as well, which improves the migration rate of the carriers, and thus increasing the dielectric loss of the material.
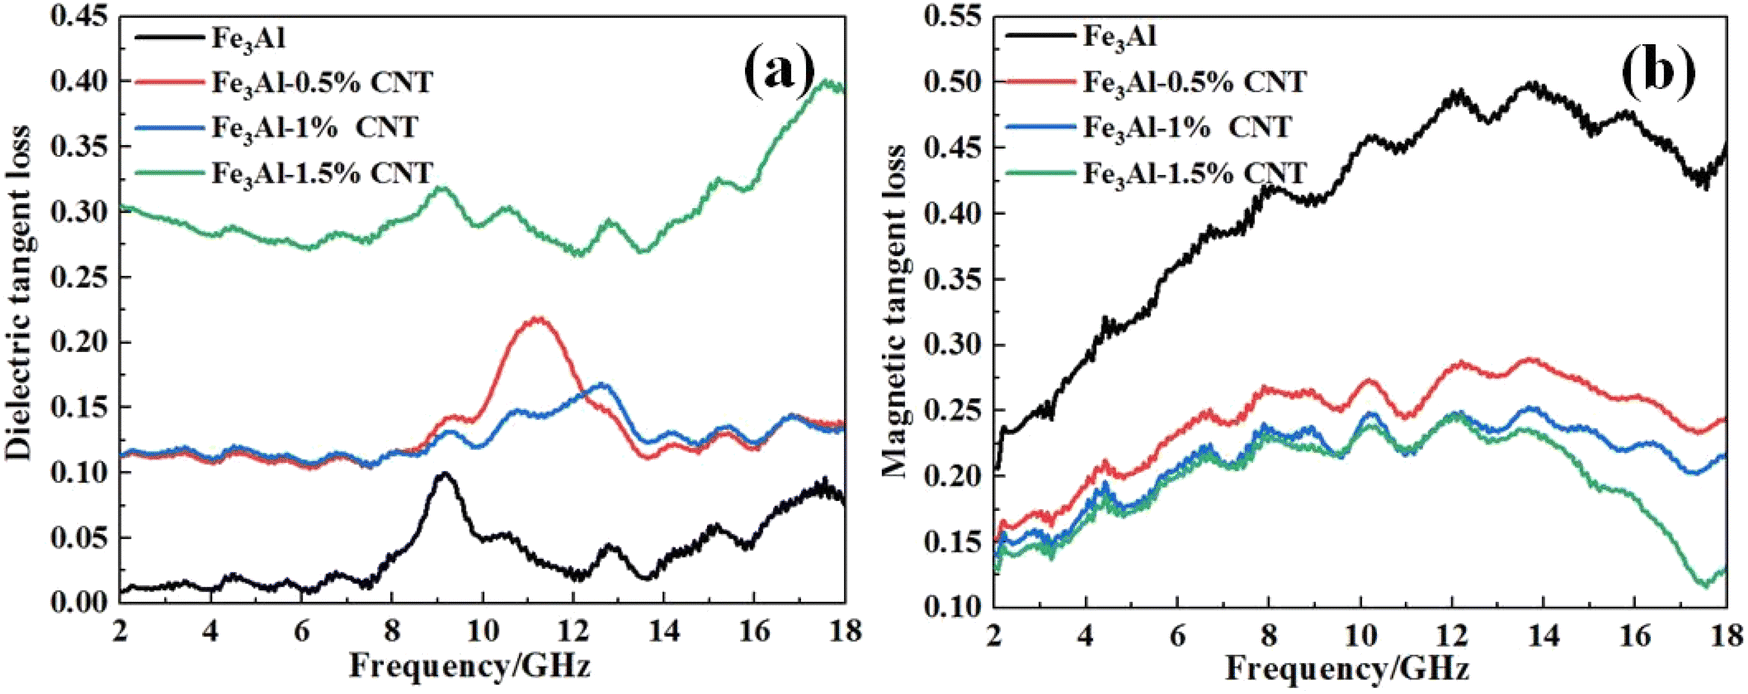 | ||
| Fig. 5 Frequency dependence of (a) dielectric loss tangent and (b) magnetic loss tangent curves of the Fe3Al/CNTs composite absorbers. | ||
Fig. 5b shows the curves of the magnetic loss tangent (tanδμ) versus the frequency of four composite absorbers. More specifically, the values of tanδμ increase with the increase of the frequency, reaching a maximum value at 12–14 GHz. With the further increase of the frequency, tanδμ shows a decreasing trend. The reason for this phenomenon is due to the internal domain wall resonance and eddy current loss of the Fe3Al magnetic loss absorber. Note that the introduction of CNTs does make Fe3Al less capable for the magnetic loss of electromagnetic waves. Thus, with the increased content of CNTs, the tanδμ decreases.
Generally, for the composite absorbers system containing two absorbers with completely different loss mechanisms, the comparable values of tanδε and tanδμ can achieve excellent electromagnetic wave absorption performance. If the values of tanδε and tanδμ are greatly different, the impedance mismatch of the materials will occur. As can be observed from Fig. 5, tanδε and tanδμ of Fe3Al are significantly different. With the addition of CNTs, the difference between tanδε and tanδμ of all Fe3Al/CNTs composite absorbers is smaller, indicating that CNTs can improve the impedance matching for microwave absorption.
3.5 Absorbing properties
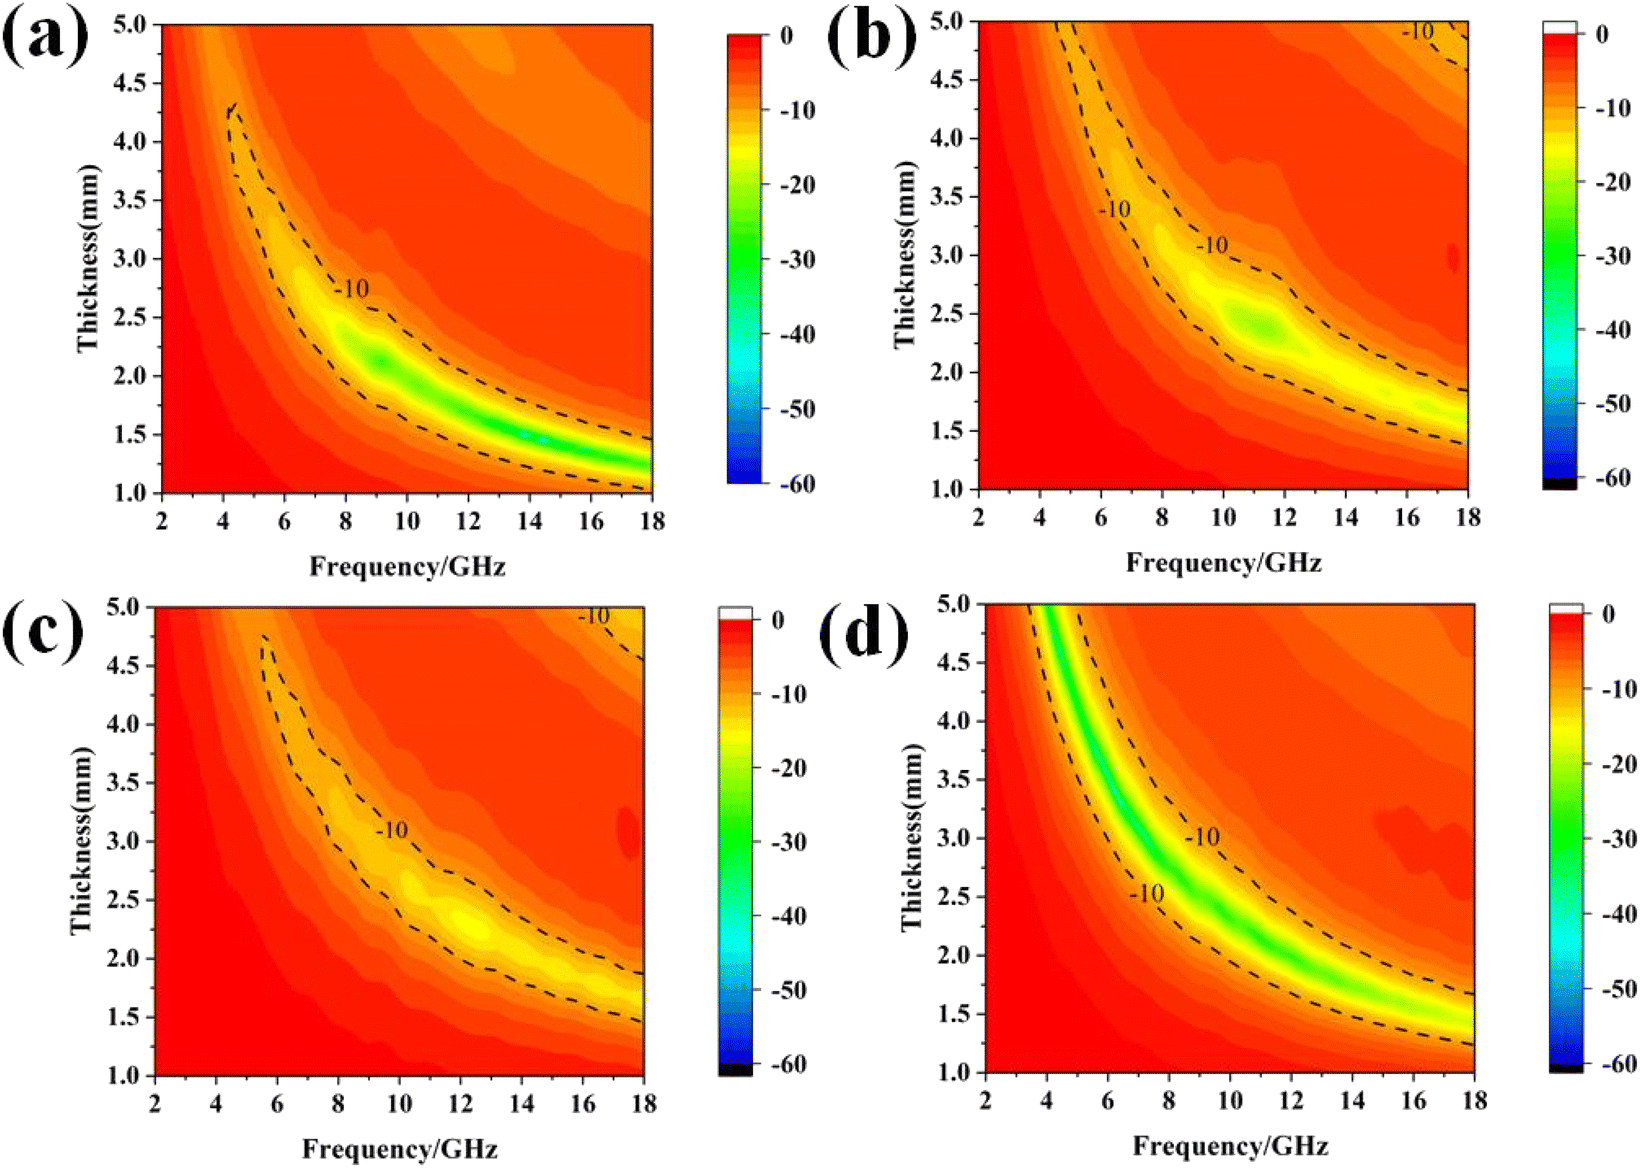
Fig. 6 shows the three-dimensional reflection loss diagrams of the Fe3Al/CNT composite absorbers with different levels of CNT additions at frequencies from 2 to 18 GHz with a thickness range of 1–5 mm, which is calculated according to the simulation of the electromagnetic parameters. It can be observed that the minimum reflection loss values of the four composite absorbers are less than −10 dB, which means that up to 90% of the incident electromagnetic wave can be absorbed, exhibiting excellent electromagnetic wave absorption performance. For the pristine Fe3Al, the minimum reflection loss peak of −52.42 dB occurs at a thickness of 1.45 mm and a frequency of 14.45 GHz. However, with the addition of CNTs, the minimum reflection loss peaks of −21.22, −18.53 and −50.59 dB are observed for Fe3Al-0.5%CNT, Fe3Al-1%CNT, and Fe3Al-1.5%CNT with the thicknesses of 2.45, 2.3 and 3.35 mm, respectively. | ||
| Fig. 6 Three-dimensional representation of the microwave reflection losses of the Fe3Al/CNT composite absorbers. (a) Fe3Al, (b) Fe3Al-0.5%CNT, (c) Fe3Al-1%CNT, and (d) Fe3Al-1.5%CNT. | ||
Fig. 7 shows the two-dimensional projection of the reflection loss of the Fe3Al/CNT composite absorbers. It can be observed that the maximum absorption bandwidth of Fe3Al is 5.67 GHz (12.33–18.00 GHz) when the thickness is 1.4 mm. Fe3Al-0.5%CNT shows the maximum absorption bandwidth of 5.20 (11.40–16.60 GHz) when the thickness is 2.0 mm. Fe3Al-1%CNT exhibits the maximum absorption bandwidth of 5.02 (12.40–17.42 GHz) when the thickness is 1.8 mm. As for Fe3Al-1.5%CNT, the maximum absorption bandwidth is 5.91 (12.09–18.00 GHz) when the thickness is 1.7 mm. In addition, Fe3Al exhibits strong absorption at high frequencies of 8–18 GHz, while Fe3Al-1.5%CNT exhibits strong absorption in a wider frequency range of 4–18 GHz. This phenomenon is attributed to the coupling effect between the dielectric absorbent of CNTs and the magnetic absorbent of Fe3Al.42
 | ||
| Fig. 7 Two-dimensional representation of the microwave reflection losses of Fe3Al/CNT composite absorbers. (a) Fe3Al, (b) Fe3Al-0.5%CNT, (c) Fe3Al-1%CNT, and (d) Fe3Al-1.5%CNT. | ||
The RL–f curves of the Fe3Al/CNTs composite absorbers at the same thickness of 2 mm calculated based on the transmission line theory equation are shown in Fig. 8. The effective absorption bandwidths (fE) of the four absorbers are 4.27, 5.20, 4.77 and 4.73 GHz, respectively, which indicates that with the addition of the appropriate amount of CNTs, the composite structure of the CNT-coated Fe3Al flakes can achieve the expansion of the frequency bandwidth and improvement of the wave absorbing efficiency through the double absorption mechanisms of the dielectric loss and magnetic loss. The pristine Fe3Al sample exhibits an RLmin value of −23 dB at a frequency of 10 GHz. When the CNT contents are 0.5% and 1%, the RL peaks shift to a higher frequency of 14 GHz and the RLmin values for the Fe3Al-0.5%CNT and Fe3Al-1%CNT samples are significantly decreased to −17 dB and −14 dB, respectively. However, when the CNT content is 1.5%, the RL peak negatively shifts to 12 GHz with the RLmin value significantly reduced to −27 dB.
 | ||
| Fig. 8 Microwave reflection loss of the Fe3Al/CNTs composite absorbers with a thickness of 2 mm. | ||
To evaluate the microwave absorption performance of the as-synthesized Fe3Al-1.5%CNT composite, the minimum reflection loss, the corresponding thickness and the effective bandwidth at a certain thickness of the metal, alloy and oxide-based composites reported recently are listed in Table 1. It can be observed that the comprehensive performance of the Fe3Al-1.5%CNT composite is relatively good. It should be mentioned that the mass ratio of 4:1 (equal to a filler ratio of 80 wt%) for the as-synthesized Fe3Al-1.5%CNT composite mixed with paraffin wax is necessary to obtain satisfactory performance. The microwave absorption performance of the Fe3Al-1.5%CNT composite decreases significantly with other filler ratios of 60 wt%, 40 wt%, and 20 wt% (Fig. S1, ESI†).
| Absorber | RLmin (dB) | Thickness (mm) | Effective bandwidth (GHz) RL < −10 dB | Ref. |
|---|---|---|---|---|
| Fe3Al-1.5%CNT | −50.59 | 3.35 | 5.91 (1.7 mm) | This work |
| C@NixCo1−xFe2O4 | −51 | 1.9 | 3.3 (1.9 mm) | 42 |
| Doped, conductive SiO2 nanoparticles | −55.09 | 4.2 | ∼5 (1.3 mm) | 43 |
| Ni/CNTs | −49.3 | 3.0 | 2.96 (3.0 mm) | 44 |
| Al/H2 treated TiO2 | −58.02 | 3.1 | 6.13 (1.61 mm) | 45 |
| Fe3O4@C | −64.92 | 1.75 | 4.64 (1.75 mm) | 46 |
| Mg/H2 treated TiO2 | −34.69 | 1.7 | 3.96 (0.92 mm) | 47 |
| Co@C | −53.99 | 2.28 | 6.00 (2.73 mm) | 48 |
| CoNi/C@PPy | −68.78 | 2.43 | 5.62 (2.10 mm) | 49 |
| Co@NC/Ni | −47.10 | 2.5 | 6.84 (2.5 mm) | 50 |
| C@Ni0.5Zn0.5Fe2O4 | −26.87 | 1.8 | 4.05 (1.8 mm) | 51 |
Effective impedance matching and strong attenuation are the two key factors in achieving excellent microwave absorption properties of an absorber.52–54 The synergistic effect between the magnetic loss of Fe3Al and dielectric loss of CNTs in the Fe3Al/CNTs composite absorbers can effectively increase the attenuation of the incident microwaves. Good impedance matching can ensure the incident microwave is absorbed in the absorber without reflection, while strong attenuation can convert the absorbed microwave into thermal energy or be dissipated through interference, resulting in enhanced microwave absorption performance. Generally, the impedance matching ratio is defined as Z = |Zin/Z0| (where Zin is the impedance of the absorber, and Z0 is the impedance of the free space).55–57 When the impedance matching ratio (Z) is close to 1, the absorber can absorb the maximum incident microwaves.58 Fig. 9a shows the impedance matching ratios of the Fe3Al/CNT composite absorbers with a thickness of 2 mm, it can be observed that the peak of the Z value of Fe3Al-1.5%CNT is the closest to 1 in all samples, indicating the best impedance matching to absorb more incident microwaves.
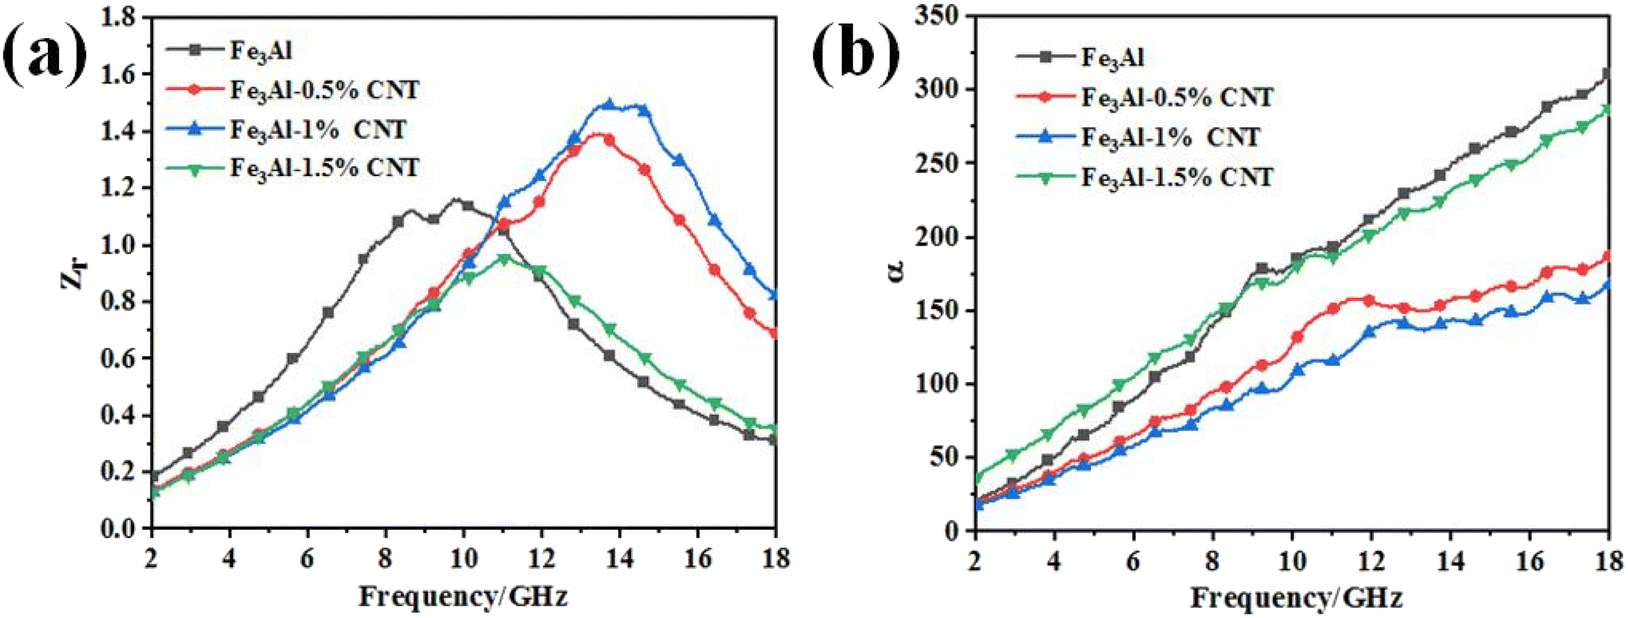 | ||
| Fig. 9 (a) Impedance matching ratio and (b) attenuation constant α of the Fe3Al/CNTs composite absorbers with a thickness of 2 mm. | ||
The attenuation constant (α) versus the frequency curves of the Fe3Al/CNT composite absorbers with a thickness of 2 mm are shown in Fig. 9b. It can be observed that the α values of all samples increase with the increase of frequency, suggesting that the absorbed microwave at a higher frequency is easier to be attenuated.59 In addition, with the addition of CNTs, the α value decreases compared to pristine Fe3Al, indicating that CNTs have some negative effect on the attenuation of the absorbed microwaves for Fe3Al. However, when the CNT content is 1.5%, the α versus frequency curve of Fe3Al-1.5%CNT is almost overlapped with that of its pristine Fe3Al counterpart, suggesting the strongest attenuation constant among all Fe3Al/CNT composite absorbers.
Based on the above analysis, the main microwave absorption mechanisms of a Fe3Al/CNT composite absorber are shown in Fig. 10. The conductive network formed by the surface CNTs can significantly increase the conductive loss, which can convert the microwave energy into heat. In addition, the interfaces between Fe3Al and CNTs generate interface polarization, which can also dissipate the microwave energy. Furthermore, the magnetic loss and dielectric loss also contribute to the absorption and attenuation of the microwaves. Therefore, the combination of CNTs with Fe3Al can effectively increase the microwave absorption performance.
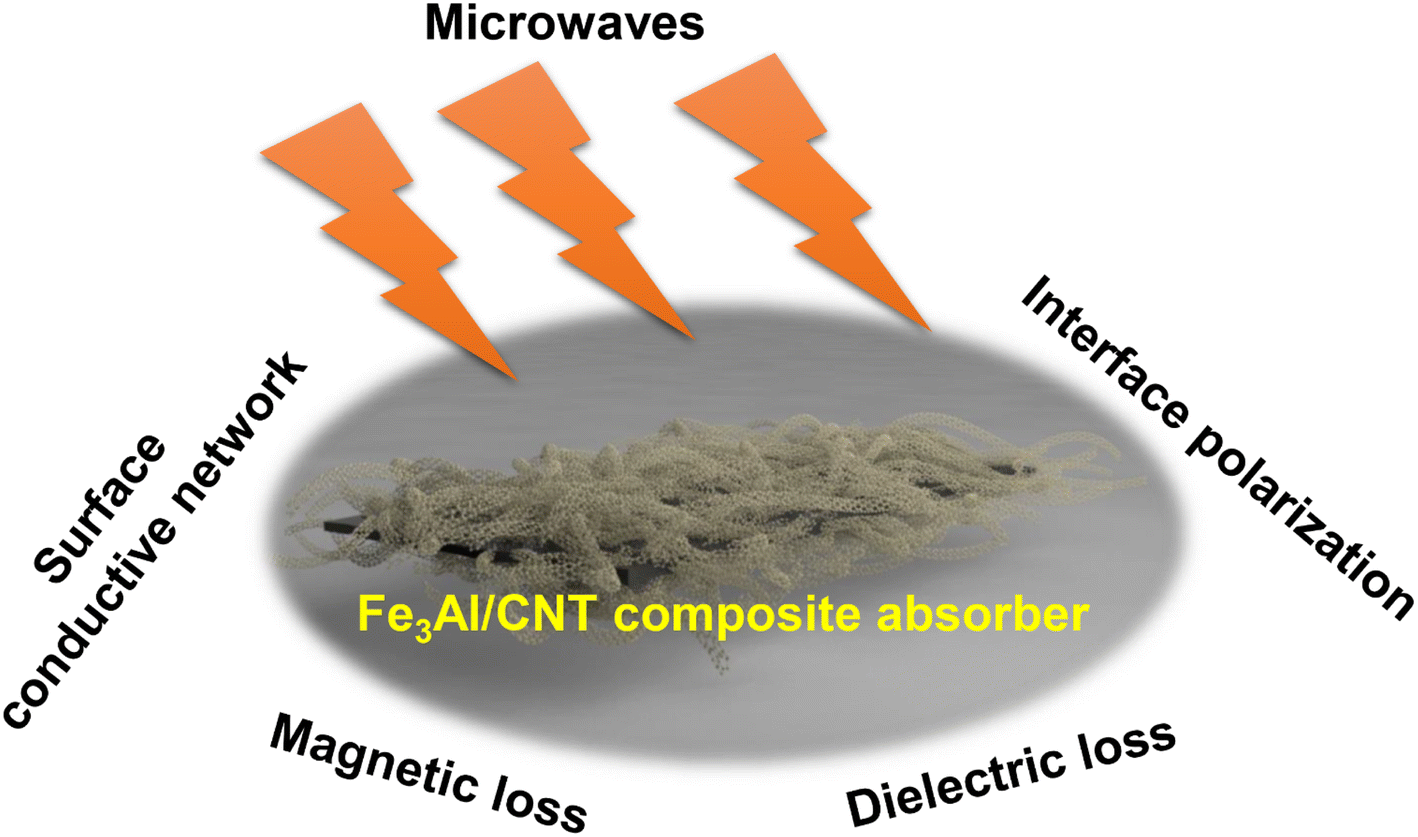 | ||
| Fig. 10 Schematic of microwave absorption in a Fe3Al/CNT composite absorber. | ||
4. Conclusion
Fe3Al/CNT composite absorbers with different CNT contents were synthesized by a mechanical blending method, and the CNTs were attached to the surface of the Fe3Al flakes. Since CNT is a dielectric-loss absorber while Fe3Al is a magnetic-loss absorber, the Fe3Al/CNT composite absorber can combine both dielectric-loss and magnetic-loss mechanisms to promote microwave absorption. In particular, the Fe3Al-1.5%CNT composite absorber has the best impedance matching ratio and the strongest attenuation constant among all the Fe3Al/CNT composite absorbers, thus exhibiting excellent microwave absorption properties, with an effective absorption bandwidth (RL ≤ −10 dB) of 4.73 GHz at a thickness of 2 mm. The results are only applicable to several grams of samples prepared in the lab. Uniformity and consistency should be considered for possible scale-up applications in future.Consent for publication
All authors agree to the submission and publication of article materials.Author contributions
All authors contributed meaningfully to all aspects of experimentation, analysis and composition.Conflicts of interest
All the authors have no competing interests to declare.Acknowledgements
This work was financially supported by the National Natural Science Foundation of China (No. 52005384), the Innovative Talents Promotion Project of Shaanxi Province (No. 2022KJXX-45), the Youth Innovation Team Project of Shaanxi Universities (No. 23JP073), and Xi'an Scientific and Technological Project (No. 22GXFW0055).References
- Z. Zhou, D. Lan, J. Ren, Y. Cheng, Z. Jia, G. Wu and P. Yin, J. Mater. Sci. Technol., 2024, 185, 165–173 CrossRef.
- Y. Xia, W. Gao and C. Gao, Adv. Funct. Mater., 2022, 32, 2204591 CrossRef CAS.
- T. Zhao, Z. Jia, J. Liu, Y. Zhang, G. Wu and P. Yin, Nano-Micro Lett., 2024, 16, 6 CrossRef CAS PubMed.
- M. Green and X. Chen, J. Mater., 2019, 5, 503–541 Search PubMed.
- B. Wang, Q. Wu, Y. Fu and T. Liu, J. Mater. Sci. Technol., 2021, 86, 91–109 CrossRef CAS.
- J. Fang, P. Li, Y. Liu and Y. Min, J. Mater. Chem. C, 2021, 9, 2474–2482 RSC.
- S. Ajia, H. Asa, Y. Toyoda, M. Sato, M. Matsuura, N. Tezuka and S. Sugimoto, J. Alloys Compd., 2022, 903, 163920 CrossRef CAS.
- B. Yang, J. Fang, C. Xu, H. Cao, R. Zhang, B. Zhao, M. Huang, X. Wang, H. Lv and R. Che, Nano-Micro Lett., 2022, 14, 170 CrossRef CAS PubMed.
- F. Hosseini Mohammadabadi, S. M. Masoudpanah, S. Alamolhoda and H. R. Koohdar, J. Alloys Compd., 2022, 909, 164637 CrossRef CAS.
- S. Aman, N. Ahmad, M. H. Alhossainy, H. Albalawi, M. Morsi, T. I. Al-Muhimeed and A. A. AlObaid, J. Rare Earths, 2022, 40, 443–450 CrossRef CAS.
- Y. Shen, P. Song, F. Zhang, J. Cao, F. Gao, J. Ma, H. Feng, F. Yang, W. Zhang, C. Liu and X. Du, Colloids Surf., A, 2024, 682, 132814 CrossRef CAS.
- X. Luo, K. Zhang, Y. Zhou, H. Wu and H. Xie, J. Colloid Interface Sci., 2022, 611, 306–316 CrossRef CAS PubMed.
- X. Luo, J. Cao, G. Meng, Y. Zhou and H. Xie, J. Mater. Sci.: Mater. Electron., 2020, 31, 15608–15615 CrossRef CAS.
- K. Zhang, X. Luo and H. Xie, J. Mater. Sci.: Mater. Electron., 2022, 33, 13290–13302 CrossRef CAS.
- J. Wei, T. Wang and F. Li, J. Magn. Magn. Mater., 2011, 323, 2608–2612 CrossRef CAS.
- X. Luo, H. Xie, F. Yu, J. Cao, Y. Zhang, Z. Lei and K. Zhang, J. Mater. Sci.: Mater. Electron., 2023, 34, 2015 CrossRef CAS.
- J. He, X. Liu, Y. Deng, Y. Peng, L. Deng, H. Luo, C. Cheng and S. Yan, J. Alloys Compd., 2021, 862, 158684 CrossRef CAS.
- W. Liu, Q. Shao, G. Ji, X. Liang, Y. Cheng, B. Quan and Y. Du, Chem. Eng. J., 2017, 313, 734–744 CrossRef CAS.
- C. Chen, S. Bao, B. Zhang, Y. Zhou and S. Li, J. Alloys Compd., 2019, 770, 90–97 CrossRef CAS.
- C. Ding, C. Shao, S. Wu, Y. Ma, Y. Liu, S. Ma, X. Hu, Z. Cao, X. Ren, B. Zhong, G. Wen and X. Huang, Carbon, 2023, 213, 118279 CrossRef CAS.
- H. Guan, Q. Wang, X. Wu, J. Pang, Z. Jiang, G. Chen, C. Dong, L. Wang and C. Gong, Composites, Part B, 2021, 207, 108562 CrossRef CAS.
- K. Peng, Y. Wu, G. Fang, G. Xu and C. Liu, J. Alloys Compd., 2023, 947, 169368 CrossRef CAS.
- B. Zimmerle, M. Wu, J. Liu and X. Chen, Carbon, 2023, 212, 118124 CrossRef CAS.
- Y. Wu, L. Chen, Y. Han, P. Liu, H. Xu, G. Yu, Y. Wang, T. Wen, W. Ju and J. Gu, Nano Res., 2023, 16, 7801–7809 CrossRef CAS.
- Y. Cheng, K. Zhou, Y. Ma, H. Zhao and H. Yang, J. Alloys Compd., 2024, 980, 173641 CrossRef CAS.
- J. Feng, Y. Wang, Y. Hou, J. Li and L. Li, Ceram. Int., 2016, 42, 17814–17821 CrossRef CAS.
- N. Li, G.-W. Huang, Y.-Q. Li, H.-M. Xiao, Q.-P. Feng, N. Hu and S.-Y. Fu, ACS Appl. Mater. Interfaces, 2017, 9, 2973–2983 CrossRef CAS PubMed.
- X. Zhang, X. Zhang, H. Yuan, K. Li, Q. Ouyang, C. Zhu, S. Zhang and Y. Chen, Chem. Eng. J., 2020, 383, 123208 CrossRef CAS.
- Z. Zhao, B. Kang, J. Xu, C. Zhu, X. Zhang, X. Zhang and Y. Chen, Carbon, 2023, 209, 117995 CrossRef CAS.
- H. Xu, B. Li, X. Jiang, Y. Shi, X. Zhang, C. Zhu, X. Zhang and Y. Chen, Carbon, 2023, 201, 234–243 CrossRef CAS.
- Z. Ma, M. Liu, B. Li, F. Yan, Y. Chen, X. Zhang and C. Zhu, Carbon, 2023, 212, 118165 CrossRef CAS.
- X. Luo, H. Xie, F. Yu, J. Zhang, X. Li, X. Wei, X. Lai and S. Wang, Mater. Res. Bull., 2024, 175, 112759 CrossRef CAS.
- A. Farrokhi, A. Samadi, M. Asadi Asadabad and L. Amiri Talischi, Adv. Powder Technol., 2015, 26, 797–801 CrossRef CAS.
- M. Varga, T. Izak, V. Vretenar, H. Kozak, J. Holovsky, A. Artemenko, M. Hulman, V. Skakalova, D. S. Lee and A. Kromka, Carbon, 2017, 111, 54–61 CrossRef CAS.
- U. J. Kim, C. A. Furtado, X. Liu, G. Chen and P. C. Eklund, J. Am. Chem. Soc., 2005, 127, 15437–15445 CrossRef CAS PubMed.
- S. Lefrant, M. Baibarac, I. Baltog, J. Y. Mevellec, C. Godon and O. Chauvet, Diamond Relat. Mater., 2005, 14, 867–872 CrossRef CAS.
- C. M. Watts, X. Liu and W. J. Padilla, Adv. Mater., 2012, 24, OP98–OP120 CAS.
- X. Wang, X. Xing, H. Zhu, J. Li and T. Liu, Adv. Colloid Interface Sci., 2023, 318, 102960 CrossRef CAS PubMed.
- M. Green, Z. Liu, P. Xiang, X. Tan, F. Huang, L. Liu and X. Chen, Mater. Today Chem., 2018, 9, 140–148 CrossRef CAS.
- M. Green, L. Tian, P. Xiang, J. Murowchick, X. Tan and X. Chen, Mater. Chem. Front., 2018, 2, 1119–1125 RSC.
- R. Benzerga, M. Badard, C. Méjean, A. El Assal, C. Le Paven and A. Sharaiha, J. Electron. Mater., 2020, 49, 2999–3008 CrossRef CAS.
- X. Chen, Y. Wang, H. Liu, S. Jin and G. Wu, J. Colloid Interface Sci., 2022, 606, 526–536 CrossRef CAS PubMed.
- M. Green, Z. Liu, P. Xiang, Y. Liu, M. Zhou, X. Tan, F. Huang, L. Liu and X. Chen, Light: Sci. Appl., 2018, 7, 87 CrossRef PubMed.
- X. Han, L. Qiao, P. Peng, C. Fu, S. Zhang, K. Liu and Z. Ma, ACS Appl. Nano Mater., 2024, 7, 2593–2604 CrossRef CAS.
- M. Green, P. Xiang, Z. Liu, J. Murowchick, X. Tan, F. Huang and X. Chen, J. Mater., 2019, 5, 133–146 Search PubMed.
- C.-X. Lei, L.-F. Lin, S. Li, Q. Luo, L.-S. Wang and D.-L. Peng, J. Alloys Compd., 2024, 976, 173164 CrossRef CAS.
- M. Green, A. T. Van Tran, R. Smedley, A. Roach, J. Murowchick and X. Chen, Nano Mater. Sci., 2019, 1, 48–59 CrossRef.
- Z. Li, H. Lin, Y. Xie, L. Zhao, Y. Guo, T. Cheng, H. Ling, A. Meng, S. Li and M. Zhang, J. Mater. Sci. Technol., 2022, 124, 182–192 CrossRef CAS.
- M. Ma, Z. Liao, X. Su, Q. Zheng, Y. Liu, Y. Wang, Y. Ma and F. Wan, J. Colloid Interface Sci., 2022, 608, 2203–2212 CrossRef CAS PubMed.
- N. Zhai, J. Luo, M. Xiao, Y. Zhang, W. Yan and Y. Xu, Carbon, 2023, 203, 416–425 CrossRef CAS.
- D. Shan, L. He, K. Cao, Y. Xu, J. He and S. Yan, Mater. Res. Bull., 2022, 152, 111863 CrossRef CAS.
- P. Zhou, J. Zhang, H. Zhu, L. Wang, X. Wang, Z. Song, Q. Zhang, M. Yu, Z. Liu, T. Xu, W. Feng and X. Feng, ACS Appl. Mater. Interfaces, 2020, 12, 23252–23260 CrossRef CAS PubMed.
- P.-A. Yang, Y. Huang, R. Li, X. Huang, H. Ruan, M. Shou, W. Li, Y. Zhang, N. Li and L. Dong, Chem. Eng. J., 2022, 430, 132878 CrossRef CAS.
- X. Zeng, X. Cheng, R. Yu and G. D. Stucky, Carbon, 2020, 168, 606–623 CrossRef CAS.
- X. Xie, Y. Wang, X. Sun, H. Wang, R. Yu, W. Du and H. Wu, J. Mater. Sci. Technol., 2023, 133, 1–11 CrossRef CAS.
- Y. Li, Y. Liao, L. Ji, C. Hu, Z. Zhang, Z. Zhang, R. Zhao, H. Rong, G. Qin and X. Zhang, Small, 2022, 18, 2107265 CrossRef CAS PubMed.
- S. Li, Y. Sun, X. Jiang and H. Yu, J. Colloid Interface Sci., 2023, 652, 1197–1207 CrossRef CAS PubMed.
- Z. Liu, Y. Wang, C. Xian, K. Li, F. Wang, P. Zhang, W. Yang, S. Liu, C. Wang, H. Du, Z. Luo, J. Tang, X. Kong, L. Han, Y. Hou and J. Yang, J. Alloys Compd., 2023, 938, 168649 CrossRef CAS.
- Y. Liu, X. Wei, X. He, J. Yao, R. Tan, P. Chen, B. Yao, J. Zhou and Z. Yao, Adv. Funct. Mater., 2023, 33, 2211352 CrossRef CAS.
Footnote |
| † Electronic supplementary information (ESI) available. See DOI: https://doi.org/10.1039/d4ra00955j |
| This journal is © The Royal Society of Chemistry 2024 |