
 Open Access Article
 This Open Access Article is licensed under a Creative Commons Attribution-Non Commercial 3.0 Unported Licence
Failure mechanisms of the Li(Ni0.6Co0.2Mn0.2)O2-Li4Ti5O12 lithium-ion batteries in long-time high-rate cycle†
Yushuo Huang ,
Suyang Lu,
Song Zhu,
Minghao Su,
Shilun Yang,
Wenwen Zeng*,
Haoran Zhan,
Ye Yang and
Jun Mei
,
Suyang Lu,
Song Zhu,
Minghao Su,
Shilun Yang,
Wenwen Zeng*,
Haoran Zhan,
Ye Yang and
Jun Mei
Chengdu Development Center of Science and Technology, China Academy of Engineering Physics, Chengdu 610200, China. E-mail: zww123100@126.com
First published on 25th April 2024
Abstract
With the ever-growing widespread use of lithium-ion batteries in heavy machinery and daily life, the demand for improved longevity and high-rate performance is escalating. While Li4Ti5O12 (LTO) batteries excel in safety and cycling performance, their full potential for long-term, high-rate cycling still yet remains unrealized. In this paper, we present an analysis of a pouch battery with an LTO anode system that was cycled for an extended period at high rates. We compared the performance changes and internal component properties between fresh and cycled batteries. Our results reveal that, after tens of thousands of high-rate cycles, microcracks emerged on the cathode electrode material (NCM622) particles of the battery, whereas the LTO remained largely unchanged. Additionally, we observed significant electrolyte reduction, characterized the separator surface, and measured its properties. Our findings indicate that the electrolyte reactions are the primary cause of battery failure, leading to capacity fading and impedance increase. This research provides valuable insights into the failure mechanisms of lithium-ion batteries at high rates, thus contributing to the improvement of high-rate lithium-ion batteries.
1 Introduction
The high energy density and rapid (dis)charge capabilities of lithium-ion batteries (LIBs) have made them widely utilized in portable electronic devices, electric vehicles (EV) and hybrid electric vehicles (HEV), demonstrating promising development.1–3 However, as cutting-edge equipment such as heavy machinery and construction equipment increasingly rely on battery power, there is a growing demand for enhanced safety measures, improved cycle performance, and higher rate capability. In particular, the requirement for long-lasting cycles at high rates places significant emphasis on battery stability. While graphite electrodes have been extensively employed as anodes in commercial LIBs, the huge volume changes generated during lithiation/delithiation processes lead to irreversible capacity fading and shortened cycle life in the LIBs with graphite anode electrodes.4 Moreover, the low working potential (∼0.1 V vs. Li/Li+) of graphite makes lithium dendrite easy to form on the surface of the graphite electrodes during cycling, which can puncture the separator and cause a short circuit with serious safety risks.3,5–7 In contrast, spinel Li4Ti5O12 (LTO), an anode material possessing a “zero-strain” structure has garnered increasing attention because of its relatively high level of safety.8–10 Firstly, the lattice of LTO remains largely unchanged during the process of lithium ion insertion and extraction, resulting in significantly enhanced cycling stability compared to graphite as an anode electrode.11,12 Secondly, the discharge potential plateau (∼1.55 V vs. Li/Li+) exhibited by LTO is notably high, thereby effectively inhibiting the formation of lithium dendrites and greatly improving safety measures.11,13Currently, certain novel manufacturing and modification processes for various metal oxide electrode materials have demonstrated favorable rate capacity,14–18 with many maintaining 60–70% capacity even after a significant increase in rate. However, it is worth noting that these studies primarily involve coin cell experiments and lack testing at high rates. Even when subjected to not that high rates (e.g., 1–10C), only limited cycles (less than 1000) have been conducted.14,15,17 Clearly, these results deviate considerably from the actual operating conditions of the pouch batteries.
Previous studies have reported that LTO batteries exhibit excellent rate capability and extended cycle life through modification.19–21 However, there is dearth of research investigating the long-term cycling performance of LTO batteries at high rates, with our understanding of their failure mechanism primarily relying on their utilization at low rates.22–26 Therefore, it is imperative to comprehend the fading and failure mechanisms of LTO batteries operating under high-rate current conditions, as this can address the knowledge gap regarding changes in LTO battery performance during high-rate usage. Furthermore, such understanding would greatly aid in enhancing LIB design.
Herein, the LTO-NCM622 commercial pouch batteries underwent extensive cycling tests at a high rate of 40C, enduring tens of thousands of cycles. Subsequently, a comparison of the electrochemical performance was conducted between both fresh and cycled batteries. Upon dismantling the batteries, a comprehensive characterization and testing of their internal components, encompassing electrodes, separator, and electrolyte, were conducted to identify any alterations arising from the cycling process. Finally, by integrating the performance of the pouch batteries with the properties of their components, an analysis was performed to determine the failure mechanism under prolonged exposure to high-rate currents.
2 Experimental section
2.1 Samples
The sample batteries are commercial pouch batteries, in which cathode material is lithium nickel–cobalt–manganate (LiNi0.6Co0.2Mn0.2O2, NCM622), while anode material is lithium titanate (Li4Ti5O12, LTO). The capability is about 1 Ah, the length, width and thickness of the battery core are 100 mm, 60 mm and 3.15 mm, respectively.2.2 Electrochemical measurements
Description of cycle rate selection: We evaluated the rate capability of the sample before the start. Prior to commencing, we appraised the rate capabilities of the sample. Initially, charging and discharging were executed at identical rates, resulting in a capacity of less than 10% at 40C compared to 1C, as illustrated in Fig. 1. Considering that maintaining a constant charge and discharge rate of 40C would keep the battery in a perpetual low-capacity state of shallow charge and discharge, rendering the high current rate almost ineffective. By contrast, implementing a scheme of charging at 10C and discharging at 40C would yield a capacity of approximately 20% at each cycle at 1C, thus aiding us in assessing the battery's performance accurately.
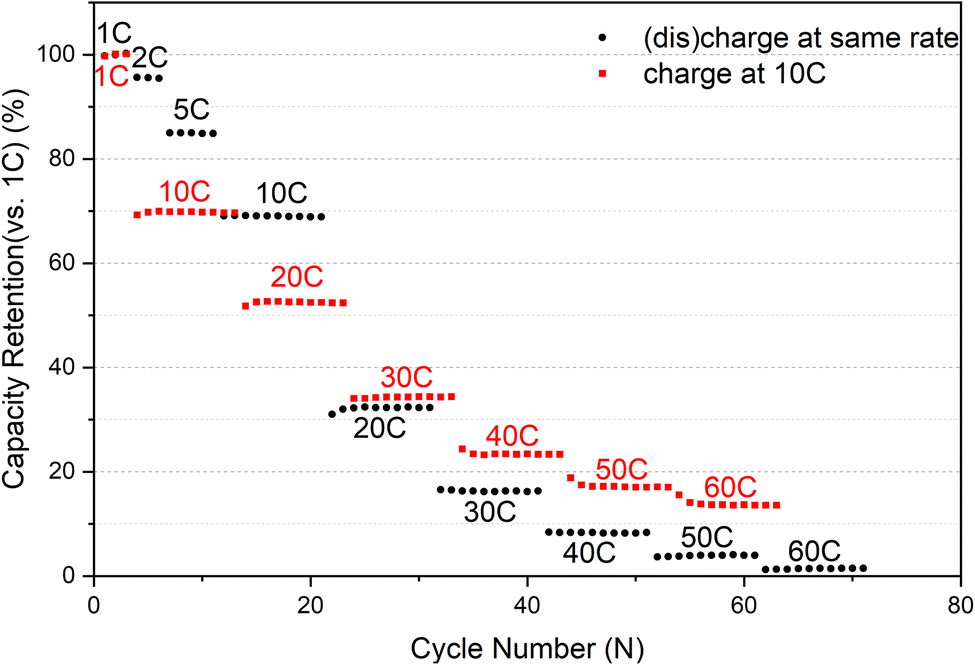 | ||
| Fig. 1 Comparison of discharge capacity retention (vs. capacity at 1C) at various rates for the two schemes. | ||
2.3 Characterization and analysis of components dismantled from battery
The battery was initially discharged at a low rate of 0.2C until it reached an empty state, after which it was dismantled within an Ar-filled glove box (O2 < 0.1 ppm, H2O < 0.1 ppm). During the dismantling process, the individual components were treated separately and stored within the glove box. Subsequently, both cathode and anode electrodes were immersed in dimethyl carbonate (DMC) and subjected to vacuum drying in a transition chamber set at 85 °C. Similarly, the separators were soaked in DMC and vacuum dried in a transition chamber maintained at 45 °C.Furthermore, the alterations in the separator's property during battery failure were assessed by integrating them into CR2032 coin symmetric cells using the following procedure. The central area of the separators was punched into circular sheets and assembled with two lithium metal pieces serving as both cathode and anode electrodes to form a symmetric cell of CR2032 within an Ar-filled glove box (O2 < 0.1 ppm, H2O < 0.1 ppm). The electrolyte comprised a 1 M LiPF6 in a mixed solvent composed of diethylene carbonate (DEC), dimethyl carbonate (DMC) and ethylene carbonate (EC) in a weight ratio of 1![[thin space (1/6-em)]](https://www.rsc.org/images/entities/char_2009.gif) :1:1. Two tests are subsequently performed. Firstly, EIS was executed on the CHI760E electrochemical workstation immediately following assembled and left standing. The frequency range was set from 105 to 10−2 Hz. Secondly, a “cycle” test was conducted on Land CT3002A battery testing systems: a current of 10 mA was applied to the cells, and every 20 minutes the current was reversed, for a total of 10 cycles (that is, 10 “charge” and 10 “discharge” cycles). After that, the EIS was conducted again.
:1:1. Two tests are subsequently performed. Firstly, EIS was executed on the CHI760E electrochemical workstation immediately following assembled and left standing. The frequency range was set from 105 to 10−2 Hz. Secondly, a “cycle” test was conducted on Land CT3002A battery testing systems: a current of 10 mA was applied to the cells, and every 20 minutes the current was reversed, for a total of 10 cycles (that is, 10 “charge” and 10 “discharge” cycles). After that, the EIS was conducted again.
2.4 Representation of different samples in each and characterization
25 °C/35 °C/45 °C: The sample battery cycled at room temperature/35 °C/45 °C.
25 °C/35 °C/45 °C: Electrode dismantled from the sample battery cycled at room temperature/35 °C/45 °C (cleaned by soaking in DMC).
Cycled: Separator dismantled from the battery cycled (not cleaned).
Fresh: Separator dismantled from the battery only activated (not cleaned).
Cycled: Separator dismantled from the battery cycled (not cleaned).
Fresh (cleaned): Separator dismantled from the battery only activated (cleaned by soaking in DMC).
Cycled (cleaned): Separator dismantled from the battery cycled (cleaned by soaking in DMC).
25 °C/35 °C/45 °C: Inner surface of Al-plastic of the battery cycled at room temperature/35 °C/45 °C.
3 Result and discussion
3.1 Sample electrochemical performance
000 cycles (and it's completely below 80% more than 40000 cycles), but it takes just less than 15000 and 8000 cycles at 35 °C (Fig. 2c) and 45 °C (Fig. 2b), respectively. In addition, the batteries cycled at 35 °C and 45 °C exhibit two distinct fading processes: a slower initial stage followed by a rapid second stage. This accelerated fading occurs after approximately 16000 and 6500 cycles, respectively. However, no significant inflection point indicating accelerated fading was observed for the battery cycled at room temperature, which may be attributed to the insufficient number of cycles at room temperature to reach the threshold for accelerated capacity fading. Conversely, an increase in temperature accelerates capacity fading, thus reaching the inflection point sooner.
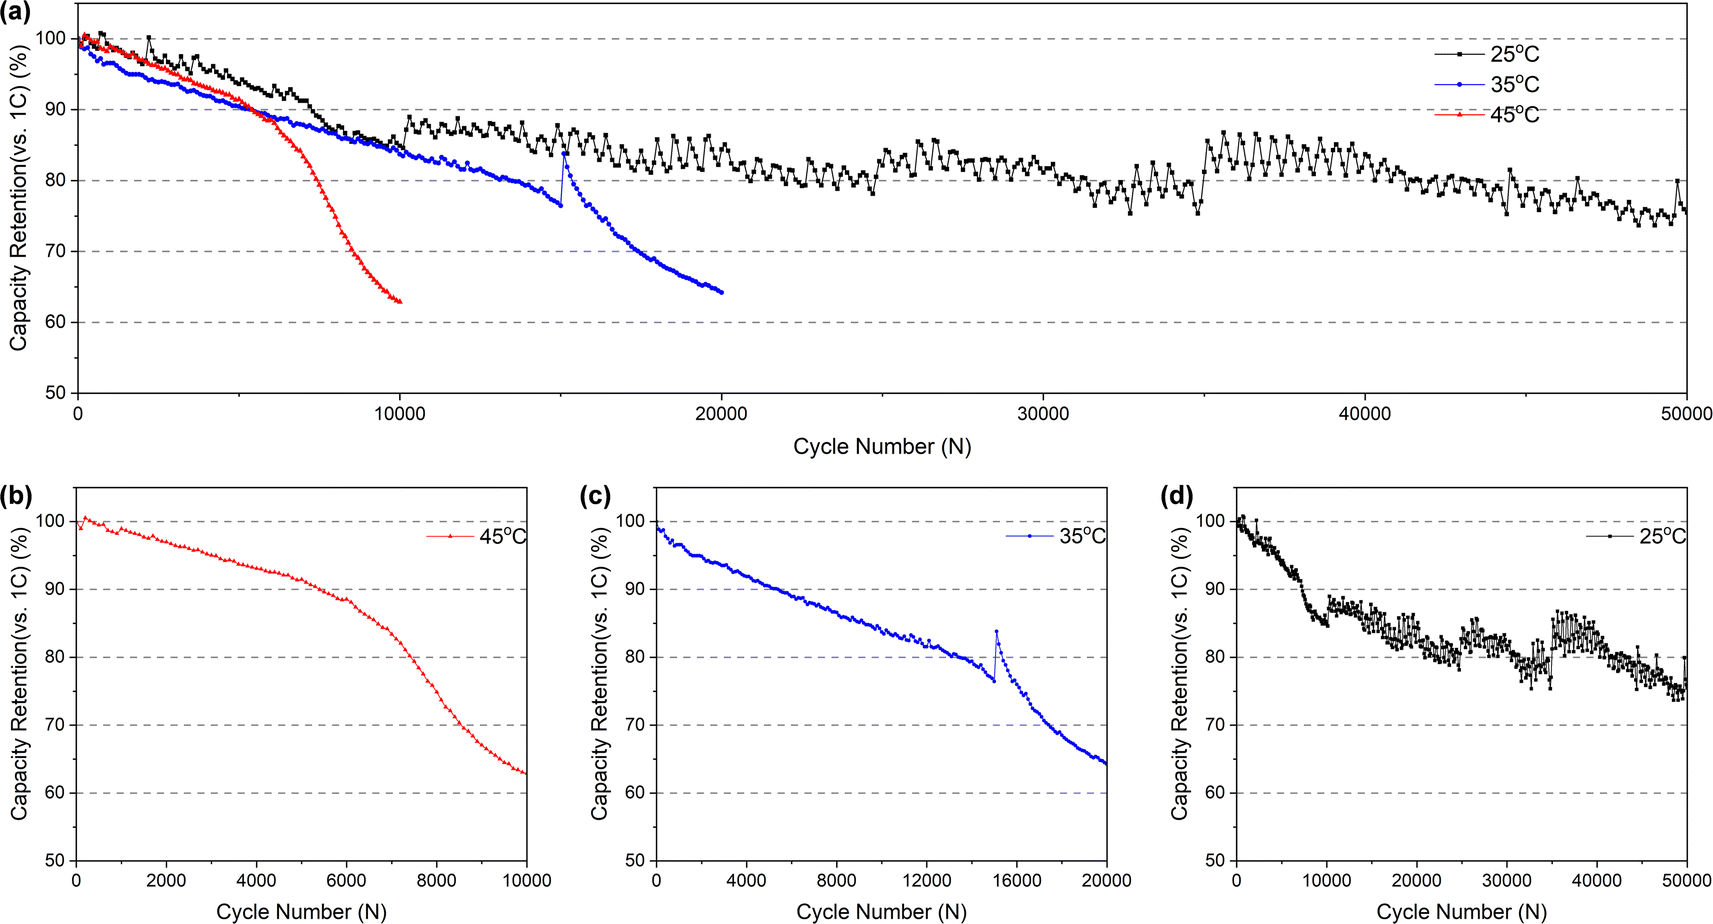 | ||
| Fig. 2 (a) Cycling performance of batteries. Capacity fading curves of batteries cycled at (b) 45 °C (c) 35 °C (d) 25 °C. The sudden change observed in (c) is attributed to the battery resting after 15000 cycles before resuming cycling. This rest period allowed for relaxation, resulting in a subsequent increase in capacity. In (d), the zigzag pattern in the curve is more pronounced due to challenges in maintaining temperature control. Each cycle generates heat, affecting the temperature, and given the extended duration of the experiment, changes in ambient temperature also contribute to the observed fluctuations. | ||
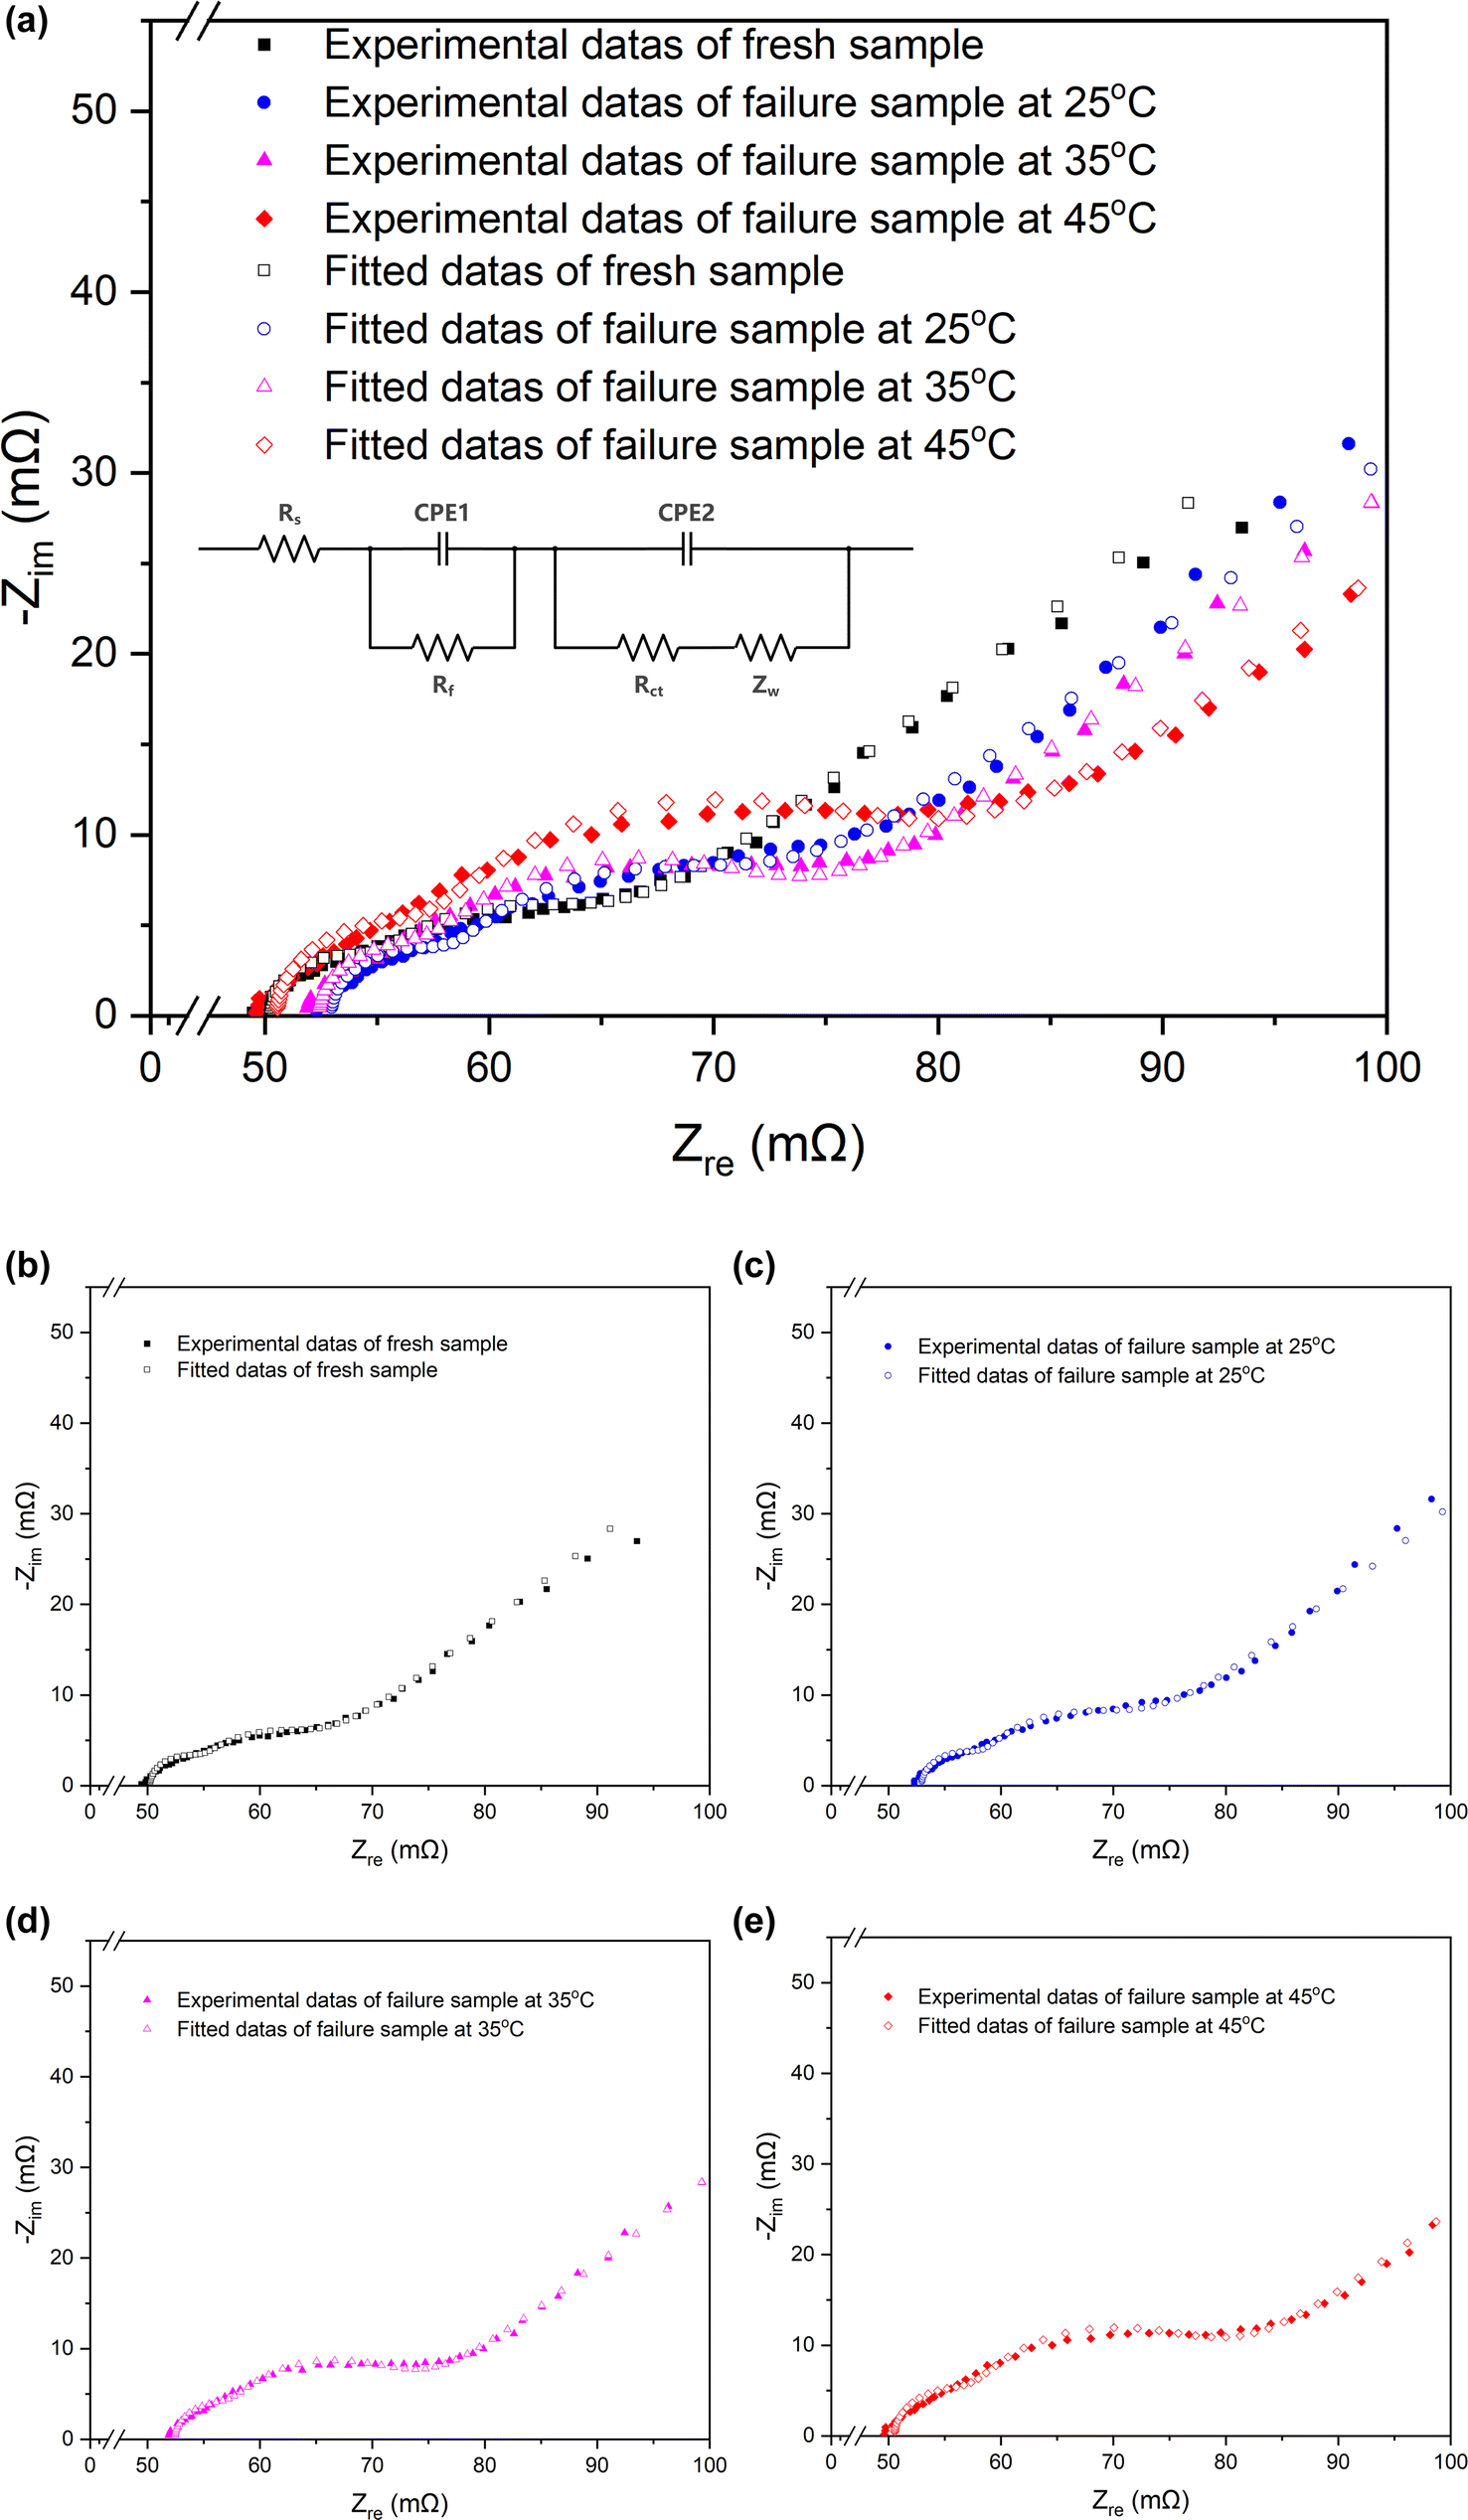 | ||
| Fig. 3 Nyquist plots and the equivalent circuits of the fresh battery and batteries cycled at 25 °C, 35 °C, 45 °C. | ||
| Fresh | Cycled at 25 °C | Cycled at 35 °C | Cycled at 45 °C | |
|---|---|---|---|---|
| Rs (mΩ) | 50.24 | 52.96 | 52.41 | 50.54 |
| Rct (mΩ) | 8.864 | 12.22 | 14.33 | 19.61 |
| Rf (mΩ) | 4.849 | 5.536 | 5.189 | 7.052 |
3.2 Components dismantled from sample
 | ||
| Fig. 4 FESEM images of NCM electrodes in (a)–(c) fresh batteries and (d)–(f) batteries cycled at 45 °C. Internal SEM images obtained through FIB cutting reveal the structure of NCM electrodes in (g)–(i) fresh batteries and (j)–(l) batteries cycled at 45 °C. Notably, the numerous small particles observed on the surface in 4b-1 are carbon black, a conductive agent added to the electrode, while the larger bulk in 4b-2 represents graphite, another conductive agent. | ||
The microstructure of the NCM in the fresh battery are microspheres ranging from 1 to 10 μm in diameter (Fig. 4a). These microspheres are further composed of nanoscale particles ranging from 100 to 300 nm in diameter (Fig. 4c). Upon comparing the morphologies in Fig. 4a–f, it can be faintly seen that numerous NCM microspheres in the cycled battery (Fig. 4e and f) electrodes exhibit signs of cracking, in contrast compared to the intact microspheres observed in the fresh battery (Fig. 4b and c). Approximated 30% of the microspheres within the field of view in Fig. 4d display cracking (highlighted by the dotted line). In Fig. 4f, the morphology of the microspheres has been completely unidentifiable, in that the whole microsphere has completely cracked. For a more intuitive observation, focused ion beam scanning electron microscopy (FIB-SEM) was used to slice the agglomerated NCM microspheres. This allowed us to capture images of the interior structure using SEM, as illustrated in Fig. 4g–l. From the cross-section after cutting, no matter the fresh batteries (Fig. 4h) or the cycled batteries (Fig. 4l), there are holes in the center of many NCM microspheres. However, a significant difference is observed in the shell of the NCM microspheres: there are obviously much more cracks (Fig. 4k) in the cycled batteries compared to the fresh batteries, with the cracks being larger and more widespread.
Using in situ XRD, Hoon-Hee Ryu27 discovered that the H2–H3 phase transition kinetics in single-crystal NCM proceeds slowly. This sluggish kinetics results in a tendency for the lithium concentrations to be spatially inhomogeneous during cycling. Consequently, the x value in the Li1−xTMO2 (TM = transition metal) tends to vary spatially inhomogeneous, leading to nonuniform spatial stress. This internal inhomogeneity generates structural defects during electrochemical reactions and limits the diffusion kinetics of Li+ ion. The rapid capacity fading in polycrystalline NCM cathodes is mainly attributed to the abrupt anisotropic contraction and expansion of lattice structures triggered by H2–H3 phase transition. The structural stress release along grain boundaries brings about the formation of microcracks. Zhongmin Ren28 believed that as Li+ ions reciprocating, particle strains induce the generation and accumulation of the dislocations and defects. Over time, the crystal's fracture-strength gradually fatigues during cycling until the particle eventually cracks due to the inability sustain internal stress. Whether it is due to the accumulation of dislocations and defects, stress caused by phase transitions, or inhomogeneity concentrations of lithium ions, the final result is the formation of microcracks within the NCM particles.29–31 Moreover, the spatially inhomogeneous tendency of lithium concentrations can be exacerbated by C rates.27 Given that the experiment involved a 40C high rate, this effect is likely to be amplified, which potentially lead to the situation that even the nonuniform spatial stress due to the spatially inhomogeneous concentration of lithium ions in single-crystal NCM may occur in the polycrystalline NCM, resulting in structural defects and further exacerbating the severity of microcracks.
The formation of microcracks within the particles effectively blocks certain electron transfer channels, bringing about increased resistance. This accounts for the significantly higher Rct value observed in the cycled battery compared to the fresh one, as mentioned in Section 3.1.2 above. In addition, these microcracks permit infiltration of electrolyte into the interior of the secondary particle, exposing the newly emerged surface to attack by the electrolyte.27
The SEM images of the LTO electrodes of anode (Fig. S1†) did not reveal any significant changes, even upon examining the cross-sectional view obtained through focused ion beam cutting (Fig. S1g–j†). Besides, similar NCM fragmentation patterns were observed in batteries cycled at 25 °C and 35 °C (Fig. S2†).
Fig. 5 presents the XRD patterns of the anode and cathode electrodes materials of the battery, comparing states before and after cycling, while Table 2 provides the lattice constants. As depicted in Fig. 5, the phase and structure of the materials at both the anode and cathode electrodes remained unaltered despite prolonged cycling. The crystalline phases of LiTMO2 and Li4Ti5O12 were consistently maintained, without any detection of heterophase even after 10000 cycles, indicating that no phase transitions occurred in the materials at both electrodes during cycling. Furthermore, as shown in Table 2, a comparison between the fresh and cycled batteries exhibits an increase in lattice constant c value of NCM, while the a value decreased. Consequently, there was an overall increase in the c/a ratio in the cycled batteries. This trend indicates a decrease in the Li/TM ratio in LiTMO2, suggesting a reduction in the amount of active lithium ions after cycling.32 The integrated intensity ratios, I(003)/I(104), of all samples exceeded 1.5, indicating low cation mixing after cycling.33–37 On the other hand, for LTO, the lattice constant a changed by less than 0.04% (in comparison to the changes of 0.625%, 0.717%, and 1.35% in a, c, and c/a in NCM), coupled with the SEM results, it means that LTO remains unchanged, suggesting that LTO exhibits greater stability than NCM, so the primary influence on the electrode can be attributed to NCM.
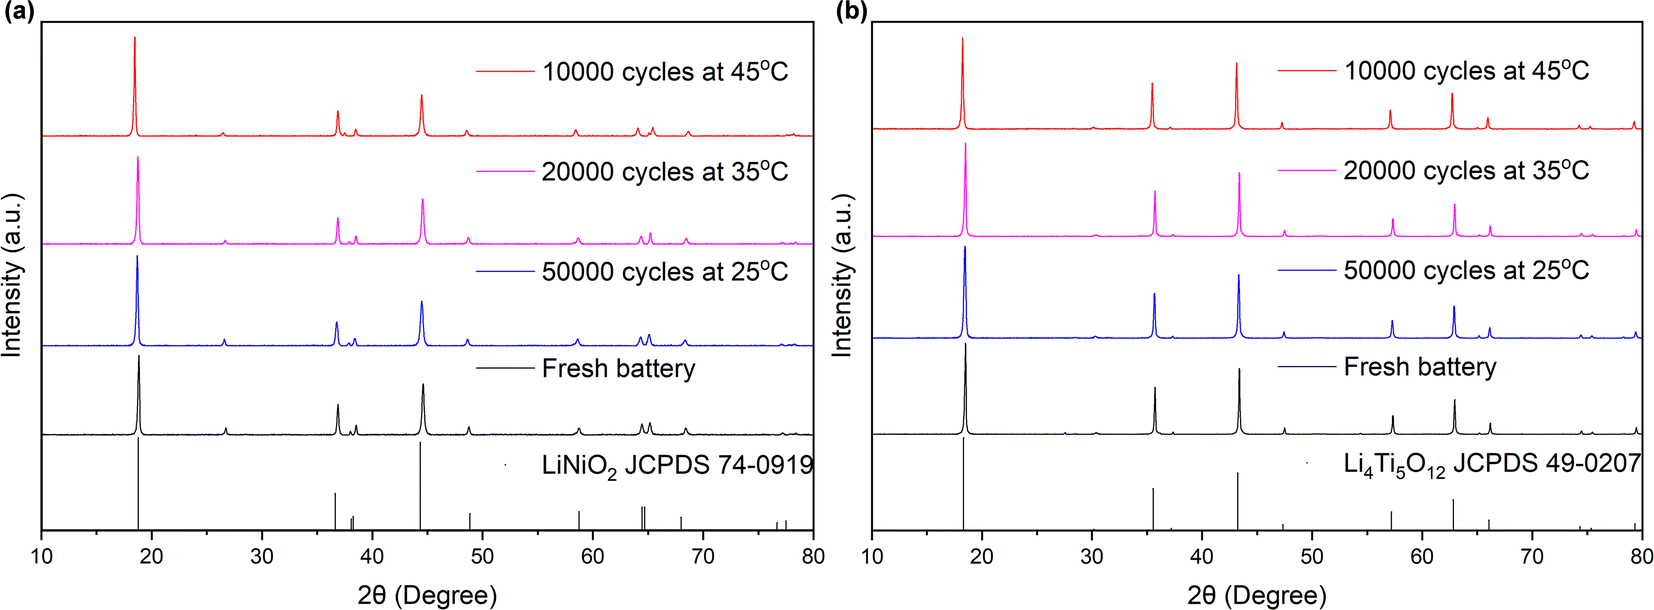 | ||
| Fig. 5 XRD patterns of (a) cathode NCM and (b) anode LTO electrodes of different batteries. | ||
| Fresh | Cycled at 25 °C | Cycled at 35 °C | Cycled at 45 °C | ||
|---|---|---|---|---|---|
| NCM | a (Å) | 2.86768 | 2.86705 | 2.86432 | 2.84976 |
| c (Å) | 14.25855 | 14.27094 | 14.27926 | 14.36076 | |
| c/a | 4.97216 | 4.97757 | 4.98522 | 5.03929 | |
| I(003)/I(104) | 1.559 | 2.015 | 1.931 | 2.386 | |
| LTO | a (Å) | 8.35856 | 8.36206 | 8.35903 | 8.35964 |
| Elements | C | O | F | Al | |
|---|---|---|---|---|---|
| PP (at%) | Fresh | 95.14 | 3.34 | 1.49 | 0.03 |
| Cycled | 81.28 | 13.29 | 5.43 | 0 | |
| Al2O3 (at%) | Fresh | 10.14 | 58.66 | 0.35 | 30.84 |
| Cycled | 11.71 | 54.03 | 5.20 | 29.06 | |
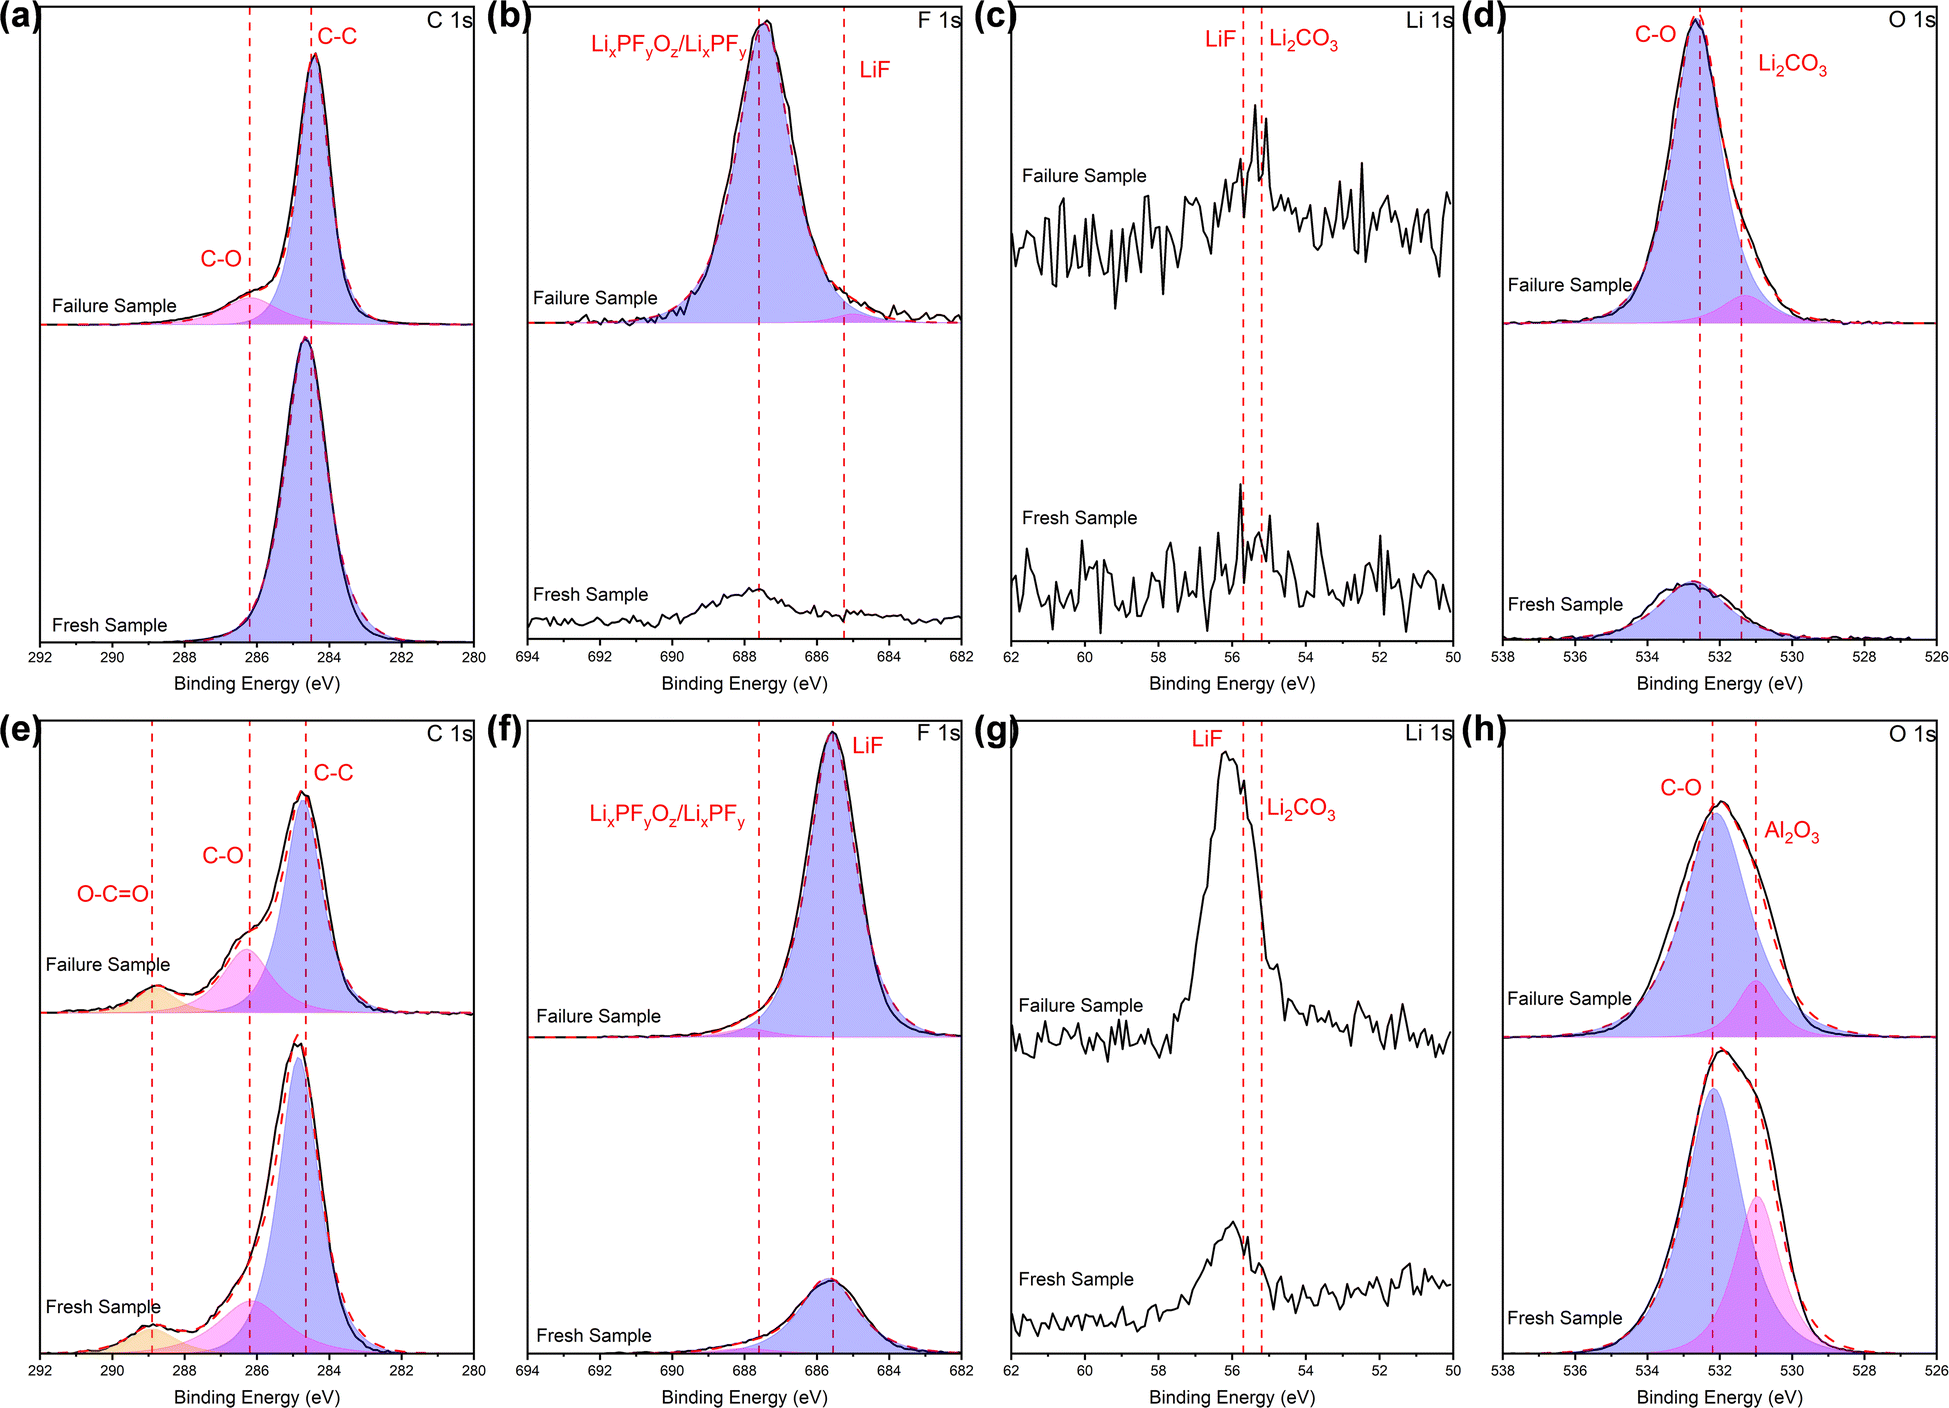
In order to identify the species of potential residues, X-ray photoelectron spectroscopy (XPS) measurements were performed. The spectra of C 1s, F 1s, O 1s, Al 2p and Li 1s, etc. were recorded for all samples. The ratios of each element are shown in Table S1,† while spectra displaying obvious changes are plotted in Fig. 6. It is clear from the Table S1† that XPS and EDS yield comparable results in terms of element ratios: both sides of the separators exhibit residual products containing C and F, what EDS could not tell is that the ratio of Li increased on both sides. The specific species can be accurately determined through the analysis of the elemental spectra in Fig. 6.
 | ||
| Fig. 6 XPS profiles (a and e) C 1s, (b and f) F 1s, (c and g) Li 1s, (d and h) O 1s of the separators, in terms of (a)–(d) PP side and (e)–(h) Al2O3 side. | ||
For the PP side, comparing with the fresh battery, a weak peak appears at 286.2 eV in the C 1s spectra of the cycled battery, which corresponds to the C–O chemical bond of carbonate. Combined with the peak related to Li2CO3 at about 55–56 eV38 in the Li 1s spectra (although not entirely prominent), it can be judged the presence of Li2CO3, albeit in small quantities. In the F 1s spectra, it can be seen that after cycling, the peak intensity related to LixPFyOz/LixPFy at around 687.5 eV24 appreciably increased, and a less pronounced peak at 685.5 eV is related to LiF.39 In the spectra of O 1s, there is basically a single peak of about 532 eV related to C–O chemical bonds associated with carbonates or organics. The intensity raised sharply after cycling, confirming the existence of the Li2CO3 in our system.
For the Al2O3 side, the intensity of the weak peak at 286.2 eV in the C 1s spectra slightly raised after cycling, while a great increase in intensity of the peak at 55–56 eV in the Li 1s spectra related to Li2CO3 occurred after cycling. Combined with the above two points, it can be known that major Li2CO3 appears after cycling. The intensity of the peak associated with LiF (∼685 eV) in the spectra of F 1s visibly increased after cycling, while the peak intensity related to LiF at 55–56 eV40 in the Li 1s spectra increased, which confirmed the existence of LiF, and indicated a higher amount compared to the PP side. In the spectra of O1s, the primary peak is centered around 532 eV, which corresponds to the C–O chemical bonds of carbonates or organics. However, in the fresh battery separator, there is vaguely another peak at 531 eV, originating from the alumina itself (Al2O3, 531 eV).41 Initially, when fewer products are formed during the initial contact between the separator and the electrolyte, the superposition of the electrolyte and alumina peaks leads to a higher peak intensity than that in the cycled battery. Nevertheless, extensive adsorption after cycling complicates the identification of the alumina peak, further corroborating the adsorption of reaction products following extended cycling.
Based on the comprehensive analysis of EDS and XPS tests conducted on the separator surfaces above, it is evident that electrolyte reaction products such as Li2CO3, LiF and LixPFyOz/LixPFy are formed and deposited on the separator surface in cycled batteries, and the amount of some species is high. On the PP side, LixPFyOz/LixPFy and Li2CO3 are the primary species observed, whereas on the Al2O3 side, LiF and Li2CO3 are the dominant ones. The variance is likely attributed to the distinct adsorption and fixation capabilities exhibited by each side of the separator towards these reaction products.
In order to gain insights into the property changes of the separators after cycling, the symmetric cell's EIS, which was typically employed to assess the ionic conductivity of solid electrolytes,42,43 was employed as a reference. Each separator sample was integrated into a CR2032 coin symmetric cell, complete with lithium metal pieces and electrolyte. EIS measurements were conducted both immediately after assembly and following the “cycle” process. In contrast to the traditional lithium-ion batteries, solid-state lithium batteries rely on the solid electrolyte to serve both as separator and electrolyte. When testing solid electrolytes, there are various contributors to contact resistance, including grain phase, grain boundary, and electrode blocking, etc. However, for lithium-ion batteries, the components, apart from the separator and electrolyte, remain the same. Therefore, as long as the electrolyte remains consistent, we can compare the properties of separator samples by performance of their symmetric cells.
In the test of solid electrolyte, when the ionic resistance Rb (that is, the diameter of the semicircle in the Nyquist plots) is obtained, the total ionic conductivity of the symmetric cell can be calculated by the formula:
| σ = L/(Rb × S) |
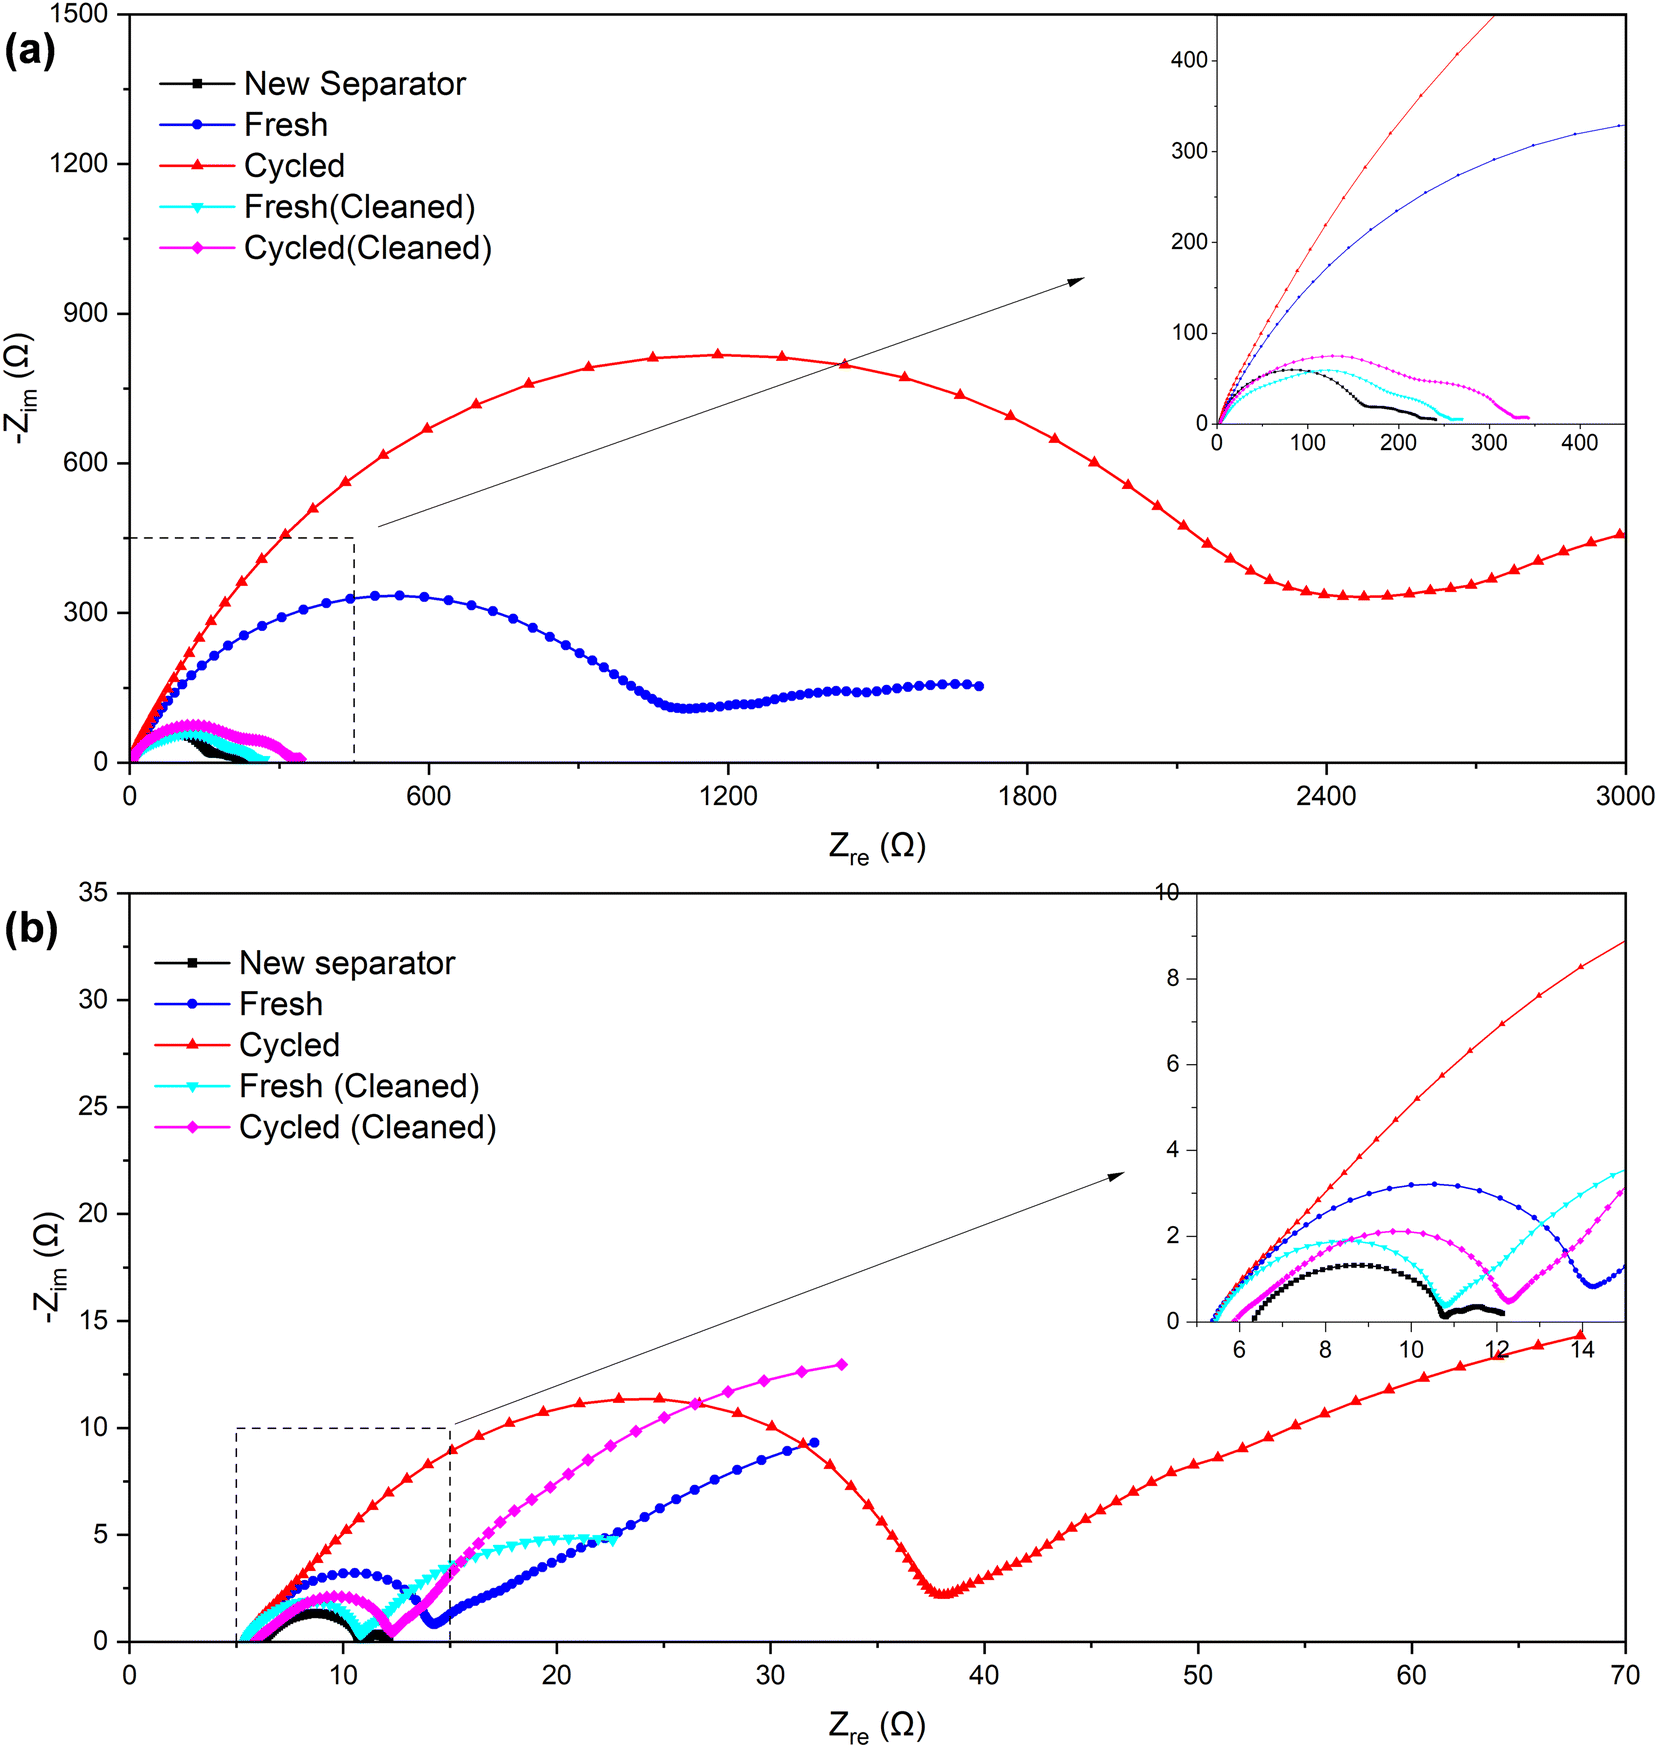 | ||
| Fig. 7 Nyquist plots of the symmetric cells assembled with separators of different samples (a) before and (b) after the “cycle”. | ||
| New separator | Fresh | Cycled | Fresh (cleaned) | Cycled (cleaned) | |
|---|---|---|---|---|---|
| Before “cycle” (Ω) | ∼180 | ∼1200 | ∼2500 | ∼240 | ∼300 |
| After “cycle” (Ω) | ∼4.5 | ∼9 | ∼33 | ∼5.5 | ∼6.5 |
The symmetric cells were “cycled” using the established method of testing micro-short circuits in solid electrolytes42,44 to further verify the alterations that occurred within the separator. Since the Li–SE–Li symmetric cell (SE refers to the solid electrolyte in solid-state lithium batteries or separator + electrolyte in lithium-ion batteries) inherently does not have a voltage (or the voltage is near 0 V), the measured voltage E is actually provided by the external current I and the internal impedance R. Consequently, by maintaining a consistent external current, the measured voltage E can serve as an indicator of the internal impedance R to a significant degree. In our separator + electrolyte symmetric cell system, the internal impedance R mainly comprises electrolyte resistance, electrolyte–lithium interface contact resistance, and electrochemical transfer resistance. In the case of ensuring that components except the separator remain identical, the former two resistance components can be considered constant. Therefore, variations in electrochemical transfer resistance primarily attributed to differences in separator properties, and primarily determine the overall internal impedance R.
The specific results can be found in Fig. 8, and as detailed in Table 5, the initial and stable voltages of symmetric cells from different samples when the external current is applied. Since the external current remains constant, we can directly compare the voltage to assess the impedance. In addition, the initial voltage of all samples exceeded the stable voltage, reflecting a significant reduction in ionic resistance following the “cycling” process in the EIS measurement. We attribute this decrease in ionic resistance to a process of cell activation. It is well-established that a few initial cycles at a low rate are necessary before conducting an EIS measurement, especially when the assembly is freshly completed. Furthermore, both the initial and stable voltages of the symmetric cell using the separator from a cycled battery were higher than those from a fresh battery. This suggests an increase in internal impedance after cycling, primarily due to an elevation in the electrochemical transfer resistance affected by separator. Interestingly, the voltages of the cleaned samples exhibited a decrease somewhat, echoing the findings from the EIS measurement, which indicates that the cleaning process could remove certain residues, thereby recovering the separator's properties, and proves that it is these residues that affected the separator's property.
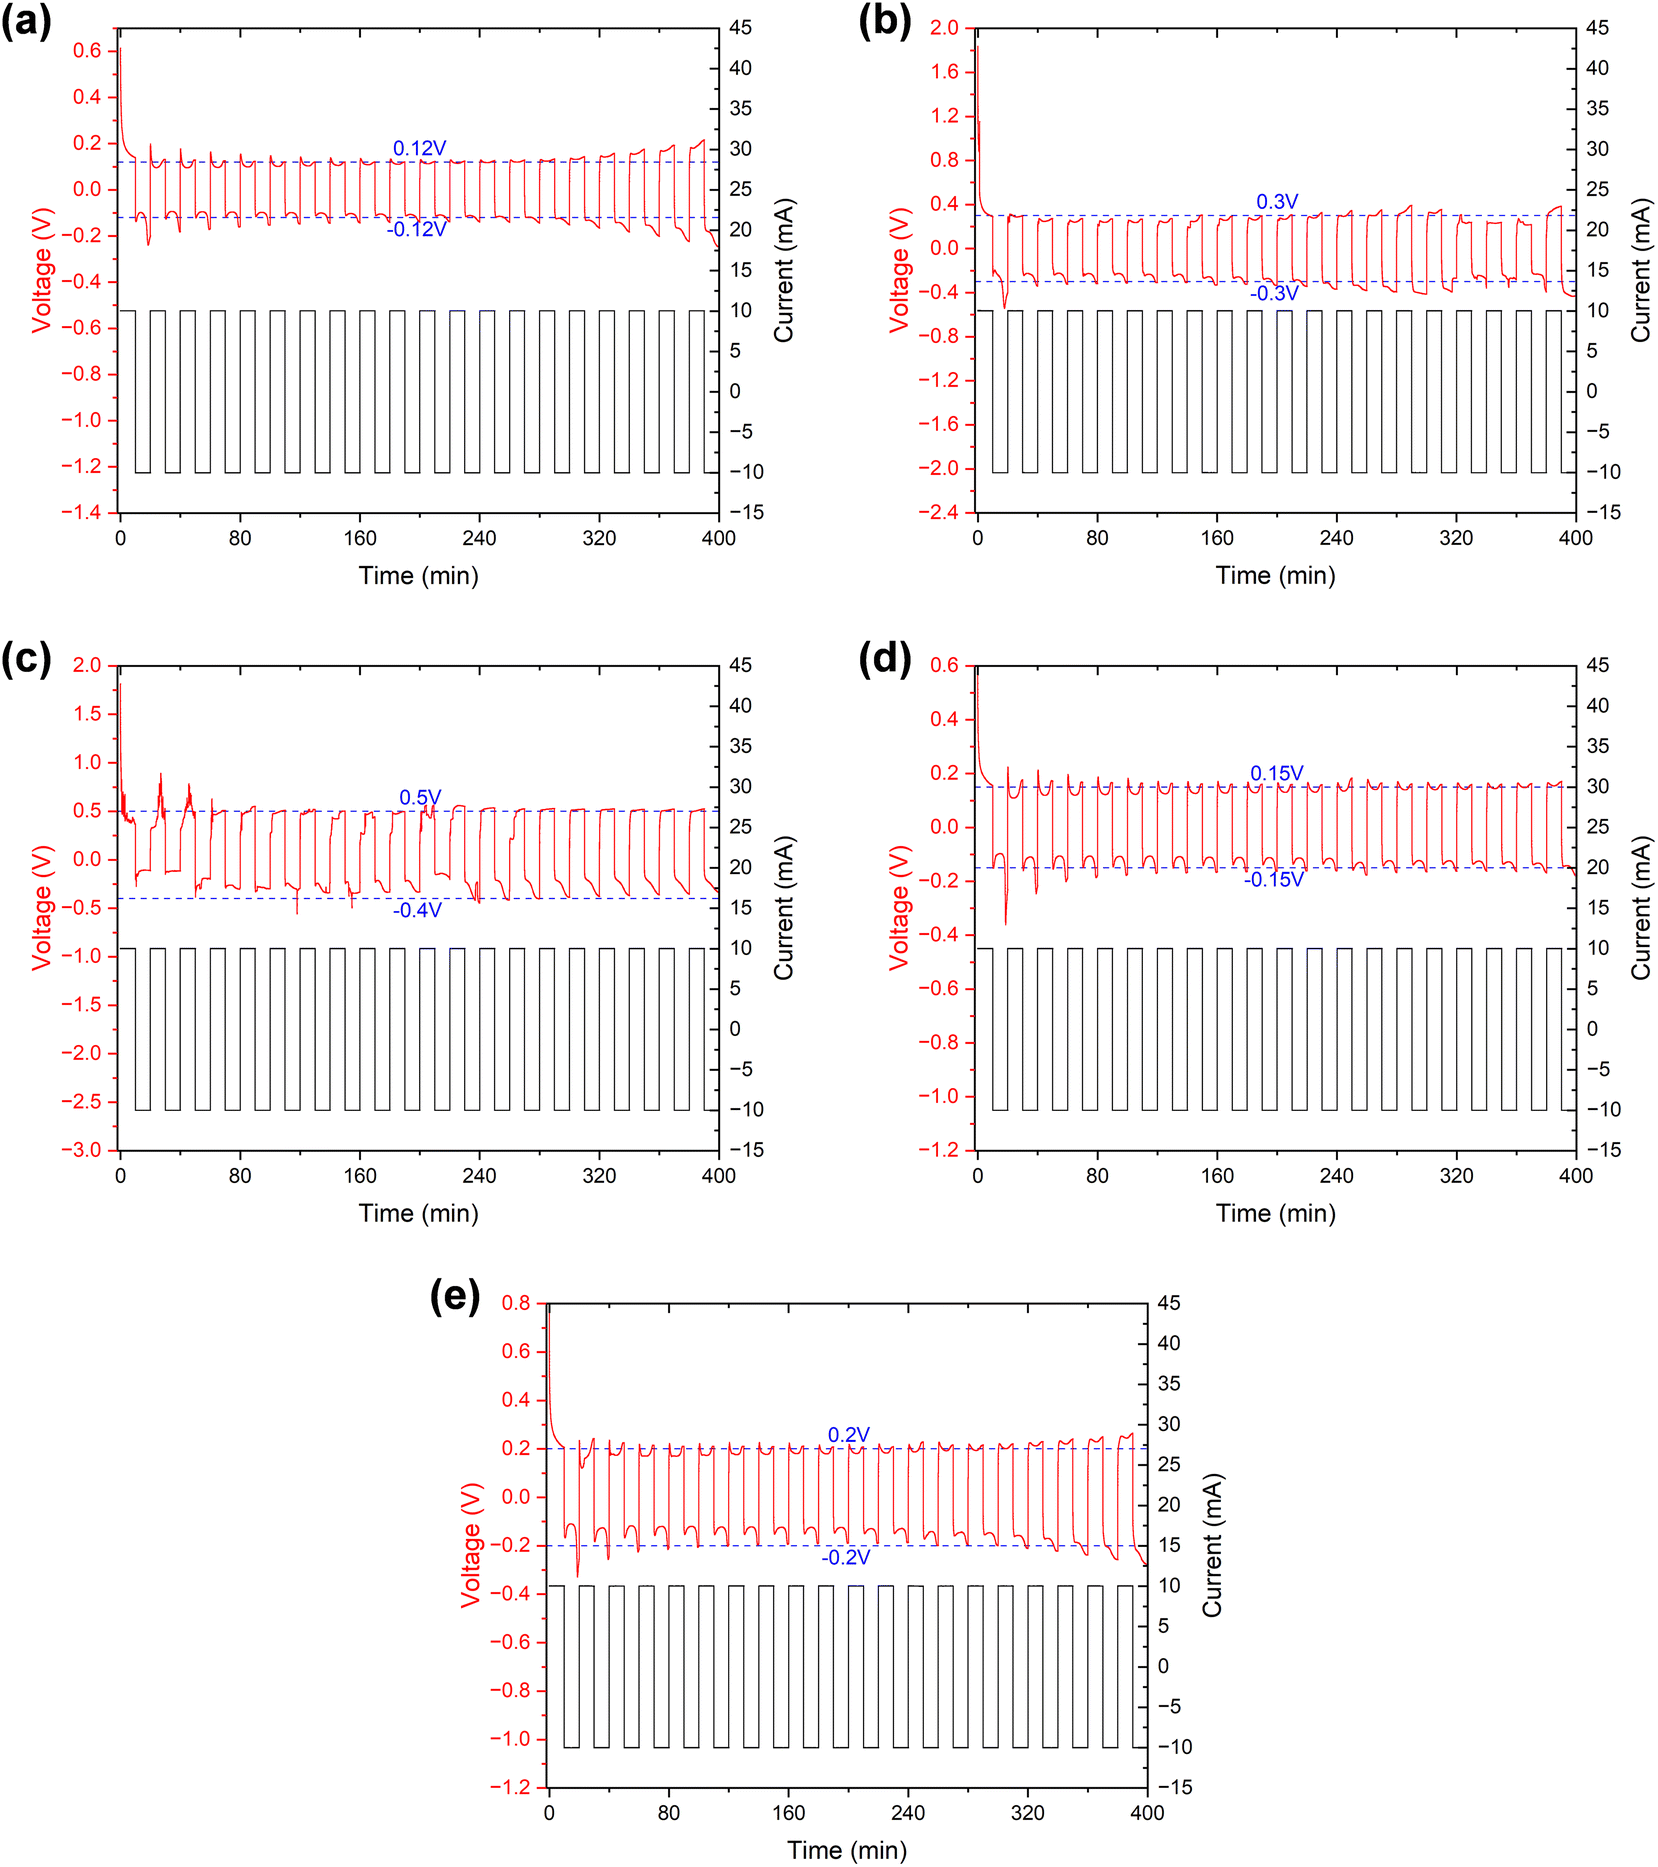 | ||
| Fig. 8 Voltage and current profiles over time for the Li/separator/Li symmetric cells of different samples in the “cycling”. (a) New separator (b) fresh battery (c) cycled battery (d) fresh battery (cleaned) (e) cycled battery (cleaned). | ||
| New separator | Fresh | Cycled | Fresh (cleaned) | Cycled (cleaned) | |
|---|---|---|---|---|---|
| Initial voltage (V) | ∼0.61 | ∼1.83 | ∼1.81 | ∼0.58 | ∼0.77 |
| Stable voltage (V) | ∼0.12 | ∼0.3 | ∼0.4∼0.5 | ∼0.15 | ∼0.2 |
Based on the comprehensive characterization and property tests conducted on the separators, it was observed that there was a significant decline in the separator's property to transfer lithium ions. This decline was attributed to the presence of numerous residues attached to the separator. The specific tests revealed that these residues primarily consisted of electrolyte reaction products such as Li2CO3, LiF and LixPFyOz/LixPFy. It is the attachment of the residues that leads to the degradation of separator's property, and in the pouch batteries as a whole, this is one of the reasons for the rise of charge transfer resistance.
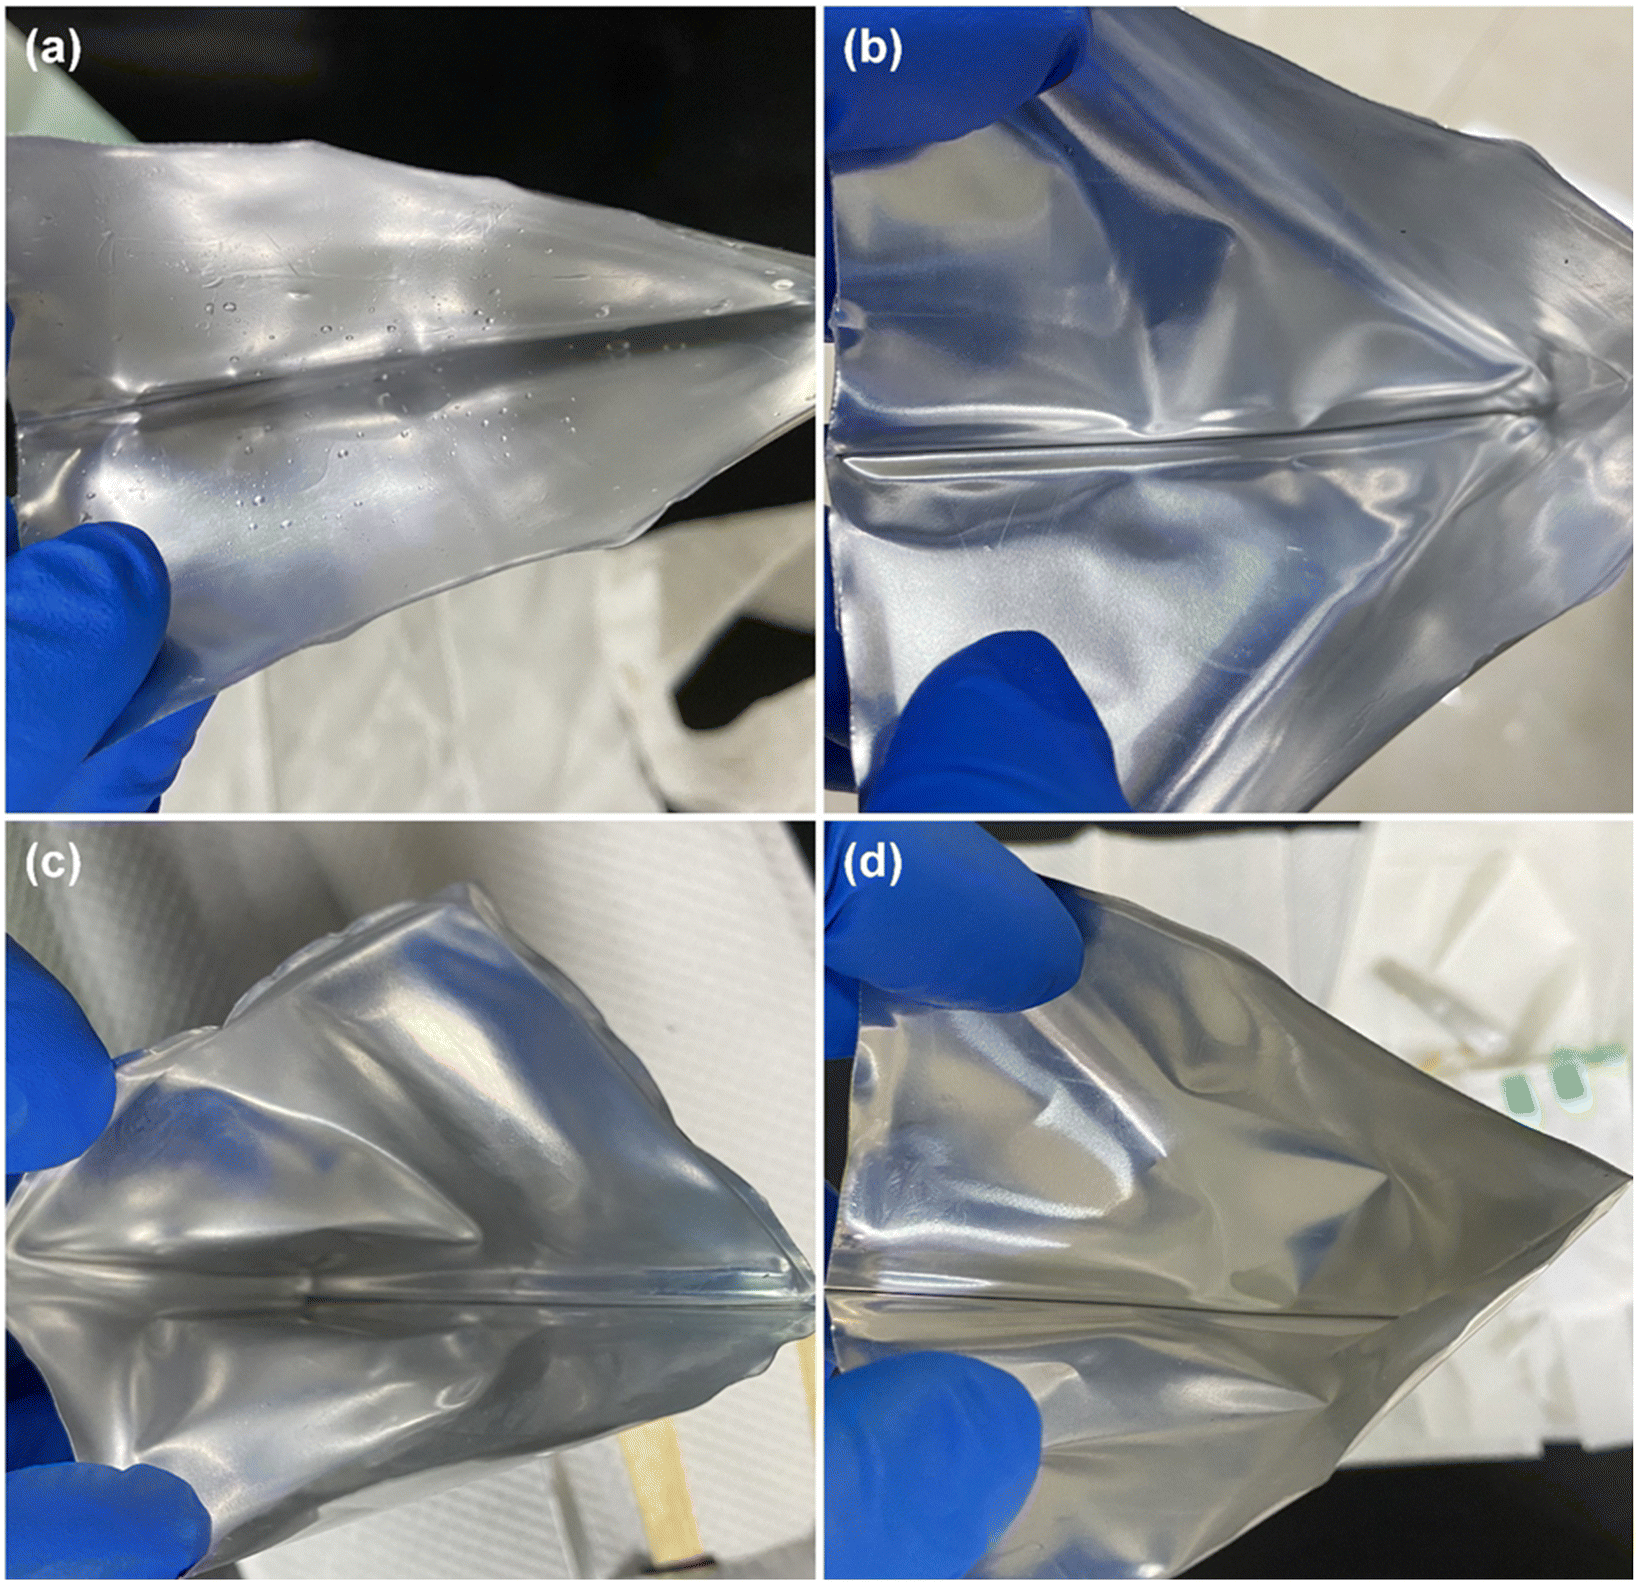 | ||
| Fig. 9 The inner surface of the Al-plastic film of batteries when they have just been dismantled. (a) Fresh and cycled at (b) 25 °C, (c) 35 °C, (d) 45 °C. | ||
From the above comparison, it suggests that the electrolyte in the pouch battery has been consumed in large quantities after the long-time cycle, and the consumption of the electrolyte contributes to the reduction of the amount of active lithium ions in the battery, which is a primary reason for the capacity fading. Moreover, excessive electrolyte consumption can increase resistance to the movement of lithium ions within the battery, causing an increase in impedance. In the case of a fresh battery, the initial electrolyte consumption is relatively small and has minimal impact, as the electrolyte is sufficient to support the movement of lithium ions. However, as electrolyte consumption increases, the latter effect becomes more apparent, accelerating battery failure and capacity changes observed in the 3.1.1. Furthermore, higher temperatures intensify the reaction of electrolyte, therefore, the battery cycles at higher temperatures will experience earlier and more significant effects of electrolyte consumption. This is also the reason why the higher the temperature at, the faster the capacity fading during the (dis)charging cycles (as shown in Fig. 2b–d) and the higher the charge transfer resistance rises in the EIS tests (as indicated in Table 1).
3.3 Discussion
In combination with the aforementioned measurements of the pouch battery's performance, as well as the characterization and analysis of each component after dismantling, we have arrived at an understanding of the failure mechanism. Firstly, from SEM images of the electrodes, we can identify that the long-time cycling at high rate results in the formation of microcracks within the NCM particles. These microcracks allow the electrolyte to infiltrate into the interior of the NCM secondary particles, triggering further reactions between the emerging exposed internal surface and the electrolyte, causing the continuous consumption of electrolyte (Fig. 9). Secondly, the microcracks eventually yields capacity fading (Fig. 2) related to a reduction in the active lithium ions. Meanwhile, microcracks disrupt some electron transfer channels, and the excessive consumption of electrolyte increases the resistance for the movement of lithium ions, ultimately resulting in an increase in the impedance of the pouch battery (Table 1). Thirdly, the byproducts of the electrolyte reaction, such as LiF, Li2CO3, LixPFyOz, etc., accumulate on the electrodes or separators. The residues on the separators cause significantly deterioration of the separator's property to transfer lithium ions, further aggravating the increased battery impedance.In addition, due to the initial excess of electrolyte, the consumption of electrolyte caused by the initial capacity decline is not obvious, mainly due to the reduction of active lithium ions. However, as the electrolyte continues to be consumed, the impact of movement of lithium ions gradually becomes more evident, leading to a rapid capacity decline and ultimate battery failure (Fig. 2).
Besides, a comparison of the battery's failure process across three different temperatures reveals that as the temperature rises (from 25 °C to 45 °C), the battery experiences a more rapid decay (Fig. 2b–d and Table 1). The increase in temperature triggers an intensification of the electrolyte reaction, leading to faster consumption. This hastens battery failure through the aforementioned three mechanisms related to the electrolyte. Therefore, the higher the temperature, the faster the battery failure.
4 Conclusion
In summary, we conducted the high-rate cycling experiments on LTO-NCM622 pouch batteries across various temperatures. By thoroughly analyzing the battery's electrochemical performance and the components' properties, we have identified the failure mechanism. The root cause of the battery failure is determined to be the microcracks within the NCM particles. These microcracks facilitate the reaction with electrolyte, leading to its consumption, which is the direct cause. The electrolyte consumption, in turn, leads to battery failure through three mechanisms. Furthermore, an increase in temperature intensifies the electrolyte reaction, accelerating its consumption and further hastening the battery failure process, whether it manifests as capacity fading or impedance rise.Conflicts of interest
The authors declare that the research was conducted in the absence of any commercial or financial relationships that could be construed as a potential conflict of interest.Acknowledgements
The authors would acknowledge the financial support from National Natural Science Foundation of China (U20A2072).References
- J. B. Goodenough and K. S. Park, J. Am. Chem. Soc., 2013, 135, 1167–1176 CrossRef CAS PubMed.
- P. Simon, Y. Gogotsi and B. Dunn, Science, 2014, 343, 1210–1211 CrossRef CAS PubMed.
- B. Zhao, R. Ran, M. Liu and Z. Shao, Mater. Sci. Eng., R, 2015, 98, 1–71 CrossRef.
- H. Zheng, L. Zhang, G. Liu, X. Song and V. S. Battaglia, J. Power Sources, 2012, 217, 530–537 CrossRef CAS.
- C. Shen, G. Hu, L. Z. Cheong, S. Huang, J. Zhang and D. Wang, Small Methods, 2018, 2, 1700298 CrossRef.
- D. Aurbach, E. Zinigrad, Y. Cohen and H. Teller, Solid State Ionics, 2002, 148, 405–416 CrossRef CAS.
- D. Aurbach, B. Markovsky, I. Weissman, E. Levi and Y. Ein-Eli, Electrochim. Acta, 1999, 45, 67–86 CrossRef CAS.
- T. Ohzuku, A. Ueda and N. Yamamoto, J. Electrochem. Soc., 1995, 142, 1431 CrossRef CAS.
- T. Nordh, Li4Ti5O12 as an Anode Material for Li Ion Batteries in Situ XRD and XPS Studies, 2013 Search PubMed.
- Y. Tan and B. Xue, J. Inorg. Mater., 2018, 33, 475–482 CrossRef.
- Z. Chen, I. Belharouak, Y. K. Sun and K. Amine, Adv. Funct. Mater., 2013, 23, 959–969 CrossRef CAS.
- J. F. Colin, V. Godbole and P. Novák, Electrochem. Commun., 2010, 12, 804–807 CrossRef CAS.
- G. G. Amatucci, F. Badway, A. Du Pasquier and T. Zheng, J. Electrochem. Soc., 2001, 148, A930 CrossRef CAS.
- M. Chen, M. Y. Zhao, F. Liu, M. T. Li, M. L. Zhang, X. Qian, Z. Yuan, C. Li and R. Wan, Langmuir, 2024, 40, 4852–4859 CrossRef CAS PubMed.
- M. Chen, F. Liu, S. Chen, X. Qian, Y. Zhao, Y. Sun, C. Li, R. Wan and Z. Yuan, New J. Chem., 2023, 47, 3215–3221 RSC.
- M. Chen, F. Liu, S. Chen, R. Wan, X. Qian and Z. Yuan, New J. Chem., 2023, 47, 765–771 RSC.
- M. Chen, F. Liu, H. Zhao, S. Chen, X. Qian, Z. Yuan and R. Wan, Phys. Chem. Chem. Phys., 2022, 24, 27114–27120 RSC.
- C. Lv, C. Lin and X. Zhao, eScience, 2023, 3, 100179 CrossRef.
- E. Kang, Y. S. Jung, G. H. Kim, J. Chun, U. Wiesner, A. C. Dillon, J. K. Kim and J. Lee, Adv. Funct. Mater., 2011, 21, 4349–4357 CrossRef CAS.
- S. Chen, Y. Xin, Y. Zhou, Y. Ma, H. Zhou and L. Qi, Energy Environ. Sci., 2014, 7, 1924–1930 RSC.
- X. Bai, T. Li, C. Wei, Y. K. Sun, Y. X. Qi, H. L. Zhu, N. Lun and Y. J. Bai, Electrochim. Acta, 2015, 155, 132–139 CrossRef CAS.
- S. Liu, M. Winter, M. Lewerenz, J. Becker, D. U. Sauer, Z. Ma and J. Jiang, Energy, 2019, 173, 1041–1053 CrossRef CAS.
- X. Bai, T. Li and Y. J. Bai, Dalton Trans., 2020, 49, 10003–10010 RSC.
- F. Huang, J. Ma, H. Xia, Y. Huang, L. Zhao, S. Su, F. Kang and Y. B. He, ACS Appl. Mater. Interfaces, 2019, 11, 37357–37364 CrossRef CAS PubMed.
- F. Hu, M. Lin, S. Liu, X. Yan, Y. Chu and Y. Jin, Energy Storage Sci. Technol., 2016, 5, 454 Search PubMed.
- B. Aktekin, M. J. Lacey, T. Nordh, R. Younesi, C. Tengstedt, W. Zipprich, D. Brandell and K. Edström, J. Phys. Chem. C, 2018, 122, 11234–11248 CrossRef CAS.
- H. H. Ryu, B. Namkoong, J. H. Kim, I. Belharouak, C. S. Yoon and Y. K. Sun, ACS Energy Lett., 2021, 6, 2726–2734 CrossRef CAS.
- Z. Ren, X. Zhang, M. Liu, J. Zhou, S. Sun, H. He and D. Wang, J. Power Sources, 2019, 416, 104–110 CrossRef CAS.
- Y. Bi, J. Tao, Y. Wu, L. Li, Y. Xu, E. Hu, B. Wu, J. Hu, C. Wang, J. Zhang, Y. Qi and J. Xiao, Science, 2020, 370, 1313–1317 CrossRef CAS PubMed.
- F. Zhang, S. Lou, S. Li, Z. Yu, Q. Liu, A. Dai, C. Cao, M. F. Toney, M. Ge, X. Xiao, W. K. Lee, Y. Yao, J. Deng, T. Liu, Y. Tang, G. Yin, J. Lu, D. Su and J. Wang, Nat. Commun., 2020, 11, 3050 CrossRef CAS PubMed.
- M. D. Radin, J. Alvarado, Y. S. Meng and A. Van der Ven, Nano Lett., 2017, 17, 7789–7795 CrossRef CAS PubMed.
- W. Liu, B. Zhou, X. Wang, J. Gao and X. Liu, Chin. J. Power Sources, 2012, 36, 306–309 CAS.
- T. Ohzuku, A. Ueda and M. Nagayama, J. Electrochem. Soc., 1993, 140, 1862 CrossRef CAS.
- W. T. Jeong and K. S. Lee, J. Power Sources, 2002, 104, 195–200 CrossRef CAS.
- L. Q. Wang, L. F. Jiao, H. Yuan, J. Guo, M. Zhao, H. X. Li and Y. M. Wang, J. Power Sources, 2006, 162, 1367–1372 CrossRef CAS.
- Y. Idemoto and T. Matsui, Solid State Ionics, 2008, 179, 625–635 CrossRef CAS.
- Z. D. Huang, X. M. Liu, S. W. Oh, B. Zhang, P. C. Ma and J. K. Kim, J. Mater. Chem., 2011, 21, 10777–10784 RSC.
- J. P. Contour, A. Salesse, M. Froment, M. Garreau, J. Thevenin and D. Warin, J. Microsc. Spectrosc. Electron., 1979, 4, 483–491 CAS.
- J. Chastain and R. C. King Jr, Handbook of X-ray photoelectron spectroscopy, Perkin-Elmer Corporation, 1992, vol. 40, p. 221 Search PubMed.
- W. E. Morgan, J. R. Van Wazer and W. J. Stec, J. Am. Chem. Soc., 1973, 95, 751–755 CrossRef CAS.
- G. Gusmano, G. Montesperelli, E. Traversa, A. Bearzotti, G. Petrocco, A. D'amico and C. D. Natale, Sens. Actuators, B, 1992, 7, 460–463 CrossRef CAS.
- X. Huang, L. Wu, Z. Huang, J. Lin and X. Xu, Energy Storage Sci. Technol., 2020, 9, 479–500 Search PubMed.
- I. M. Hodge, M. D. Ingram and A. R. West, J. Electroanal. Chem. Interfacial Electrochem., 1976, 74, 125–143 CrossRef CAS.
- Y. Lu, X. Huang, Y. Ruan, Q. Wang, R. Kun, J. Yang and Z. Wen, J. Mater. Chem. A, 2018, 6, 18853–18858 RSC.
Footnote |
| † Electronic supplementary information (ESI) available. See DOI: https://doi.org/10.1039/d4ra00923a |
| This journal is © The Royal Society of Chemistry 2024 |