 Open Access Article
Determination of moxifloxacin in milk using a ratiometric fluorescent sensor based on Ag-MOF@curcumin†
Jiaxing Zhaoa,
Kedan Wangb,
Yu Songb,
Lu Lia,
Fan Yangbc,
Lijuan Zhaoa,
Qihui Wang*b and
Guowei Deng *b
*b
aCollege of Chemistry and Materials Science, Sichuan Normal University, Chengdu 610068, Sichuan, China
bCollege of Chemistry and Life Science, Sichuan Provincial Key Laboratory for Structural Optimization and Application of Functional Molecules, Chengdu Normal University, Chengdu, 611130, China. E-mail: guoguo515@126.com; guoweideng86@163.com
cSichuan Provincial Engineering Laboratory of Livestock Manure Treatment and Recycling, Sichuan Normal University, Chengdu, 610068, Sichuan, China
First published on 25th April 2024
Abstract
Moxifloxacin (MFX) has attracted increasing public concern recently, and the development of a simple and effective analysis method has become a research focus. In this work, a simple, sensitive and ratiometric fluorescent sensor based on Ag-MOF@curcumin was designed and investigated. Ag-MOF@curcumin displays emission at 410 nm and 475 nm under excitation at 330 nm. When MFX is added, a new emission peak appears at 500 nm, and the F500/F410 ratio has a linear relationship with the MFX concentration in the range 0–35 μmol L−1 with a low LOD (0.179 μmol L−1). Finally, the developed sensor was used for the determination of MFX in milk. This work provides an excellent fluorescent sensor for highly selective and rapid detection of MFX residues.
1 Introduction
Antibiotics including fluoroquinolones, macrolides, cephalosporins, and tetracyclines, among many others, are approved for treatment, disease control, prevention and production uses in life,1–4 and they play important roles in the treatment of bacterial infections in humans and animals.5–9 However, the frequent use of antibiotics in agriculture and veterinary medicine generates antibiotic residues and environmental pollution.10 Ultimately, human health will be affected by these antibiotic residues through the ecological cycle and food chain accumulation, as a consequence of which, the environmental surveillance of antibiotics is of great importance for the protection of human, animal and ecosystem health.11,12 Moxifloxacin (MFX), a fluoroquinolone antibiotic, can be used to treat pneumonia, skin and skin structure infections, and increases heart rate in humans,13 but a survey also showed that MFX can induce tinnitus in older adults.14 Therefore, it is very necessary to establish an effective MFX determination method, especially for the analysis of MFX content in food and water.To detect antibiotics in samples, various methods based on high-performance liquid chromatography (HPLC),15 cyclic voltammetry (CV) analysis,16 chemiluminescence,17 liquid chromatography mass spectrometry18 and fluorescence sensors19 have been developed. Owing to their advantages of simple operation, short detection time, high sensitivity and good selectivity,20–23 fluorescent sensors have become the ideal method for antibiotics.
Recently, MOF-based fluorescent sensors have been reported to detect antibiotics.24–33 However, some reported sensors did not exhibit good selectivity owing to the lack of recognition sites. Determining how to improve the selectivity of MOF-based sensors for the detection of antibiotics has become an important issue. Dual emission fluorescent sensors can achieve higher analysis accuracy by self-calibrating two fluorescence intensities compared to a single transmission signal. The use of dual emission ratio fluorescence sensors provide new insight to develop MOF-based fluorescence sensors for antibiotics detection.34
In this work, a silver-based MOF (Ag-MOF) and curcumin with λem centered at 525 nm and a high fluorescence quantum yield, were chosen as fluorescent materials to construct a simple dual emission ratio fluorescence sensor. Ag-MOF and curcumin solution were simply mixed to obtain the Ag-MOF@curcumin solution. When excited at 330 nm, the Ag-MOF@curcumin solution exhibited emission peaks at 410 nm and 475 nm. With the addition of different antibiotics, the emission performance changed dramatically. The emission peak at 475 nm gradually shifted towards 500 nm only when MXF was added, which indicated that the sensor has good selectivity for MXF. The research also found that the fluorescence intensity ratio (F500/F410) has a linear relationship to the MFX concentration in the range 0–35 μmol L−1, when the fluorescence sensor was excited at 330 nm, which endows the sensor with the ability to achieve quantitative MFX determination. Finally, the developing sensor was used to determine MXF in milk and exhibited good performance.
2 Experimental
2.1 Chemicals and instrumentation
All chemicals are of analytical grade unless otherwise stated. Distilled water was used throughout. The stock standard solution of MFX (0.01 mol L−1) was prepared by dissolving MFX in water. The working standard solutions were prepared by diluting the stock standard solutions with distilled water. Powder X-ray diffraction (XRD) measurements were performed using a Bruker D8 X-ray diffractometer in the 2θ range of 10–80°. X-ray photoelectron spectroscopy (XPS) was performed with a Thermo Fisher Scientific K-Alpha electron spectrometer. Fourier transform infrared (FTIR) spectroscopy was carried out using a Nicolet NEXUS spectrometer. Scanning electron microscopy (SEM) was carried out using a JSM-6701F. UV-vis spectra were collected with a UV-2600 spectrometer. A F-4600 fluorescence spectrophotometer was used for the fluorescence determination.2.2 Preparation of Ag-MOF@curcumin
Ag-MOF was synthesized according to the reported method.24 Next, Ag-MOF@curcumin was prepared in situ through mixing curcumin (0.5 mg mL−1, 50 μL) and Ag-MOF (0.07 mg mL−1, 200 μL) solution in 1750 μL acetonitrile and allowing the mixture to stand for half an hour.2.3 Preparation of metal ion and antibiotic stock solutions
Stock solutions of metal ions and amino acids with a concentration of 1 mg mL−1 were prepared by dissolving their respective salts in distilled water. Additionally, solutions of the antibiotics thiamphenicol (TAP), florfenicol (FF), erythromycin (ERY), ciprofloxacin hydrochloride (CIP), and chloramphenicol (CAP) were prepared at a concentration of 0.001 mol L−1 to assess selectivity. A solution of curcumin (0.5 mg mL−1) was prepared in acetonitrile, and Ag-MOF (0.07 mg mL−1) was also dispersed in acetonitrile.2.4 Fluorescence spectrum measurements
In the selectivity test, 50 μL of 0.001 mol L−1 antibiotic solution was added to 2 mL of Ag-MOF@curcumin solution, and fluorescence spectra were measured at room temperature. Fluorescence spectrum measurement conditions: the excitation wavelength was 330 nm, and excitation and emission slits were 5 nm each.3 Results and discussion
3.1 Characterization of Ag-MOF@curcumin
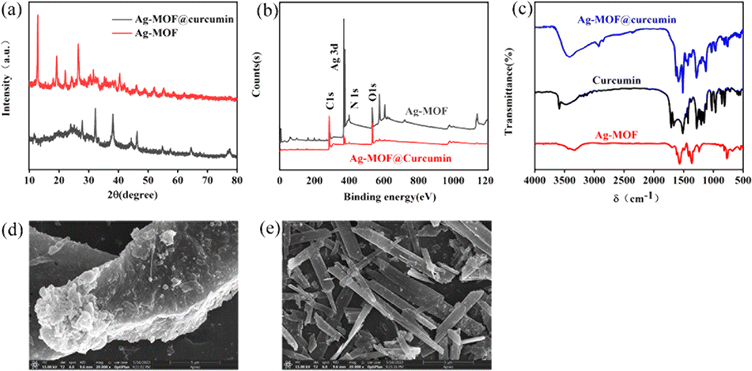
The crystalline structure and phase formation of Ag-MOF@curcumin and Ag-MOF were studied using XRD. The observed and simulated diffraction patterns of Ag-MOF and Ag-MOF@curcumin are shown Fig. 1a. The main characteristic diffraction peaks of Ag-MOF are located at 27.82, 32.26, 38.12, and 46.3° and are basically consistent with simulated peaks described in the literature, suggesting the successful synthesis of highly crystalline Ag-MOF particles. For Ag-MOF@curcumin, main characteristic diffraction peaks were 12.88, 19.26, 22.1, 26.46, and 40.44°, which indicated that curcumin affected the crystalline structure of Ag-MOF. The XPS survey spectra of Ag-MOFs and Ag-MOF@curcumin can be seen in Fig. 1b. In the spectrum of Ag-MOF, elements Ag, C, O, and N can be detected, and the binding energies of C 1s, O 1s, and N 1s are located at 284.8, 531.8, and 399.5 eV, respectively. The binding energy peaks of Ag 3d5/2 and Ag 3d3/2 can also be clearly observed at 368.7 eV and 374.6 eV, respectively. The spin–orbit-coupling-related energy separation between these two peaks is 6 eV, which often indicates the presence of Ag in the prepared MOF.34–36 Conversely, the binding energies of C 1s, O 1s, and N 1s for Ag-MOF@curcumin are located at 284.8 eV, 533.1 eV, and 399.8 eV, respectively. Binding energy peaks are also observed at 368.5 eV and 374.5 eV, which indicates the presence of Ag in the prepared Ag-MOF@curcumin. The high-resolution C 1s, Ag 3d, O 1s and N 1s spectra of Ag-MOF@curcumin and Ag-MOF are shown in Fig. S1 and S2.† Using a Gaussian fitting method, the C 1s emission spectrum can be divided into four peaks. The binding energy at 284.48 eV obtained in the XPS analysis was standardized for specimen charging using C 1s as the reference. The peak approximately at 288.44 eV is attributed to C![[double bond, length as m-dash]](https://www.rsc.org/images/entities/char_e001.gif) O, while peaks at 285.37 eV, 285.29 eV and 399.84 eV are assigned to C–C, C
O, while peaks at 285.37 eV, 285.29 eV and 399.84 eV are assigned to C–C, C![[double bond, length as m-dash]](https://www.rsc.org/images/entities/char_e001.gif) C and N–H, respectively.34,35 In the case of high-resolution O 1s spectra, the peak located at 531.58 eV and 533.29 eV are assigned to C
C and N–H, respectively.34,35 In the case of high-resolution O 1s spectra, the peak located at 531.58 eV and 533.29 eV are assigned to C![[double bond, length as m-dash]](https://www.rsc.org/images/entities/char_e001.gif) O (O–C–O) and C–O (C–O–H), respectively, and the peak at 532.78 eV perhaps comes from metal oxygen bonds.35
O (O–C–O) and C–O (C–O–H), respectively, and the peak at 532.78 eV perhaps comes from metal oxygen bonds.35
Ag-MOF@curcumin was also characterized using FT-IR spectroscopy, as shown in Fig. 1c. The absorption band at 3409 cm−1 corresponds of tensile vibration of curcumin –OH groups bonded between hydrogen atoms. The intense absorption peaks at 1585, 1580, 1513 and 1503 cm−1 correspond to the symmetric and asymmetric vibrations of the benzene skeleton. The band at 761 cm−1 indicates the presence of Ag–O. Compared with those of Ag-MOF and curcumin, it can be found that the characteristic peaks of Ag-MOF and curcumin changed in Ag-MOF@curcumin, indicating that a non-covalent interaction may exist between curcumin and Ag-MOF in Ag-MOF@curcumin.
The morphology of the prepared Ag-MOF@curcumin and Ag-MOF were studied using SEM. As shown in Fig. 1d and e, Ag-MOF displays a rod-like structure, while Ag-MOF@curcumin becomes rough, and scales also increase obviously, which indicated that curcumin was adsorbed on the Ag-MOF surface when they were mixed.
3.2 Photophysical properties of Ag-MOF@curcumin
As shown in Fig. 2a, the UV-vis absorption spectrum of Ag-MOF shows two obvious absorption peaks at 258 nm and 335 nm. The fluorescence spectra indicate that the maximum excitation and emission wavelengths of Ag-MOF are located at 325 nm and 426 nm (Fig. 2b), respectively. Curcumin shows an obvious absorption peak at 265 nm and 420 nm, and maximum excitation and emission wavelengths are located at 450 nm and 520 nm, respectively (Fig. 2b). Ag-MOF@curcumin has an absorption region of 200–600 nm. Under an excitation wavelength of 330 nm, the maximum emission wavelengths of Ag-MOF@curcumin are located at 410 nm and 475 nm (Fig. 2a and b). Compared to the emission peaks of Ag-MOF and curcumin, the emission peak of Ag-MOF@curcumin has significant a blue-shift.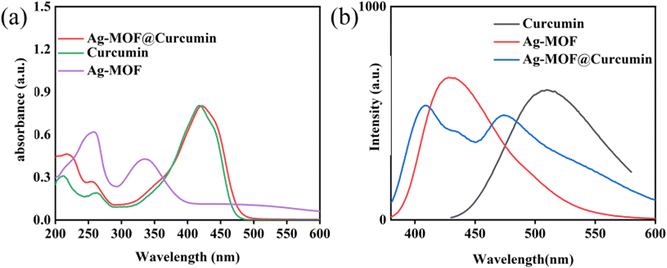 | ||
| Fig. 2 (a) UV-vis spectra of Ag-MOF@curcumin, curcumin and Ag-MOF; (b) fluorescence emission spectra of Ag-MOF@curcumin, curcumin and Ag-MOF. | ||
To obtain accurate and stable results, the time needed to achieve solution stability (10, 30, 60, 80, and 100 min, Fig. 3a), the excitation wavelength (300–350 nm, Fig. 3b) and storage time (0, 24, 48, 72, 96, and 120 h, Fig. 3c) were further investigated. The solution reaches stability after 30 min, and the maximum excitation wavelength was 330 nm. In addition, the solution was stable for 5 days.
 | ||
| Fig. 3 (a) Time needed to achieve solution stability; (b) fluorescence emission spectra of Ag-MOF@curcumin at various excitation wavelengths (300–350 nm); (c) storage time of Ag-MOF@curcumin. | ||
3.3 Study of the fluorescent sensing performance
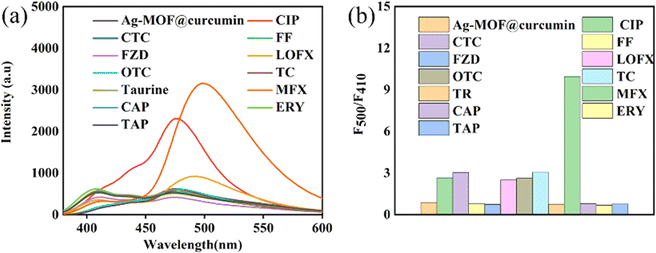
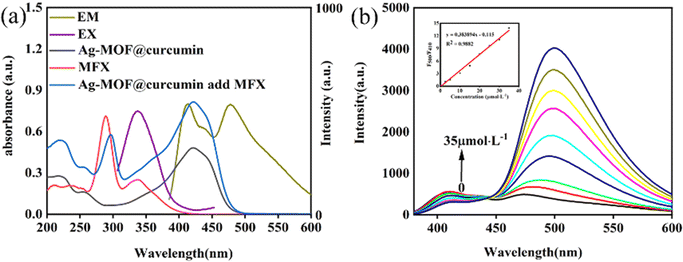
The sensing performance of Ag-MOF@curcumin toward different antibiotics was investigated. LOFX, FF, CAP, ERY, TAP, CIP, CT, OTC, CTC, FZD, MFX and taurine were added to the Ag-MOF@curcumin solution at a concentration of 25 μmol L−1, and resulting emission spectra are presented in Fig. 4a. The spectrum exhibited more obvious changes when MFX was added compared with the other antibiotics. A new emission peak appeared near 500 nm; thus, Ag-MOF@curcumin can be used as a sensor to selectively determine MFX. The value of the ratio F500/F410 for Ag-MOF@curcumin when the different antibiotics were added was also investigated (Fig. 4b). It can be found that the value of F500/F410 increased more obviously with the addition of MFX compared to the other antibiotics, which further demonstrated the superior selectivity of Ag-MOF@curcumin for MFX. The sensing performance of curcumin and Ag-MOF for the antibiotics was also studied (Fig. S3 and S4†), and the results indicated that neither curcumin alone nor Ag-MOF alone could determine MFX selectively, and that the simple combination of curcumin and Ag-MOF effectively solved the problem of lack of selectivity.As shown in Fig. 5a, the prepared Ag-MOF@curcumin shows emission at 410 nm and 475 nm under the excitation wavelength of 330 nm. After the addition of MFX, the emission peak at 500 nm of Ag-MOF@curcumin is strengthened, and the ratio F500/F410 increases linearly with the concentration of MFX. Therefore, the concentration of MFX can be determined according to the change in the fluorescence intensity ratio. The fluorescence titration of Ag-MOF@curcumin in acetonitrile using MFX was studied. It can be seen from Fig. 5b that the F500/F410 ratio gradually increased with increasing MFX concentration from 0 to 35 μmol L−1. The value of F500/F410 increases linearly as the MFX concentration increases, and the linear equation was y = 0.383894x–0.115, (R2 = 0.9882). The limit of detection (LOD) was calculated to be 0.179 μmol L−1 according to the expression 3S/KSV, where KSV is the slope of the calibration curve, and S stands for the standard deviation of blank (n = 12).
3.4 Interference studies and mechanism of fluorescent sensing
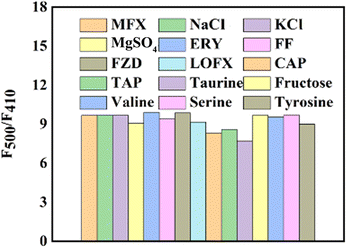
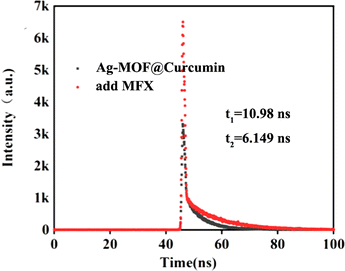
To assess the impact of biochemicals or ions on the detection of MFX (25 μmol L−1), various substances, namely, KCl, NaCl, MgSO4 (1 mg mL−1), CAP, FF, TAP, LOFX, taurine, FZD, ERY (25 μmol L−1), fructose, valine, serine, and tyrosine (125 μmol L−1), were used to evaluate the anti-interference capability of Ag-MOF@curcumin. As shown in Fig. 6, the value of F500/F410 changed only slightly, which demonstrated that the sensors had good anti-interference ability.The fluorescence lifetime of Ag-MOF@curcumin with and without MFX was investigated. As shown in Fig. 7, the lifetime of Ag-MOF@curcumin is 10.98 ns, while the averaged lifetime of Ag-MOF@curcumin with MFX is 6.149 ns. The change in the lifetime confirms fluorescence resonance energy transfer (FRET) between MFX and Ag-MOF@curcumin. Additionally, the excitation bands of Ag-MOF@curcumin and UV-vis absorption of MFX were considerably overlapped (Fig. 5a), demonstrating the occurrence of the inner filter effect (IFE). As a result, the fluorescence enhancement effect of MFX could be partly ascribed to the fluorescence resonance energy transfer (FRET) and inner filter effect (IFE).
3.5 Sensing MFX in real samples
The accuracy and practicality of the developed Ag-MOF@curcumin fluorescent sensor for MFX analysis in milk samples were assessed. Liquid milk samples were purchased from a local supermarket. The milk was pre-treated according to a method reported in the literature with some modifications37,38. First, 4 mL acetonitrile was added to 2 mL liquid milk with different concentrations of MFX (15.00 μmol L−1, 25.00 μmol L−1, and 30.00 μmol L−1). Then, the sample was stirred at medium speed for 15 min. Afterwards, the above solution was centrifuged at 9000 rpm for 10 min, and the upper supernatant was then transferred to a beaker for future usage. Next, 4 mL of acetonitrile was added to the residue, and the extraction was repeated three times. The three extracts were combined and rotary-evaporated at 60 °C. The residue was dissolved in 2 mL of deionized water.Ag-MOF@curcumin and the sample containing different concentrations of MFX were tested. The fluorescence signals at 410 nm and 500 nm (F500/F410) were recorded under optimized experimental conditions. As can be seen in Table 1, satisfactory recoveries ranging from 90.63% to 107.15% were obtained. In addition, satisfactory inter-day precisions (relative standard deviations, RSD, n = 6) were achieved with RSDs of less than 5%, which showed that this method has good precision for the analysis of MFX. Compared with the other methods for MFX determination listed in Table S1,† the established method exhibited the merit of a lower LOD.
| Added (μmol L−1) | Found | Recovery % | RSD% |
|---|---|---|---|
| 15.00 | 15.71 | 104.71 | 3.50 |
| 14.06 | 93.76 | ||
| 15.71 | 104.71 | ||
| 25.00 | 26.79 | 107.15 | 4.40 |
| 23.37 | 93.50 | ||
| 23.83 | 95.29 | ||
| 30.00 | 27.19 | 90.63 | 4.10 |
| 28.42 | 94.74 | ||
| 28.42 | 94.74 |
4 Conclusions
Ag-MOF@curcumin was successfully developed as a sensitive and reliable fluorescent sensor for the determination of MFX. The ratio F500/F410 shows a linear relationship with the concentration of MFX in the range 0–35 μmol L−1, allowing the realization of quantitative detection of MFX in real samples. By analysing UV-vis absorption spectra and fluorescence lifetime, the fluorescence enhancement was determined to be due to IFE and FRET. The method showed a low limit of detection and satisfactory recoveries, making it a practical method for the determination of MFX in food matrices.Author contributions
Jiaxing Zhao: data curation, methodology, investigation, writing – original draft. Kedan Wang, Yu Song, Lu Li: data curation. Fang Yang: writing – review. Lijuan Zhao, Qihui Wang: investigation, writing – review & editing. Guowei Deng: investigation, writing – review & editing, funding acquisition.Conflicts of interest
There are no conflicts to declare.Acknowledgements
This work is supported by the Engineering Research Center for the Development of Farmland Ecosystem Service Functions, Sichuan Province Institutions of Higher Education, Sichuan Provincial Engineering Laboratory of Livestock Manure Treatment and Recycling (202302), and the Scientific Research Innovation Team Funds of Chengdu Normal University (No. CSCXTD2020A05).Notes and references
- L. Andrew Selaledi, Z. Mohammed Hassan, T. G. Manyelo and M. Mabelebele, The Current Status of the Alternative Use to Antibiotics in Poultry Production: An African Perspective, Antibiotics, 2020, 9, 594 CrossRef PubMed.
- Q. Bu, B. Wang, J. Huang, S. Deng and G. Yu, Pharmaceuticals and personal care products in the aquatic environment in China: A review, J. Hazard. Mater., 2013, 262, 189–211 CrossRef CAS PubMed.
- B. V. Lubbers, Pharmacological considerations of antibiotic failures in bovine respiratory disease cases, Anim. Health Res. Rev., 2020, 21, 177–178 CrossRef PubMed.
- B. Vishwa, A. Moin, D. V. Gowda, S. M. D. Rizvi, W. A. H. Hegazy, A. S. Abu Lila, E.-S. Khafagy and A. N. Allam, Pulmonary Targeting of Inhalable Moxifloxacin Microspheres for Effective Management of Tuberculosis, Pharmaceutics, 2021, 13, 79 CrossRef CAS PubMed.
- S. Bhatt and S. Chatterjee, Fluoroquinolone antibiotics: Occurrence, mode of action, resistance, environmental detection, and remediation – A comprehensive review, Environ. Pollut., 2022, 315, 120440 CrossRef CAS PubMed.
- J. A. Paulson, T. E. Zaoutis, T. C. O. E. HEALTH, T. C. O. I. DISEASES, J. A. Paulson, S. Ahdoot, C. R. Baum, A. Bole, H. L. Brumberg, C. C. Campbell, B. P. Lanphear, J. A. Lowry, S. E. Pacheco, A. J. Spanier, L. Trasande, C. L. Byington, Y. A. Maldonado, E. D. Barnett, H. D. Davies, K. M. Edwards, M. A. Jackson, D. L. Murray, A.-C. Nyquist, M. H. Rathore, M. H. Sawyer, G. E. Schutze, R. E. Willoughby and T. E. Zaoutis, Nontherapeutic Use of Antimicrobial Agents in Animal Agriculture: Implications for Pediatrics, Pediatrics, 2015, 136, e1670–e1677 CrossRef PubMed.
- S. H. Gillespie, The role of moxifloxacin in tuberculosis therapy, Eur. Respir. Rev., 2016, 25, 19–28 CrossRef PubMed.
- T. Wang, W. H. Jang, S. Lee, C. J. Yoon, J. H. Lee, B. Kim, S. Hwang, C.-P. Hong, Y. Yoon, G. Lee, V.-H. Le, S. Bok, G. O. Ahn, J. Lee, Y. S. Gho, E. Chung, S. Kim, M. H. Jang, S.-J. Myung, M. J. Kim, P. T. C. So and K. H. Kim, Moxifloxacin: Clinically compatible contrast agent for multiphoton imaging, Sci. Rep., 2016, 6, 27142 CrossRef CAS PubMed.
- Q. Wang, M. Yang, X. Qi, J. Wang, K. Sun, Z. Li and G. Deng, A novel graphene oxide decorated with halloysite nanotubes (HNTs/GO) composite used for the removal of levofloxacin and ciprofloxacin in a wide pH range, New J. Chem., 2021, 45, 18315–18326 RSC.
- A. S. Schmidt, M. S. Bruun, I. Dalsgaard and J. L. Larsen, Incidence, Distribution, and Spread of Tetracycline Resistance Determinants and Integron-Associated Antibiotic Resistance Genes among Motile Aeromonads from a Fish Farming Environment, Appl. Environ. Microbiol., 2001, 67, 5675–5682 CrossRef CAS PubMed.
- P. M. C. Huijbers, C.-F. Flach and D. G. J. Larsson, A conceptual framework for the environmental surveillance of antibiotics and antibiotic resistance, Environ. Int., 2019, 130, 104880 CrossRef CAS PubMed.
- L. Fang, Y. Miao, D. Wei, Y. Zhang and Y. Zhou, Efficient removal of norfloxacin in water using magnetic molecularly imprinted polymer, Chemosphere, 2021, 262, 128032 CrossRef CAS PubMed.
- J. W. Mason and T. E. Moon, Moxifloxacin Increases Heart Rate in Humans, Antibiotics, 2017, 6, 5 CrossRef PubMed.
- A. Onoh, S. A. Linnebur and D. R. Fixen, Moxifloxacin-induced tinnitus in an older adult, Ther. Adv. Drug Saf., 2018, 9, 219–221 CrossRef PubMed.
- Y. Zheng, Z. Wang, G. Lui, D. Hirt, J.-M. Treluyer, S. Benaboud, R. Aboura and I. Gana, Simultaneous quantification of levofloxacin, pefloxacin, ciprofloxacin and moxifloxacin in microvolumes of human plasma using high-performance liquid chromatography with ultraviolet detection, Biomed. Chromatogr., 2019, 33, e4506 CrossRef PubMed.
- M. Shehata, A. M. Fekry and A. Walcarius, Moxifloxacin Hydrochloride Electrochemical Detection at Gold Nanoparticles Modified Screen-Printed Electrode, Sensors, 2020, 20, 2797 CrossRef CAS PubMed.
- D. S. Aga, R. Goldfish and P. Kulshrestha, Application of ELISA in determining the fate of tetracyclines in land-applied livestock wastes, Analyst, 2003, 128, 658–662 RSC.
- X. Zheng, Y. Mei and Z. Zhang, Flow-injection chemiluminescence determination of tetracyclines with in situ electrogenerated bromine as the oxidant, Anal. Chim. Acta, 2001, 440, 143–149 CrossRef CAS.
- Z. Li, J. Zhang, Q. Sun, W. Shi, T. Tao and Y. Fu, Moxifloxacin detection based on fluorescence resonance energy transfer from carbon quantum dots to moxifloxacin using a ratiometric fluorescence probe, New J. Chem., 2022, 46, 4226–4232 RSC.
- K. F. Kayani and K. M. Omer, A red luminescent europium metal organic framework (Eu-MOF) integrated with a paper strip using smartphone visual detection for determination of folic acid in pharmaceutical formulations, New J. Chem., 2022, 46, 8152–8161 RSC.
- Q. Wang, Y. Wu, X. Bao, M. Yang, J. Liu, K. Sun, Z. Li and G. Deng, Novel fluorescence sensor for the selective recognition of tetracycline based on molecularly imprinted polymer-capped N-doped carbon dots, RSC Adv., 2022, 12, 24778–24785 RSC.
- Y. Wu, X. Wu, B. Niu, Y. Zeng, M. Zhu and H. Guo, Facile fabrication of Ag2(bdc)@Ag nano-composites with strong green emission and their response to sulfide anion in aqueous medium, Sens. Actuators, B, 2018, 255, 3163–3169 CrossRef CAS.
- H. Guo, Y. Zhang, Z. Zheng, H. Lin and Y. Zhang, Facile one-pot fabrication of Ag@MOF(Ag) nanocomposites for highly selective detection of 2,4,6-trinitrophenol in aqueous phase, Talanta, 2017, 170, 146–151 CrossRef CAS PubMed.
- Q. Wang, X. Qi, H. Chen, J. Li, M. Yang, J. Liu, K. Sun, Z. Li and G. Deng, Fluorescence determination of chloramphenicol in milk powder using carbon dot decorated silver metal–organic frameworks, Microchim. Acta, 2022, 189, 272 CrossRef CAS PubMed.
- Z. Wang, X. Jin, L. Yan, Y. Yang and X. Liu, Recent research progress in CDs@MOFs composites: fabrication, property modulation, and application, Microchim. Acta, 2022, 190, 28 CrossRef PubMed.
- M. Marimuthu, S. S. Arumugam, D. Sabarinathan, H. Li and Q. Chen, Metal organic framework based fluorescence sensor for detection of antibiotics, Trends Food Sci. Technol., 2021, 116, 1002–1028 CrossRef CAS.
- X.-D. Zhu, K. Zhang, Y. Wang, W.-W. Long, R.-J. Sa, T.-F. Liu and J. Lü, Fluorescent Metal–Organic Framework (MOF) as a Highly Sensitive and Quickly Responsive Chemical Sensor for the Detection of Antibiotics in Simulated Wastewater, Inorg. Chem., 2018, 57, 1060–1065 CrossRef CAS PubMed.
- Y. Zhao, H. Hao, H. Wang, L. Sun, N. Zhang, X. Zhang and J. Liang, Antibiotic quantitative fluorescence chemical sensor based on Zn-MOF aggregation-induced emission characteristics, Microchem. J., 2023, 190, 108626 CrossRef CAS.
- W. Ji, G. Wang, B. Wang, B. Yan, L. Liu, L. Xu, T. Ma, S. Yao, Y. Fu, L. Zhang and Q. Zhai, A new indium-based MOF as the highly stable luminescent ultra-sensitive antibiotic detector, Chin. J. Struct. Chem., 2023, 42, 100062 CrossRef.
- L. Ding, Y. Cao, H. Li, F. Wang, D.-Y. Guo, W. Yang and Q. Pan, A ratiometric fluorescence-scattering sensor for rapid, sensitive and selective detection of doxycycline in animal foodstuffs, Food Chem., 2022, 373, 131669 CrossRef CAS PubMed.
- Q. Wang, H. Du, R. Tang, X. Wang, L. Xie, J. Liu, K. Sun, Z. Li and G. Deng, Boron difluoride modified zinc metal–organic framework-based “off–on” fluorescence sensor for tetracycline and Al3+ detection, Microchim. Acta, 2024, 191, 144 CrossRef CAS PubMed.
- H. Li, W. Yang and Q. Pan, Integration of fluorescent probes into metal–organic frameworks for improved performances, RSC Adv., 2020, 10, 33879–33893 RSC.
- S. Li, B. Fu, H. Li, Y. Cao, S. Chen, D.-Y. Guo, L. Li and Q. Pan, Eu-doped ZIF-8 as a ratiometric fluorescence-scattering probe for the anthrax biomarker in food samples based on competitive coordination, Spectrochim. Acta, Part A, 2024, 307, 123642 CrossRef CAS PubMed.
- K. Xing, R. Fan, X. Du, X. Zheng, X. Zhou, S. Gai, P. Wang and Y. Yang, Dye-insertion dynamic breathing MOF as dual-emission platform for antibiotics detection and logic molecular operation, Sens. Actuators, B, 2019, 288, 307–315 CrossRef CAS.
- S. A. Shahamirifard, M. Ghaedi and S. Hajati, A new silver (I) ions optical sensor based on nanoporous thin films of sol–gel by rose bengal dye, Sens. Actuators, B, 2018, 259, 20–29 CrossRef CAS.
- A. Shamloufard, S. Hajati, A. A. Youzbashi, K. Dashtian, M. Moradi and J. Toth, S-scheme NIR-edge Ag3CuS2/VO2 heterostructure for photo-oxidation/reduction of methylene blue/Cr (VI), Appl. Surf. Sci., 2022, 590, 153118 CrossRef CAS.
- J. Hösl, A. Gessner and N. El-Najjar, Liquid chromatography-tandem mass spectrometry for the quantification of moxifloxacin, ciprofloxacin, daptomycin, caspofungin, and isavuconazole in human plasma, J. Pharm. Biomed. Anal., 2018, 157, 92–99 CrossRef PubMed.
- X. Yue, C. Wu, Z. Zhou, L. Fu and Y. Bai, Fluorescent Sensing of Ciprofloxacin and Chloramphenicol in Milk Samples via Inner Filter Effect and Photoinduced Electron Transfer Based on Nanosized Rod-Shaped Eu-MOF, Foods, 2022, 11, 3138 CrossRef CAS PubMed.
Footnote |
| † Electronic supplementary information (ESI) available. See DOI: https://doi.org/10.1039/d4ra00906a |
| This journal is © The Royal Society of Chemistry 2024 |

